


Long-term stability is a basic requirement for the industrialization of perovskite solar cells. As a result, there has been a surge in publications on aging experiments in recent years (Figure 1).
The degradation of solar cells is inevitable. Commercial silicon solar cells typically degrade by 0.5% to 0.8% per year. They have a warranty of 25 years, but their performance deteriorates during this period [1] . Stability studies aim to delay or slow down the degradation process as much as possible. Identifying degradation mechanisms is a daunting task. It requires a holistic approach, as all solar cell components (electrodes, interfaces, packages) interact with each other, resulting in degradation and evolution over time.
The right approach to understanding degradation requires a combination of long-term performance measurements and advanced techniques for characterizing materials and optoelectronic properties. The latter allows us to isolate and study the degraded parts. Without these techniques, stability data would be interpreted in a variety of ways.
This blog post presents a temperature-dependent degradation study for perovskite solar cells optimized for bifacial two-terminal series devices. We observe that higher temperatures damage perovskite layers rather than accelerate degradation pathways. At the same time, devices that age at room temperature show a higher density of mobile ions than new devices.
These conclusions are made possible by a combination of materials (XRD, SEM) and electrical characterization (JV, capacitance and transient analysis).
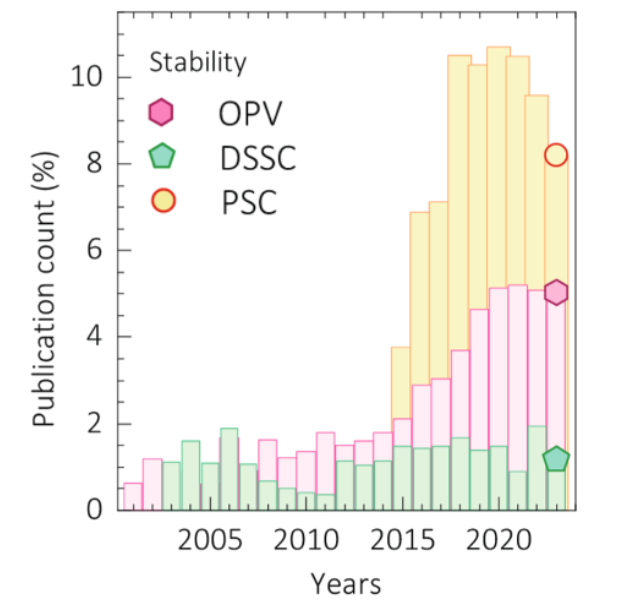
Figure 1: Percentage of studies including organic/hybrid material-based solar cell stability studies. [2]
way
In this study, we tested perovskite solar cells made of perovskite semiconductors (CsFaPbI3) with a bandgap of 1.57 eV. The solar cell has a p-i-n structure. This bandgap is ideal for use as a perovskite top cell in bifacial two-ended series devices. In a bifacial series device, the light on the back side increases the current of the underlying battery. Perovskites with a narrow bandgap have a larger current, which can be well matched with the larger current of the underlying cell.
Figure 2 illustrates the device structure. The electron transport layer is composed of C60 and SnO2, and MeO-2PACz and ITO are used as hole extraction layers and contact layers, respectively.
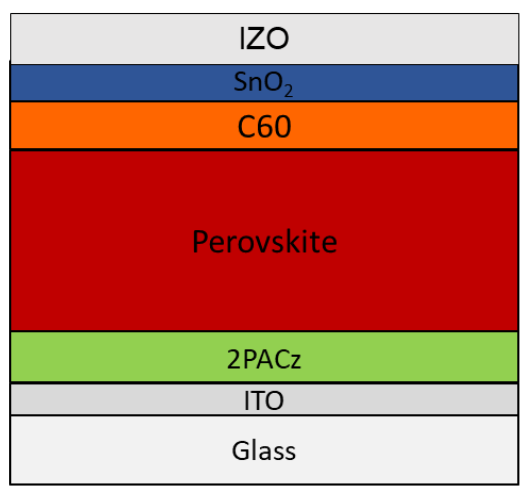
Figure 2: Schematic diagram of the stacked structure of a CsFaPbI3 perovskite device with a bandgap of 1.57 eV.
Stability tests were carried out using the stress testing platform Litos from Fluxim AG. The instrument has four separate compartments that allow independent control of temperature and light intensity. To ensure consistent results, parallel aging tests were performed on four nominally identical samples, each containing four lab-scale solar cell devices (pixels). Samples were tested at different holding temperatures: 25°C, 45°C, 65°C and 85°C.
光偏置为校准为一倍太阳等效强度的白色LED。在测试期间,任何隔间中的空气或湿度都未受到控制。通过连续的最大功率点(MPP)跟踪进行稳定性评估。
除了MPP跟踪外,每60分钟进行一次JV特性测量,以监测光伏(PV)参数的变化。为了进一步分析,在新设备和稳定性测试后进行了阻抗光谱(IS)、瞬态光电流(TPC)和开路电压衰减(OCVD)测量。这些测量使用Fluxim的全功能Paios平台进行。
老化结果
为了初步评估温度对性能衰减的影响,我们比较了所测试的不同钙钛矿太阳能电池的归一化最大功率点(MPP)衰减(图3)。
衰减曲线在不同温度下表现出相似的趋势,即存在一个初始平台期,随后性能迅速下降,直到达到T80(设备达到峰值性能的80%时的时间点)。在低温下,这个平台期持续数十小时,而随着温度升高,平台期变得更短。
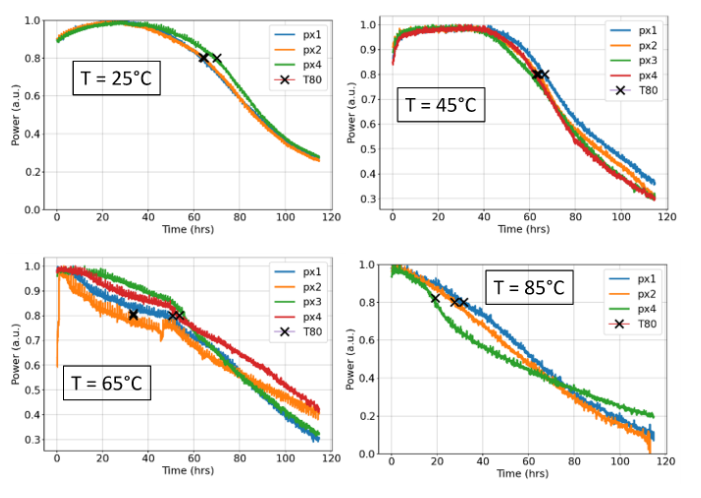
图 3:在 25°C、45°C、65°C 和 85°C 下老化的钙钛矿太阳能电池的归一化 MPP 衰变。 黑色十字表示 T80 的寿命。
将T80寿命(以小时表示)与时间绘制成图(图4),显示出随着温度升高,T80寿命呈下降趋势。在相同基板上并在相同温度下老化的太阳能电池表现出相似的T80值,这对于统计意义来说是一个关键方面。使用Litos Lite,您可以同时对56个设备进行相同的应力测试条件,从而成为强大统计验证的最佳工具。
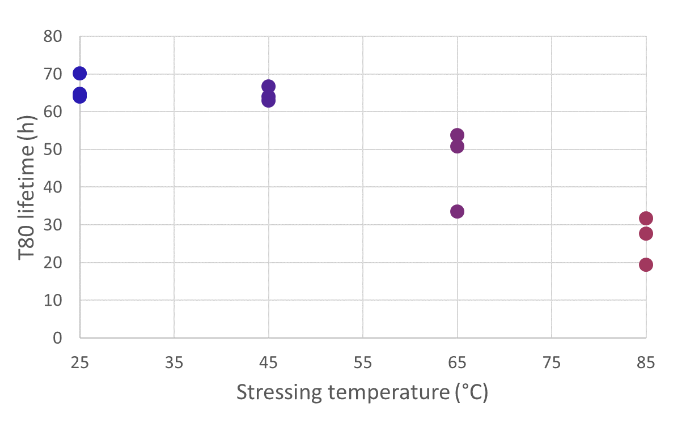
图 4:T80 寿命与应力温度的关系。多个设备保持在指示的温度下,以获得重要的统计分析。
通过在最大功率点(MPP)跟踪期间进行间歇性的JV特性测量,我们记录了太阳能电池工作参数的变化(图5)。在MPP条件下的电流衰减与短路电流(Jsc)之间存在很强的一致性。此外,开路电压(Voc)和最大功率点电压(VMPP)也呈现相似的趋势,在65°C和85°C的温度下随时间减少。在所有温度下,填充因子(Fill Factor)都随着时间的推移而下降。
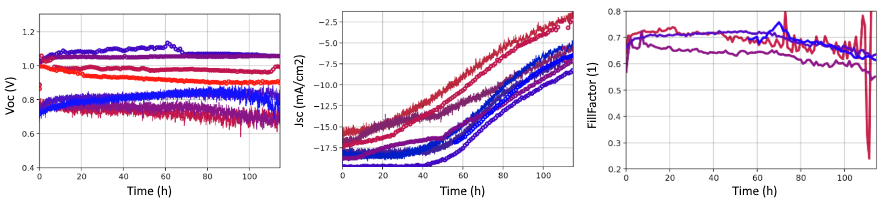
图 5:圆圈线是来自 JV 扫描的 JV 参数,从 MPP 跟踪中获得的连续线。温度随着颜色从蓝色到红色的增加而升高。
填充因子的下降表明复合增加、提取效率降低或两者兼有。[3] 过早得出的结论是,考虑到在所有温度下的衰减相似性以及温度与T80之间的相关性,温度加速了老化过程。
我们需要额外的表征技术来证明这一点。
材料表征
较小的T80表明老化速度更快,但较高的温度可能引入新的老化机制。对器件材料的表征使我们能够理解它们在组成和形态方面是否具有可比的退化。
我们首先考虑了XRD测量(图6),以验证是否存在新的次生相。与新的(未老化的)设备(黑色曲线)相比,所有老化设备中都存在光不活跃的δ相。有趣的是,PbI2与钙钛矿的比例并未显示出与温度的相关性(此处未显示)。这一发现表明,较高的老化温度与钙钛矿分解的增加无关。
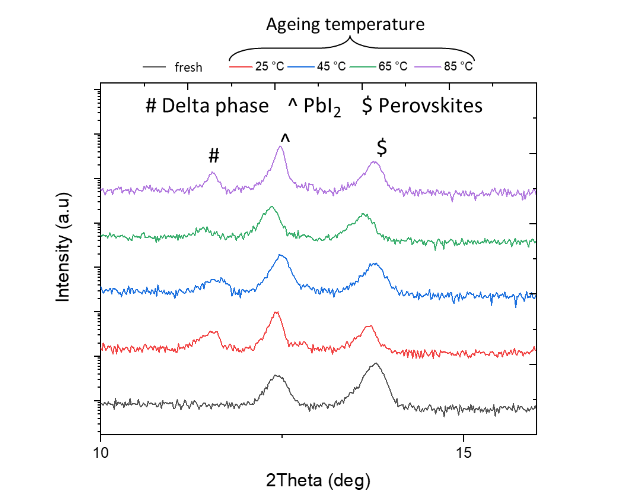
图 6:在温度升高下老化的新鲜和老化的钙钛矿的 XRD 测量。
在25°C、45°C和65°C老化的器件的SEM图像(图7)显示出温度对钙钛矿层形貌的显著影响,特别是空穴的形成。随着温度的升高,钙钛矿层中空穴的大小和数量增加。这种现象表明在较高温度下,快速的衰减与光活跃层和传输层之间的接触减少有关。钙钛矿层形态的这种变化影响了电荷传输和电流分流的形成。在没有适当电气接触的情况下,对于在较高温度老化的器件的电特性表征是不可靠的。因此,我们不能断定温度会加速在25°C得到的相同衰减路径。
为了避免潜在的不确定和错误解释,我们对在25°C老化的太阳能电池进行了详细的电学表征,使用了PAIOS平台。在这个器件中,我们确信与传输层的接触是完好的。
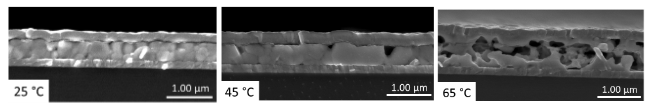
图 7:钙钛矿在 25°C、45°C 和 65°C 下老化的 SEM 截面。
高级电学表征
为了验证在老化过程中电荷提取或复合速率是否发生变化,我们比较了新鲜和老化的钙钛矿器件的瞬态光电流(TPC)和阻抗光谱(IS)分析(图表未显示)。这两项测量都未显示出提取障碍的形成或陷阱增加。
从归一化的阻抗光谱(图8)中,我们观察到老化的器件在低于100Hz频率下具有更高的电容。这意味着老化的器件具有不同的移动离子特征。
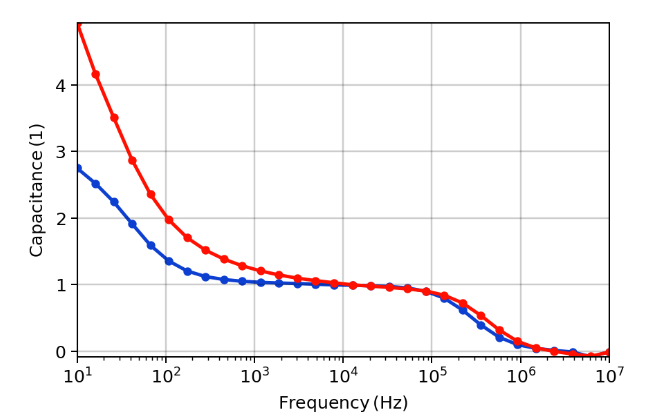
图 8:老化器件(红线)和新器件(蓝色器件)的暗阻抗谱 (IS) 测量。
为了评估老化前后器件中离子密度的变化,我们进行了新鲜和老化器件的开路电压衰减(OCVD)测量。OCVD在连续照明条件下保持器件处于开路电压状态,直到达到稳态条件时关闭照明。随后记录照明关闭后的电压衰减。
图9显示了一个钙钛矿太阳能电池的代表性OCVD曲线。曲线包括两个主要的电压下降。最早的下降约在15微秒左右,由于多余自由载流子的复合而引起。其后是一个伸展的突起区域,从1E^3微秒到1E^4微秒之间,与离子响应有关。在较长时间范围内更快的衰减可能与由于分流电阻或测量设置的寄生效应引起的电荷损失相关。
采用Fischer等人开发的分析方法[5],我们从OCVD和强度依赖的JV曲线中确定了离子密度。
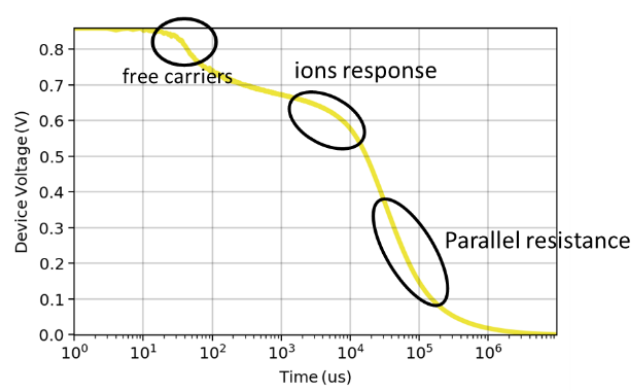
图9:钙钛矿太阳能电池对OCVD测量的代表性响应。
光强度依赖的OCVD测量分析显示,老化的钙钛矿太阳能电池中离子的浓度与新鲜器件相比有显著差异。图10显示,老化的器件的离子密度比新器件高出将近两个数量级。我们将离子密度的增加归因于钙钛矿的分解或来自传输层的离子迁移.[6]
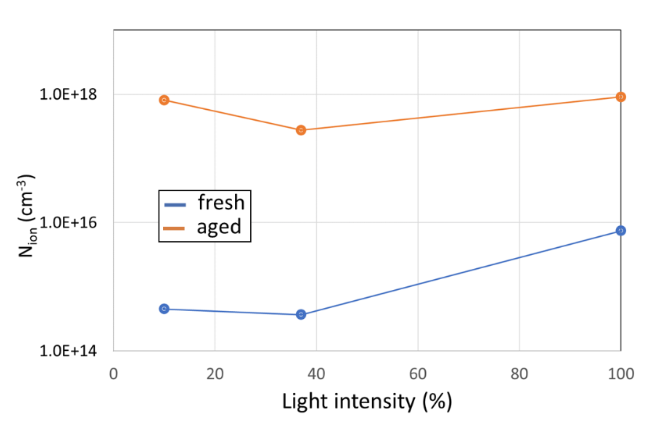
图 10:新和老化的钙钛矿的离子密度,通过 OCVD 测量在增加的光强度下获得。
Thiesbrummel等人与其他表征技术(如偏置辅助电荷提取(BACE)和线性增加电压电荷提取(CELIV))达成了类似的结论[7]。他们使用Fluxim AG的Setfos软件进行漂移扩散模拟,支持了他们的结论。他们发现,只有通过增加移动离子密度,才能够拟合老化钙钛矿器件的实验结果。
结论
本博客文章介绍了我们对CsFaPbI3组成、带隙为1.57电子伏特的钙钛矿太阳能电池进行的温度依赖性降解研究,使用了Litos平台。材料表征(XRD和SEM)显示,温度损害了钙钛矿层的形貌,而非加速老化过程。
通过全能平台Paios,我们将稳定性测试与高级电学表征(TPC、IS和OCVD)结合在我们的钙钛矿太阳能电池上进行。与新鲜太阳能电池相比,我们观察到性能下降,这与老化器件中移动离子密度的增加相关联。
这项研究表明,需要额外的表征技术来深入探讨降解机制。仅依靠MPP跟踪的稳定性测量是不足够的,并且容易导致误解。
我们对研究结果充满信心,因为通过Litos和Paios,我们可以并行测试多个太阳能电池,这是确保分析统计显著性的重要方面。
引用
[1] D. C. Jordan and S. R. Kurtz, “Photovoltaic Degradation Rates—an Analytical Review,” Progress in Photovoltaics, vol. 21, no. 1, pp. 12–29, Jan. 2013, doi: 10.1002/pip.1182.
[2] O. Almora et al., “A precise method for the spectral adjustment of LED and multi-light source solar simulators,” Advanced Energy Materials, p. 2303173, Dec. 2023, doi: 10.1002/pip.3776.
[3] D. Bartesaghi et al., “Competition between recombination and extraction of free charges determines the fill factor of organic solar cells,” Nat Commun, vol. 6, no. 1, p. 7083, Nov. 2015, doi: 10.1038/ncomms8083.
[4] M. Neukom, S. Züfle, S. Jenatsch, and B. Ruhstaller, “Opto-electronic characterization of third-generation solar cells,” Science and Technology of Advanced Materials, vol. 19, no. 1, pp. 291–316, Dec. 2018, doi: 10.1080/14686996.2018.1442091.
[5] M. Fischer, D. Kiermasch, L. Gil-Escrig, H. J. Bolink, V. Dyakonov, and K. Tvingstedt, “Assigning ionic properties in perovskite solar cells; a unifying transient simulation/experimental study,” Sustainable Energy Fuels, vol. 5, no. 14, pp. 3578–3587, 2021, doi: 10.1039/D1SE00369K.
[6] S. Kundu and T. L. Kelly, “In situ studies of the degradation mechanisms of perovskite solar cells,” EcoMat, vol. 2, no. 2, Jun. 2020, doi: 10.1002/eom2.12025.
[7] J. Thiesbrummel et al., “Ion-induced field screening as a dominant factor in perovskite solar cell operational stability,” Nat Energy, Mar. 2024, doi: 10.1038/s41560-024-01487-w.


 3534
3534

 被折叠的 条评论
为什么被折叠?
被折叠的 条评论
为什么被折叠?
 到【灌水乐园】发言


