


Seaborn将matplotlib参数分成两个独立的组。第一组设定了美学风格,第二组则是不同的度量元素,这样就可以很容易地添加到代码当中了。
操作这些参数的接口是两对函数。为了控制样式,使用axesstyle()和setstyle()函数。为了扩展绘图,请使用plotting_context()和set_context()函数。在这两种情况下,第一个函数返回一个参数字典,第二个函数则设置matplotlib默认属性。
标题样式控制:axes_style() and set_style()
特别的可以通过sns.axes_style(style=None, rc=None) 返回一个sns.set_style()可传的参数的字典
通过类似sns.set_style("ticks", {"xtick.major.size": 8, "ytick.major.size": 8})的方式写入更具体的配置样式。
seaborn.set_style
seaborn.set_style(style=None, rc=None)


Parameters:
	style : dict, None, or one of {darkgrid, whitegrid, dark, white, ticks}

	A dictionary of parameters or the name of a preconfigured set.

rc : dict, optional

	Parameter mappings to override the values in the preset seaborn
	style dictionaries. This only updates parameters that are
	considered part of the style definition.
1 set_style( ) set( )
set_style( )是用来设置主题的,Seaborn有五个预设好的主题: darkgrid , whitegrid, dark , white ,和 ticks 默认: darkgrid
import matplotlib.pyplot as plt
import seaborn as sns
sns.set_style("whitegrid")
plt.plot(np.arange(10))
plt.show()
set( )通过设置参数可以用来设置背景,调色板等,更加常用。
seaborn.set(context='notebook', style='darkgrid',
palette='deep', font='sans-serif', font_scale=1,
color_codes=True, rc=None)

参数:context:string or dict
	style:string or dict
	palette:string or sequence
	font:string
	font_scale:float, optional
	color_codes:bool
	rc:dict or None
import seaborn as sns
import matplotlib.pyplot as plt
sns.set(style="white", palette="muted", color_codes=True)     #set( )设置主题,调色板更常用
plt.plot(np.arange(10))
plt.show()
seaborn样式中最重要的元素如果您想要定制seanborn的样式,可以将参数字典传递给axes_style()和set_style()的rc参数。注意,只能通过该方法覆盖样式定义的一部分参数。(然而,更高层次的set()函数接受任何matplotlib参数的字典)。
如果您想要查看包含哪些参数,您可以只调用该函数而不带参数,这将返回当前设置的字典:
sns.axes_style()

{'axes.axisbelow': True,  #轴在图形的下面
'axes.edgecolor': 'white',	#边框的颜色
'axes.facecolor': '#EAEAF2',	#背景颜色
'axes.grid': True,	#是否显示网格
'axes.labelcolor': '.15',
'axes.linewidth': 0.0,
'figure.facecolor': 'white',
'font.family': ['sans-serif'],
'font.sans-serif': ['Arial',
'Liberation Sans',
'Bitstream Vera Sans',
'sans-serif'],
'grid.color': 'white',
'grid.linestyle': '-',
'image.cmap': 'Greys',
'legend.frameon': False,
'legend.numpoints': 1,
'legend.scatterpoints': 1,
'lines.solid_capstyle': 'round',
'text.color': '.15',
'xtick.color': '.15',
'xtick.direction': 'out',
'xtick.major.size': 0.0,
'xtick.minor.size': 0.0,
'ytick.color': '.15',
'ytick.direction': 'out',
'ytick.major.size': 0.0,
'ytick.minor.size': 0.0}
通过plotting_context()和 set_context()调整绘图元素
类似的,还可以使用其中一个名称来调用set_context()来设置参数,您可以通过提供参数值的字典来覆盖参数。
通过更改context还可以独立地扩展字体元素的大小。(这个选项也可以通过顶级set()函数获得)。
seaborn.set_context(context=None, font_scale=1, rc=None)

	This affects things like the size of the labels, lines,
	and other elements of the plot, but not the overall style

参数:context:dict, None, or one of {paper, notebook, talk, poster}
	font_scale:float, optional
	rc:dict, optional
sns.set_context("notebook", font_scale=1.5, rc={"lines.linewidth": 2.5})
sinplot()
四种预设,按相对尺寸的顺序(线条越来越粗),分别是paper,notebook, talk, and poster。notebook的样式是默认的,
类似地(尽管它可能用处不大),也可以使用with嵌套语句进行临时的设置。
样式和上下文都可以用set()函数快速地进行配置。这个函数还设置了默认的颜色选项,在下一节将详细介绍这一功能。
如何去掉图像上面和右面的刻度和轴线?
despine(fig=None, ax=None,
 top=True, right=True, left=False, bottom=False,
  offset=None, trim=False)
sns.despine()
如何设置要画的图离轴线的距离?
sns.despine(offset=10)
如何设置曲线的宽度?
sns.set_context(fontscale=1.5, rc={'lines.linewidth':1.5)
如何设置分度值的字体大小?
sns.set_context(fontscale=1.5)
斑驳陆离的调色板
Seaborn让你更容易选择和使用那些适合你数据和视觉的颜色。
%matplotlib inline
import numpy as np
import seaborn as sns
import matplotlib.pyplot as plt
sns.set(rc={"figure.figsize": (6, 6)})
np.random.seed(sum(map(ord, "palettes")))
简单常用色彩总结:
分类:hls husl Paired Set1~Set3(色调不同)
连续:Blues[蓝s,颜色+s] BuGn[蓝绿] cubehelix(同色系渐变)
离散:BrBG[棕绿] RdBu[红蓝] coolwarm[冷暖](双色对称)
通过color_palette()创建调色板
最重要的直接设置调色板的函数就是color_palette()。这个函数提供了许多(并非所有)在seaborn内生成颜色的方式。并且它可以用于任何函数内部的palette参数设置(在某些情况下当需要多种颜色时也可以传入到color参数)
color_palette()允许任意的seaborn调色板或matplotlib的颜色映射(除了jet,你应该完全不使用它)。它还可以使用任何有效的matplotlib格式指定的颜色列表(RGB元组、十六进制颜色代码或HTML颜色名称)。返回值总是一个RGB元组的列表。
最后,直接调用没有传入参数的color_palette()将返回默认的颜色循环。
对应的函数set_palette()接受相同的参数,并为所有图设置默认的颜色循环。你也可以在with块中使用color_palette()来实现临时的更改调色板配置
通常在不知道数据的具体特征的情况下不可能知道什么类型的调色板或颜色映射对于一组数据来说是最好的。
因此,我们将用三种不同类型的调色板:分类色板、连续色板和离散色板,来区分和使用color_palette()函数。
定性调色板
当您想要区分不具有内在顺序的离散数据块时,定性(分类)调色板是最佳方案。
导入seaborn的同时,会引入默认的颜色循环,由6种颜色构成。并将调用标准matplotlib颜色循环,看起来也更加赏心悦目。
current_palette = sns.color_palette()
sns.palplot(current_palette)

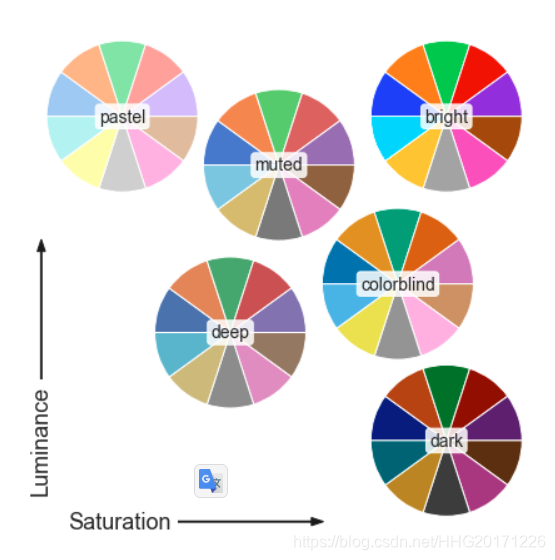
默认主题有六种变体,分别为deep, muted,pastel, bright, dark, and colorblind。
使用循环颜色系统
当您要区分任意数量的类别而不强调任何类别时,最简单的方法是在循环颜色空间中绘制间距相等的颜色(在此颜色空间中,色调会发生变化,同时保持亮度和饱和度不变)。这是大多数seaborn函数在处理当需要区分的数据集超过颜色循环中的6种颜色时时所使用的默认方法。
最为常用的方法是使用hls颜色空间——一种简单的RGB值变体。
sns.palplot(sns.color_palette("hls", 8))

hls_palette()函数允许您控制颜色的亮度(lightness)和饱和度(saturation)。
sns.palplot(sns.hls_palette(8, l=.3, s=.8))

seaborn提供了一个husl系统(后来更名为HSLuv)的接口,这也使选择间隔均匀的色调变得容易,同时使亮度和饱和度都更加均匀。
sns.palplot(sns.color_palette("husl", 8))
类似地,husl_palette()函数也为这个系统提供了一个更灵活的接口。
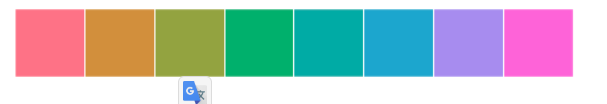
使用Color Brewer调色板
sns.palplot(sns.color_palette("Paired"))

sns.palplot(sns.color_palette("Set2"))

当然,您可能只希望手动指定一组您喜欢的颜色。color_palette()函数会接受一个颜色列表,操作起来也很简单。
flatui = ["#9b59b6", "#3498db", "#95a5a6", "#e74c3c", "#34495e", "#2ecc71"]
sns.palplot(sns.color_palette(flatui))

顺序调色板
sns.palplot(sns.color_palette("Blues"))

与matplotlib类似,您可以通过添加加后缀_r来倒置顺序调色板的顺序。
sns.palplot(sns.color_palette("BuGn_r"))
seaborn同样添加了一个小窍门来帮助您创建“深色”调色板,它没有一个很宽的动态范围。在当您需要按顺序映射直线或点时这可能会很有用,因为颜色较亮的线条会比较难以区分。_d
sns.palplot(sns.color_palette("GnBu_d"))

顺序 “cubehelix” 调色板
发散调色板
seaborn.set_palette
seaborn.set_palette(palette, n_colors=None, desat=None, color_codes=False)

通过searborn调色板设置matplotlib色彩循环

参数:palette:seaborn color paltte | matplotlib colormap | hls | husl
		调色板参数。 应该可以被 color_palette() 函数处理。

	n_colors:int
	色彩循环中的颜色数量。默认数量与palette模式有关,
	查看color_palette()文档了解更多内容。

	desat:float
	每种颜色去饱和的比例。
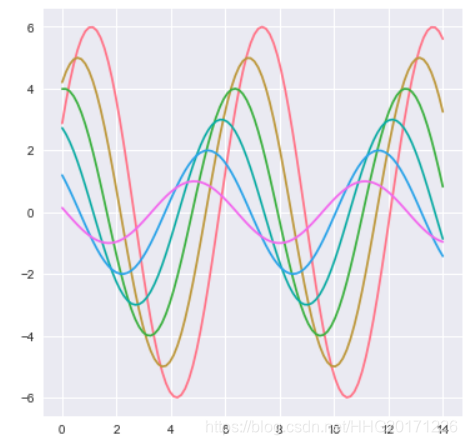
def sinplot(flip=1):
    x = np.linspace(0, 14, 100)
    for i in range(1, 7):
        plt.plot(x, np.sin(x + i * .5) * (7 - i) * flip)
sns.set_palette("husl")
sinplot()
seaborn.color_palette
seaborn.color_palette(palette=None, n_colors=None, desat=None)
返回一个颜色列表来定义一个调色板。
有 deep, muted, bright, pastel, dark, colorblind 六种颜色模式
调用此函数并设置 palette=None 会返回当前 matplotlib 色彩循环。
m=sns.color_palette(palette='bright',n_colors=4 )
matplotlib 调色板的顺序可以通过在调色板名称后添加 “_r” 来倒置,同样,添加 “_d” 可以将调色板设置为深色模式。(这些选项为互斥属性,返回的颜色列表同样可以被取反)
例子
不带参数的调用将返回当前默认颜色循环中的所有颜色:
>>> import seaborn as sns; sns.set()
>>> sns.palplot(sns.color_palette())
显示另一个 “seaborn 调色板”,具有与默认 matplotlib 颜色循环相同的基本色调顺序,但颜色更吸引人。默认情况下,使用调色板名称进行调用将返回6种颜色:
>>> sns.palplot(sns.color_palette("muted"))
使用一个内置 matplotlib clolormap 的离散值:
>>> sns.palplot(sns.color_palette("RdBu", n_colors=7))
创建自定义 cubehelix 调色板:
>>> sns.palplot(sns.color_palette("ch:2.5,-.2,dark=.3"))
使用一个明确的 matplotlib 调色板并降低一些饱和度:
>>> sns.palplot(sns.color_palette("Set1", n_colors=8, desat=.5))
创建 “dark”(深色)matplotlib 顺序调色板变体。(当对应于有序变量的多条线或点进行着色时,如果您不希望最轻的线不可见,则可以使用此选项):
>>> sns.palplot(sns.color_palette("Blues_d"))
作为上下文管理器使用:
>>> import numpy as np, matplotlib.pyplot as plt
>>> with sns.color_palette("husl", 8):
...    _ = plt.plot(np.c_[np.zeros(8), np.arange(8)].T)
seaborn.husl_palette
seaborn.husl_palette(n_colors=6, h=0.01, s=0.9, l=0.65)

在 HUSL 色调空间中获得一组均匀间隔的颜色。

h, s, 和 l 值应该在 0 和 1 之间。

参数:n_colors:int
	调色板中的颜色数
	h:float
	第一个色调

	s:float
	饱和度

	l:float
	亮度

返回值:palette:seaborn 调色板
在 HSL 系统中使用等间距圆形色调创建一个调色板。
例子
使用默认参数创建一个有 10 种颜色的调色板:
>>> import seaborn as sns; sns.set()
>>> sns.palplot(sns.husl_palette(10))
创建一个以不同色调值开头的 10 种颜色的调色板:
>>> sns.palplot(sns.husl_palette(10, h=.5))
seaborn.hls_palette
seaborn.hls_palette(n_colors=6, h=0.01, l=0.6, s=0.65)
在 HLS 色调空间中获取一组均匀间隔的颜色。
h, s, 和 l 值应该在 0 和 1 之间。
参数:n_colors:int
	调色板中的颜色数

	h:float
	第一个色调

	l:float
	亮度

	s:float
	饱和度

返回值:palette:seaborn 调色板
在 HUSL 系统中使用等间距圆形色调创建一个调色板。
例子
使用默认参数创建一个有 10 种颜色的调色板:
>>> import seaborn as sns; sns.set()
>>> sns.palplot(sns.hls_palette(10))
创建一个以不同色调值开头的 10 种颜色的调色板:
>>> sns.palplot(sns.hls_palette(10, h=.5))
创建一个比默认颜色更暗的 10 种颜色的调色板:
>>> sns.palplot(sns.hls_palette(10, l=.4))
seaborn.cubehelix_palette
seaborn.cubehelix_palette(n_colors=6, start=0, rot=0.4,
							gamma=1.0, hue=0.8, light=0.85, dark=0.15,
							reverse=False, as_cmap=False)


参数:n_colors:int
		调色板中的颜色数。

	start:float, 0 <= start <= 3
			第一个色调。

	rot:float   围绕调色板范围内的色相控制盘旋转。

	gamma:float 0 <= gamma		Gamma 系数用以强调较深 (Gamma < 1) 或较浅 (Gamma > 1) 的颜色。
	hue:float, 0 <= hue <= 1	颜色的饱和度。
	dark:float 0 <= dark <= 1	调色板中最暗颜色的强度。
	light:float 0 <= light <= 1	调色板中最浅颜色的强度。
	reverse:bool	如果为 True 值,则调色板将从暗到亮。
	as_cmap:bool	如果为 True 值,则返回 matplotlib colormap 而不是颜色列表。

返回值:palette or cmap:seaborn 调色板或者 matplotlib colormap
用 cubehelix 系统制作顺序调色板。
生成亮度呈线性减小(或增大)的 colormap。
除了使用这个函数,还可以在 seaborn 中使用字符串速记生成 cubehelix 调色板。
例子
生成默认调色板:
>>> import seaborn as sns; sns.set()
>>> sns.palplot(sns.cubehelix_palette())
从相同的起始位置向后旋转:
>>> sns.palplot(sns.cubehelix_palette(rot=-.4))
使用不同的起点和较短的旋转:
>>> sns.palplot(sns.cubehelix_palette(start=2.8, rot=.1))
反转亮度渐变方向:
>>> sns.palplot(sns.cubehelix_palette(reverse=True))
生成一个 colormap 对象:
>>> from numpy import arange
>>> x = arange(25).reshape(5, 5)
>>> cmap = sns.cubehelix_palette(as_cmap=True)
>>> ax = sns.heatmap(x, cmap=cmap)
使用 color_palette() 函数接口:
>>> sns.palplot(sns.color_palette("ch:2,r=.2,l=.6"))
seaborn.dark_palette
seaborn.dark_palette(color, n_colors=6,
reverse=False, as_cmap=False, input='rgb')

参数:color:高值的基色	十六进制、RGB 元组或者颜色名字。
	n_colors:int, 可选	调色板中的颜色数。
	reverse:bool, 可选	如果为 True 值,则反转混合的方向。
	as_cmap:bool, optional		如果为 True 值,则返回 matplotlib colormap 而不是列表。
	input:{‘rgb’, ‘hls’, ‘husl’, xkcd’}	用于解释输入颜色的颜色空间。前三个选项适用于元组输入,后者适用于字符串输入。

返回值:palette or cmap:seaborn color palette or matplotlib colormap
制作一个混合深色和 color 模式的顺序调色板。
这种调色板适用于数据集的范围从相对低值(不感兴趣)到相对高值(很感兴趣)时。
可以通过多种方式指定 color 参数,包括用于在 matplotlib 中定义颜色的所有选项,以及由 seborn 处理的其他几个颜色空间。也可以使用 XKCD color survey 中的颜色名字数据库。
例子
从一个 HTML 颜色生成一个调色板:
>>> import seaborn as sns; sns.set()
>>> sns.palplot(sns.dark_palette("purple"))
生成亮度降低的调色板:
>>> sns.palplot(sns.dark_palette("seagreen", reverse=True))
从 HUSL 空间种子生成选项板:
>>> sns.palplot(sns.dark_palette((260, 75, 60), input="husl"))
生成一个 colormap 对象:
>>> from numpy import arange
>>> x = arange(25).reshape(5, 5)
>>> cmap = sns.dark_palette("#2ecc71", as_cmap=True)
>>> ax = sns.heatmap(x, cmap=cmap)
cmap = sns.dark_palette("purple",n_colors=6)

sns.set_palette(cmap)
seaborn.light_palette
seaborn.light_palette(color, n_colors=6,
reverse=False, as_cmap=False, input='rgb')

参数:color:高值的基色	十六进制、RGB 元组或者颜色名字。
	n_colors:int, 可选	调色板中的颜色数。
	reverse:bool, 可选	如果为 True 值,则反转混合的方向。
	as_cmap:bool, optional		如果为 True 值,则返回 matplotlib colormap 而不是列表。
	input:{‘rgb’, ‘hls’, ‘husl’, xkcd’}	用于解释输入颜色的颜色空间。前三个选项适用于元组输入,后者适用于字符串输入。

返回值:palette or cmap:seaborn color palette or matplotlib colormap
制作一个混合浅色和 color 模式的顺序调色板。
这种调色板适用于数据集的范围从相对低值(不感兴趣)到相对高值(很感兴趣)时。
可以通过多种方式指定 color 参数,包括用于在 matplotlib 中定义颜色的所有选项,以及由 seborn 处理的其他几个颜色空间。也可以使用 XKCD color survey 中的颜色名字数据库。
例子
从一个 HTML 颜色生成一个调色板:
>>> import seaborn as sns; sns.set()
>>> sns.palplot(sns.light_palette("purple"))
生成亮度降低的调色板:
>>> sns.palplot(sns.light_palette("seagreen", reverse=True))
从 HUSL 空间种子生成选项板:
>>> sns.palplot(sns.light_palette((260, 75, 60), input="husl"))
生成一个 colormap 对象:
>>> from numpy import arange
>>> x = arange(25).reshape(5, 5)
>>> cmap = sns.light_palette("#2ecc71", as_cmap=True)
>>> ax = sns.heatmap(x, cmap=cmap)
seaborn.diverging_palette
seaborn.diverging_palette(h_neg, h_pos, s=75, l=50, sep=10, n=6,
center='light', as_cmap=False)


参数:h_neg, h_pos:float in [0, 359]		图的正负范围的锚定色调
	s:[0, 100] 范围内的浮点数,可选		图的两个范围的锚定饱和度
	l:[0, 100] 范围内的浮点数,可选		图的两个范围的锚定亮度
	n:int,可选		调色板中的颜色数(如果为not,返回一个colormap)
	center:{“light”, “dark”}, 可选		调色板中心为亮或暗
	as_cmap:bool, 可选		如果为 true,返回一个 matplotlib colormap 而不是一个颜色列表。

返回值:palette or cmap:seaborn color palette or matplotlib colormap
	类似列表的颜色对象的 RGB 元组,或者可以将连续值映射到颜色的 colormap 对象,具体取决于 as_cmap 参数的值。
在两个 HUSL 颜色直接建立一个发散调色板。
另外
创建具有暗值的连续调色板。创建具有亮值的连续调色板。
例子
生成一个蓝-白-红调色板:
>>> import seaborn as sns; sns.set()
>>> sns.palplot(sns.diverging_palette(240, 10, n=9))

生成一个更亮的绿-白-紫调色板:
>>> sns.palplot(sns.diverging_palette(150, 275, s=80, l=55, n=9))

生成一个蓝-黑-红调色板:
>>> sns.palplot(sns.diverging_palette(250, 15, s=75, l=40,
...                                   n=9, center="dark"))

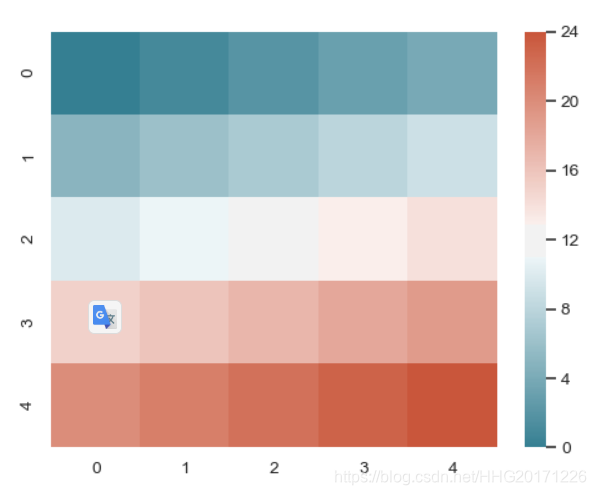
生成一个 colormap 对象:
>>> from numpy import arange
>>> x = arange(25).reshape(5, 5)
>>> cmap = sns.diverging_palette(220, 20, sep=20, as_cmap=True)
>>> ax = sns.heatmap(x, cmap=cmap)


 448
448

 被折叠的 条评论
为什么被折叠?
被折叠的 条评论
为什么被折叠?
 到【灌水乐园】发言


