


连续血糖监测(CGM)
CGM(Continuous Glucose Moitoring) —— 连续血糖监测,是指通过葡萄糖感应器监测皮下组织间液的葡萄糖浓度而间接反映血糖水平的监测技术。针对糖尿病的患者,应用连续血糖监测仪器(下面称为瞬感)来检测血糖,可以全面了解患者的血糖波动趋势。
而医院应用的瞬感仪器可以产生每位患者在装上瞬感后的点数据,而也有相应的软件可以分析该点数据。假设我们想要做一些研究或者调查,比如,我们想知道所有患者装上瞬感的前三天(72h)的数据,软件没有这种参数设置,我们可以应用R对点数据进行分析。
下面将会对10份点数据进行处理,而最终分析得参数主要为[1]:
![文献参考:[1]. Battelino, T., et al., Clinical Targets for Continuous Glucose Monitoring Data Interpretation: Recommendations From the International Consensus on Time in Range. Diabetes Care, 2019. 42(8): p. 1593-1603.](https://i-blog.csdnimg.cn/blog_migrate/3c75dbb6b354fb9e0427a489fbd9c883.png)
数据分析R
模拟点数据
(此点数据设计名字,ID均为模拟。)
 #首先设置环境参数,文字为中文环境;
options(stringsAsFactors =F,fileEncoding = 'utf-8')
#载入数据处理R包dplyr和tidyr
library(dplyr)
library(tidyr)

#我们把数据都放在一个文件夹下面,方面处理,而后用for循环把数据分析出来
path = 'D:/project/点数据'  #文件夹分级用“/”隔开,而不是“\”
folders=list.files(path)   #用list.files()命令把点数据文件夹下的文件名提出来
我们先看看文件一般情况:
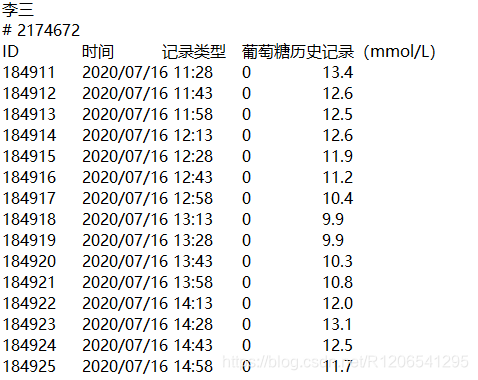
1.文件为TXT格式;
2.第一行为姓名;
3.第二行为ID,格式为“# ******”
4.第三行开始往后都为表格的正式内容,有四列,“ID”:时间的编码ID,“时间”:每个数据所对应的采集时间;“记录类型”:无特殊意义;“葡萄糖历史记录(mmol/L)”;
5.从“时间”列中看到每隔15min会有一个点数据
#在我们开始写循环之前,可以先写第一份数据的代码,以便检查
fd = folders[1]  #fd = 第1个文件名
files_path=paste(path,"/",fd,sep="") #读取路径
a = read.delim(file = files_path, header=FALSE ) #读取第1份数据
name = a[1,1] #姓名
ID = substr(a[2,1],3,nchar(a[2,1])) #substr(x, start, stop) #从“# ******”中提取患者的ID
headnames = as.character(a[3,]) #把表格第三行提取出来当名字
a = a[c(4:nrow(a)),]  #只保留数据
colnames(a) = headnames  #命名表格
rownames(a) = NULL

#接下来要分析前3d的数据,每15min一个数据,也就是前288个数据,且表格本身≥288位数据
nr = nrow(a)
if (nr >= 288){
  a$`葡萄糖历史记录(mmol/L)` = as.numeric(a$`葡萄糖历史记录(mmol/L)`) #把这一列设为数值列
  #用case_when()给a其分级以方便算TIR等数据
  a = a[1:288,] %>%
    mutate(glucose_level = case_when(
      `葡萄糖历史记录(mmol/L)` < 3.0 ~ 1,
      `葡萄糖历史记录(mmol/L)` < 3.9 ~ 2,
      `葡萄糖历史记录(mmol/L)` <= 10.0 ~ 3,
      `葡萄糖历史记录(mmol/L)` > 13.9 ~ 5,
      `葡萄糖历史记录(mmol/L)` > 10.0 ~ 4
    ))
  analysis_a = a %>%
    summarise(TAR = round(sum(glucose_level %in% c(4,5))/288, 4),
              TIR = round(sum(glucose_level == 3)/288, 4),
              TBR = round(sum(glucose_level %in% c(1,2))/288, 4),
              TAR_level1 = round(sum(glucose_level == 4)/288, 4),
              TAR_level2 = round(sum(glucose_level == 5)/288, 4),
              TBR_level1 = round(sum(glucose_level == 2)/288, 4),
              TBR_level2 = round(sum(glucose_level == 1)/288, 4),
              mean = round(mean(`葡萄糖历史记录(mmol/L)`), 4),
              SD = round(sd(`葡萄糖历史记录(mmol/L)`), 4),
              CV = round(sd(`葡萄糖历史记录(mmol/L)`)/mean(`葡萄糖历史记录(mmol/L)`), 4)) %>%
  #用roun(),保留四位数,也可不处理
    mutate(name = name, ID= ID) #给其加上患者的姓名及ID
}
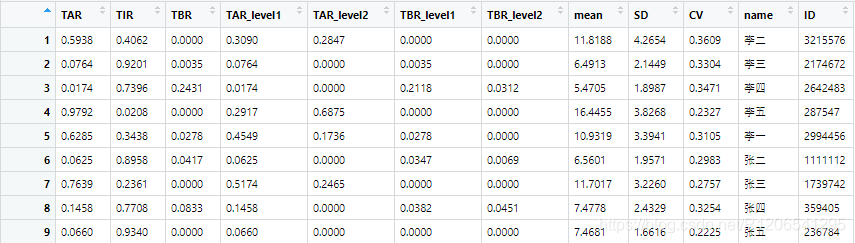
至此,我们可以看到第一份数据的分析结果:

那么接下来,我们只需要用for循环把所有文件都分析出来就好了
analysis_data = data.frame()  #先创建一个空表格装分析数据
for (i in c(1:length(folders))){
	fd = folders[i]
	files_path=paste(path,"/",fd,sep="")
	a = read.delim(file = files_path, fileEncoding = 'utf-8', header=F )
	name = a[1,1]
 	ID = substr(a[2,1],3,nchar(a[2,1]))
	headnames = as.character(a[3,])
	a = a[c(4:nrow(a)),]
	colnames(a) = headnames
	rownames(a) = NULL
	nr = nrow(a)
	if (nr >= 288){
		a$`葡萄糖历史记录(mmol/L)` = as.numeric(a$`葡萄糖历史记录(mmol/L)`)
  		a = a[1:288,] %>%
		mutate(glucose_level = case_when(
      `葡萄糖历史记录(mmol/L)` < 3.0 ~ 1,
      `葡萄糖历史记录(mmol/L)` < 3.9 ~ 2,
      `葡萄糖历史记录(mmol/L)` <= 10.0 ~ 3,
      `葡萄糖历史记录(mmol/L)` > 13.9 ~ 5,
      `葡萄糖历史记录(mmol/L)` > 10.0 ~ 4
    ))
	analysis_a = a %>%
	summarise(TAR = round(sum(glucose_level %in% c(4,5))/288, 4),
              TIR = round(sum(glucose_level == 3)/288, 4),
              TBR = round(sum(glucose_level %in% c(1,2))/288, 4),
              TAR_level1 = round(sum(glucose_level == 4)/288, 4),
              TAR_level2 = round(sum(glucose_level == 5)/288, 4),
              TBR_level1 = round(sum(glucose_level == 2)/288, 4),
              TBR_level2 = round(sum(glucose_level == 1)/288, 4),
              mean = round(mean(`葡萄糖历史记录(mmol/L)`), 4),
              SD = round(sd(`葡萄糖历史记录(mmol/L)`), 4),
              CV = round(sd(`葡萄糖历史记录(mmol/L)`)/mean(`葡萄糖历史记录(mmol/L)`), 4)) %>%
    mutate(name = name, ID= ID)
    analysis_data = rbind(analysis_data, analysis_a)
}
}
然后我们就得出分析结果啦:
以上只是一个比较理想情况下的简单分析,在实际数据分析中,我们需要在跑数据之前先对数据总体进行一个评估,明确我们的分析目标,从而把代码进一步完善:
1.以上是取了前3d的数据,那么我们可以创建一个表格,分别列入每位患者的点数据有多少,第一次点数据采样时间(可以看看有哪些患者数据量不达3d等);
2.瞬感装置是在皮下的,那么有可能因为挤压而导致某一时刻的数据缺失,但是点数据源文件并没有显示NA,也就是说数据并不连续,我们需要排除这一类数据;
3.除了以上TIR等参数,我们可以补充CGM衍生的其他血糖评估指标,如MAGE等;
4.或者我们只想要分析夜间血糖情况,需要根据时间来继续分析等等
…
(以上代码供参考,欢迎指正。)


 1473
1473

 被折叠的 条评论
为什么被折叠?
被折叠的 条评论
为什么被折叠?
 到【灌水乐园】发言


