


论文代码:GitHub - parisots/population-gcn: Graph CNNs for population graphs
英文是纯手打的!论文原文的summarizing and paraphrasing。可能会出现难以避免的拼写错误和语法错误,若有发现欢迎评论指正!文章偏向于笔记,谨慎食用
目录
2.2.1. Graph convolutional neural networks
2.2.2. Graph-based models for disease prediction
2.3.1. Databases and preprocessing
2.3.2. Population graph construction
2.3.3. Feature selection strategies
2.3.4. Graph labelling using graph convolutional neural networks
2.4.2. ABIDE feature selection strategy
2.4.3. Influence of polynomial order K
2.4.4. Graph construction strategy
2.4.5. Influence of the phenotypic measures
2.4.6. Comparison to other methods
1. 省流版
1.1. 心得
(1)2018年的脑影像了,考个古,主要是收藏夹躺太久了还是看了算了
(2)为什么要在intro里面介绍图像分割?
(3)图太多了,有时候不如表格直观,还是一些表格一些图片搭配比较好
1.2. 论文总结图
2. 论文逐段精读
2.1. Abstract
①Node can be represented as participant with features
②Existing problems: models care more about the similarity between participants rather than feature of themselves
③Innovation: adopting imaging and non-imaging data
④Classification accuracy: 70.4% in ABIDE and 80.0%in ADNI
2.2. Introduction
①Introducing relevant methods
2.2.1. Graph convolutional neural networks
①Introducing models based on CNN and spectral GNN
2.2.2. Graph-based models for disease prediction
①Introducing models based on spatial GNN
②Contributions: expanded work of previous paper in conference; combining two type of data; feature selection strategy
2.3. Methods
①Overall framework:
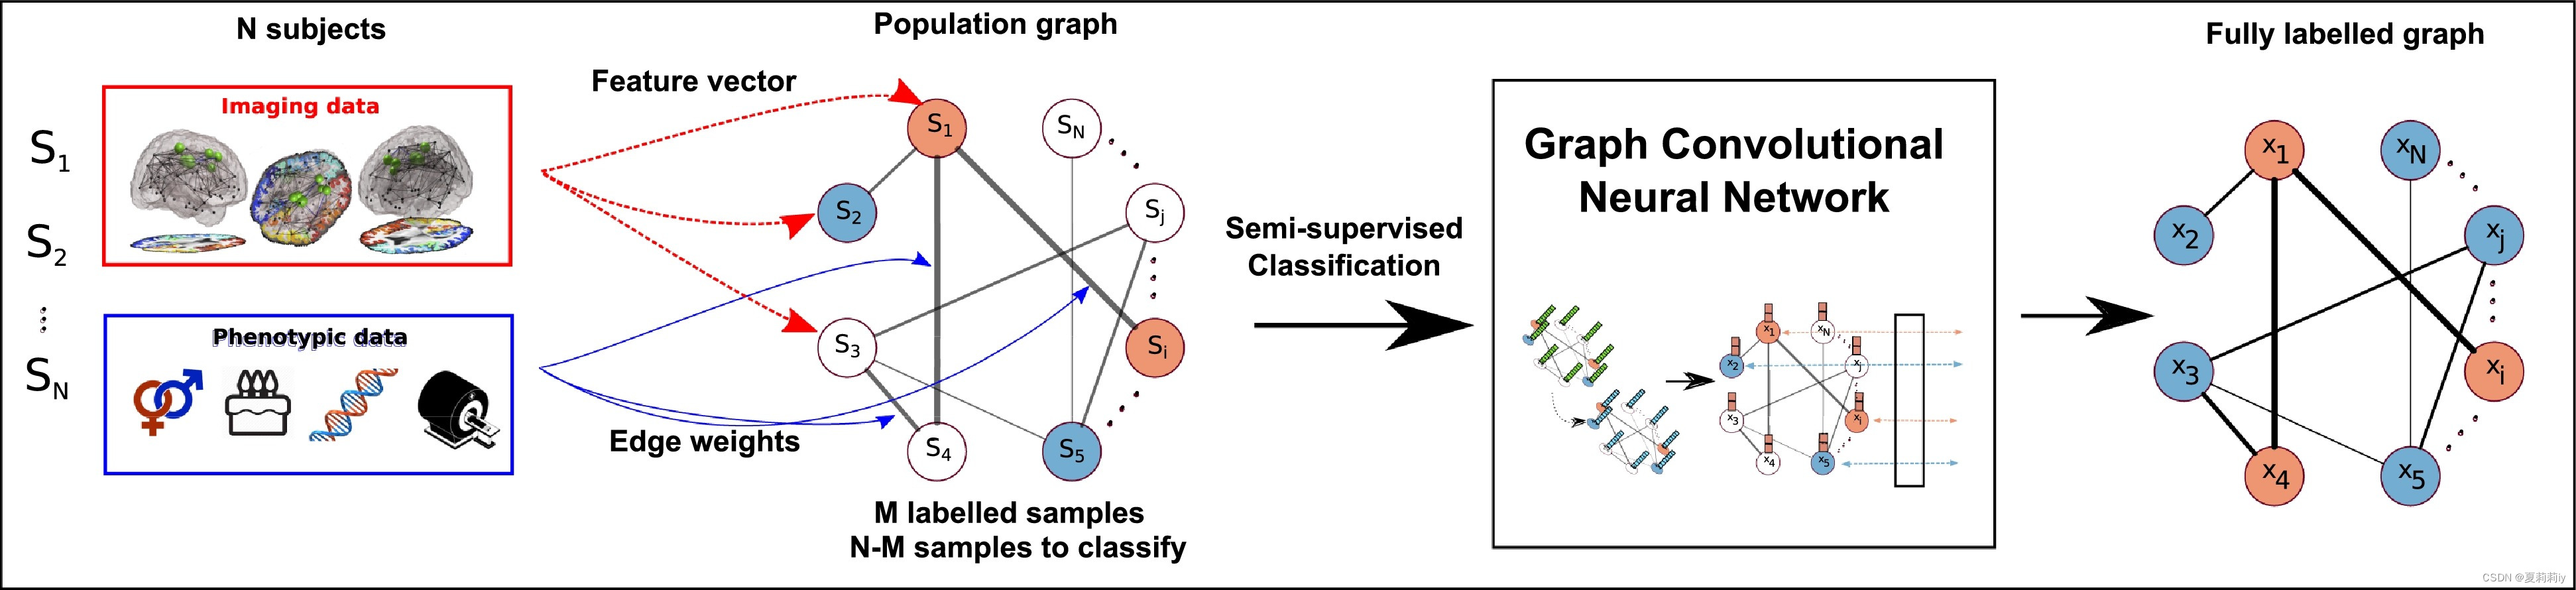
②Number of subject: with total
image data
③Graph:
④num_node_feature:
⑤Task: node classification
⑥Label: 0 denotes HC and 1 denotes diseased
2.3.1. Databases and preprocessing
(1)ABIDE
①Samples: 871 with 403 ASD and 468 HC
②Site: 20(imaging site? 不是站点?是什么东西)
③Atlas: the Harvard Oxford (HO) with 111 ROI
④Functional connectivity (FC): Fisher transformed Pearson’s correlation coefficient act on time signal series
⑤Task: classifying ASD and HC
(2)ADNI
①⭐“数据集中的AD诊断仅来自临床评估,缺少组织病理学确认。因此,AD诊断应称为“疑似AD”。”
②Samples: 1674 subjects with 5074 images
③Task: classifying stable MCI (sMCI) and progressive MCI (pMCI)
④num_node_feature:
2.3.2. Population graph construction
(1)Feature vector
①For ADNI: 138
②For ABIDE: up triangular elements of the square adjacency matrices (FC?)
(2)Graph edges
①Adjacency matrix of the population graph:
where denotes the similarity between subjects,
denotes the the measure of distance between phenotypic measures, and
denotes the non-imaging phenotypic measures(作者意思就是同时考虑节点相似度和表型数据距离来得到边缘权重)
②Applying different for different phenotypic measures. For instance, adopting Kronecker delta function
for sex measures:
when they get the same sex, the weight might be 1 (higher than 0 and more similar). If researchers consider the age, there are threshold to measure the similarity.(说白了就是性别的话
存在就可以定义为1,不存在的话就是性别相等计数1,不相等计数0。年龄的话因为很难想等所以来了个阈值
但这玩意儿也不一定好设计。总之这边是一个表型特征要么0要么1,然后1越多就是越相似)
③Phenotypic measures on ABIDE: site, sex and age.
④Similarity function for ABIDE:
where denotes the correlation distance,
denotes the width of the kernel
⑤Phenotypic measures on ADNI: sex and age.
⑥Similarity measurements for ADNI: brain volumes, which strongly be affected by age and sex, and genetic information APOE ϵ4, which is the major risk factor for the development of AD
⑦Similarity function for ADNI:
⑧Even though handedness constitutes influence the results, the information lacks.
allele n.等位基因
2.3.3. Feature selection strategies
(1)Node feature in ABIDE possesses high dimentional property
①Solution 1: introducing ridge classifier and Recursive Feature Elimination (RFE)
②Solution 2: PCA(作者说因为特征数(6105)远大于样本数(871)所以不太适合)
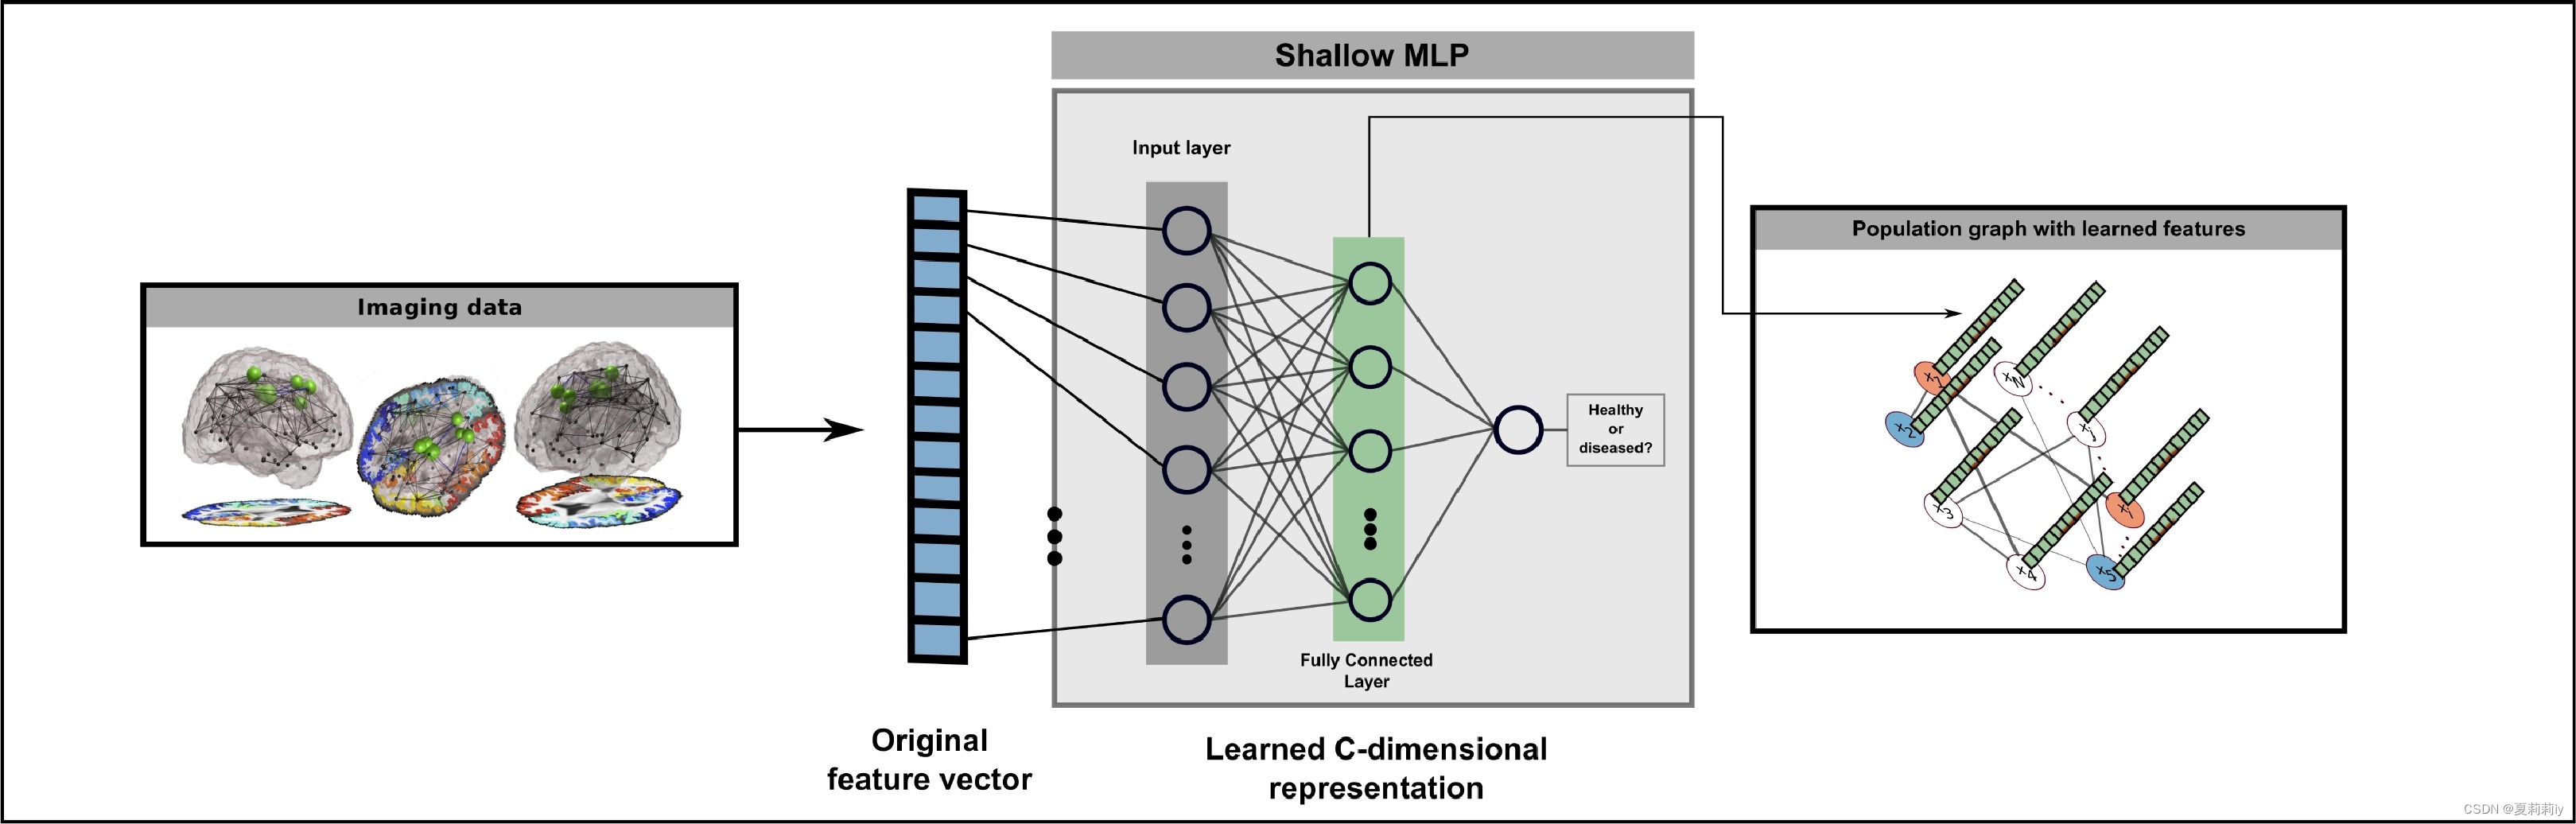
③Solution 3: supervised MLP
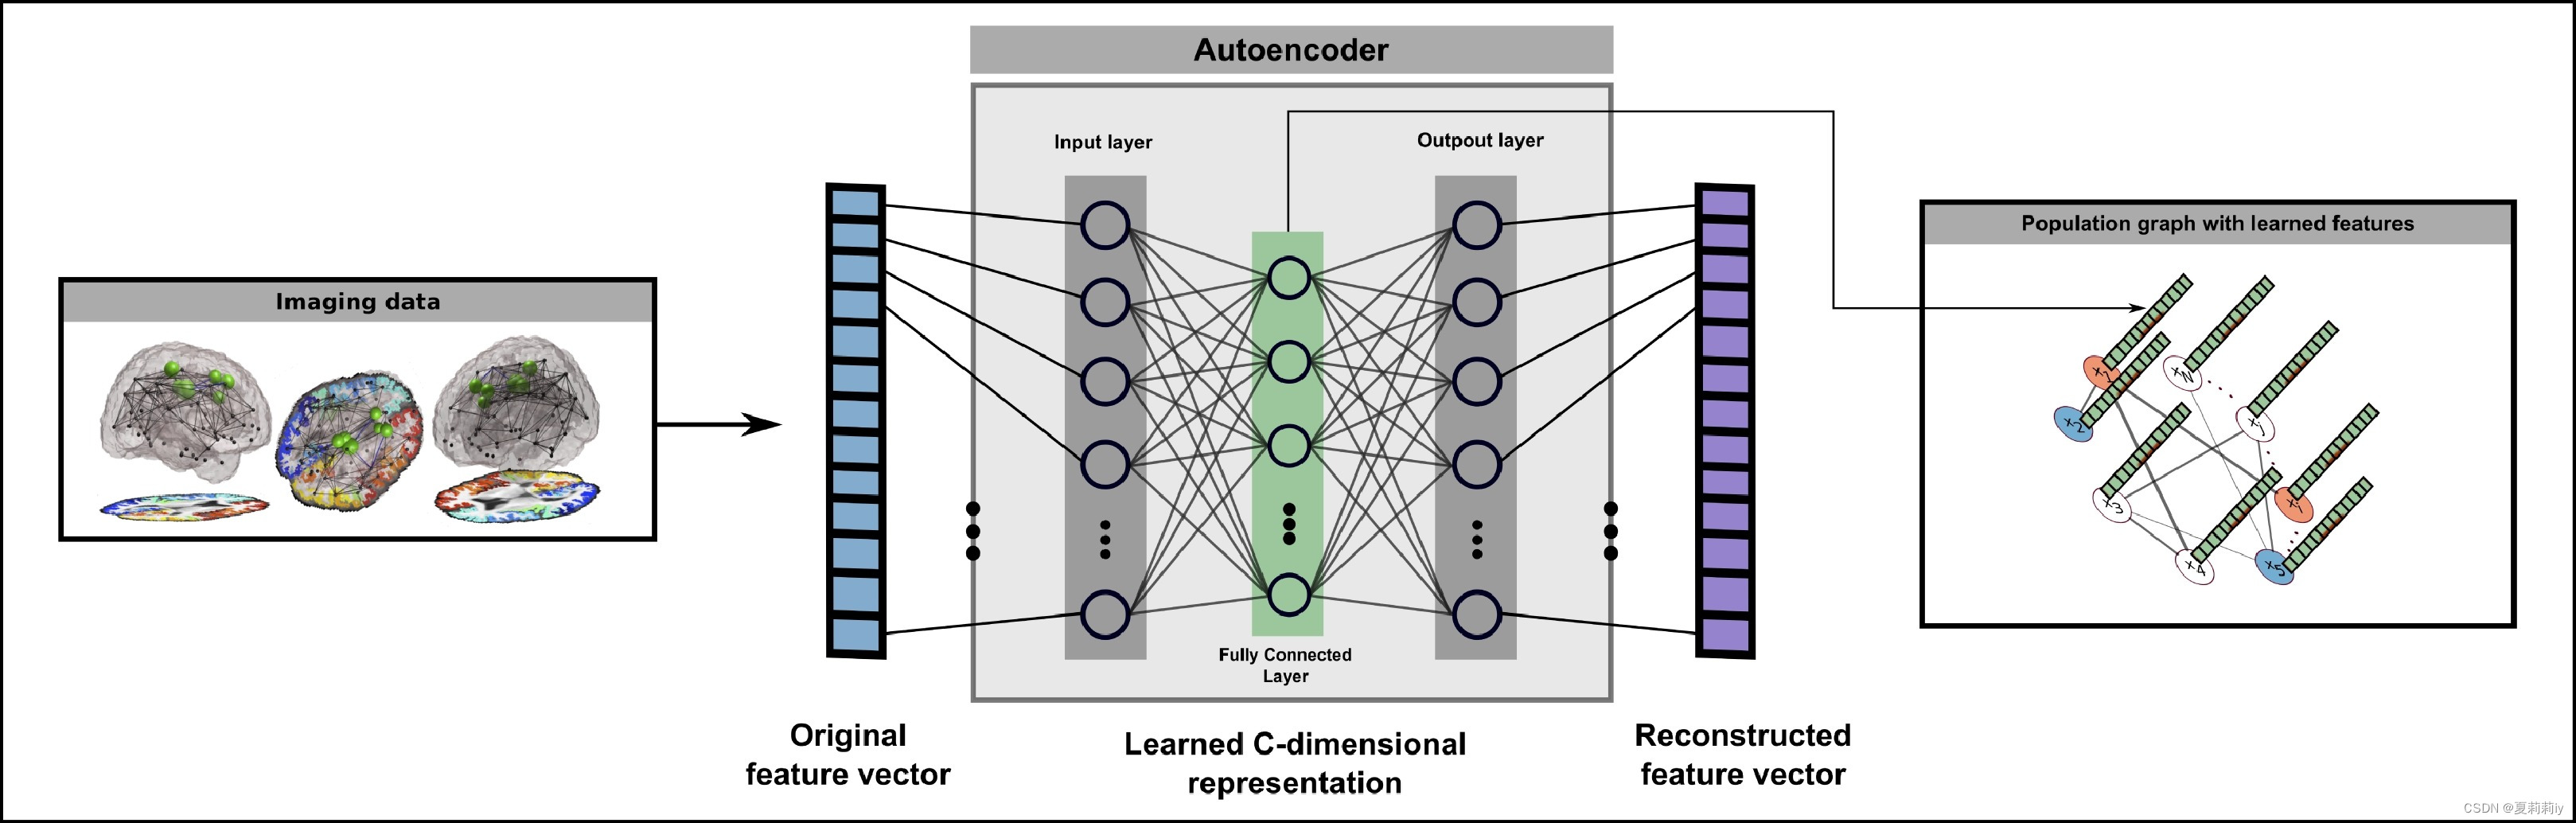
④Solution 4: unsupervised antoencoders with MSE for loss function
2.3.4. Graph labelling using graph convolutional neural networks
(1)Spectral graph convolutions
①Introducing spectral graph convolutions(不过现在GCN一阶近似出来了感觉不太需要传统的谱图卷积了?可能我比较深度学习吧)
(2)GCN model
①Model structure:
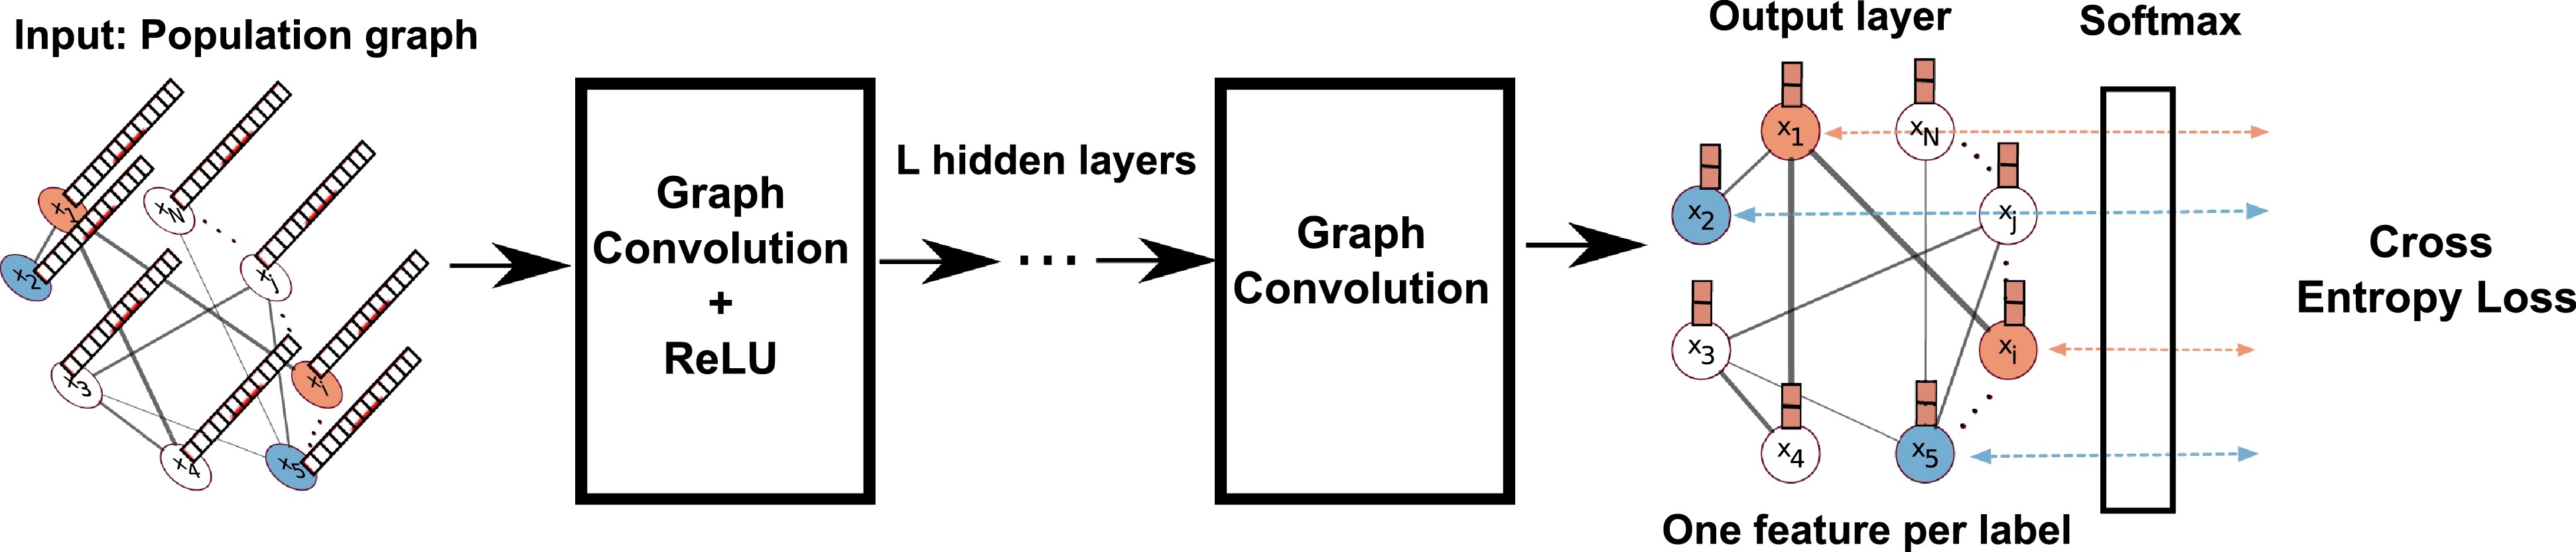
②Activation function: ReLU
③Classifier: softmax
④Loss function: cross entropy
2.4. Results
2.4.1. Experimental set-up
①Cross validation: 10 fold
②Parameters of GCN: same as Parisot et al. (2017), optimized by grid search
③Default polynomial order
(1)ABIDE
①Hidden layer:
②Dropout rate: 0.3
③l2 regularisation:
④Learning rate: 0.005
⑤Epochs: 150
(2)ADNI
①Hidden layer:
②Dropout rate: 0.02
③l2 regularisation:
④Learning rate: 0.01
⑤Epochs: 200
⑥Hyperparameters in similarity function: and
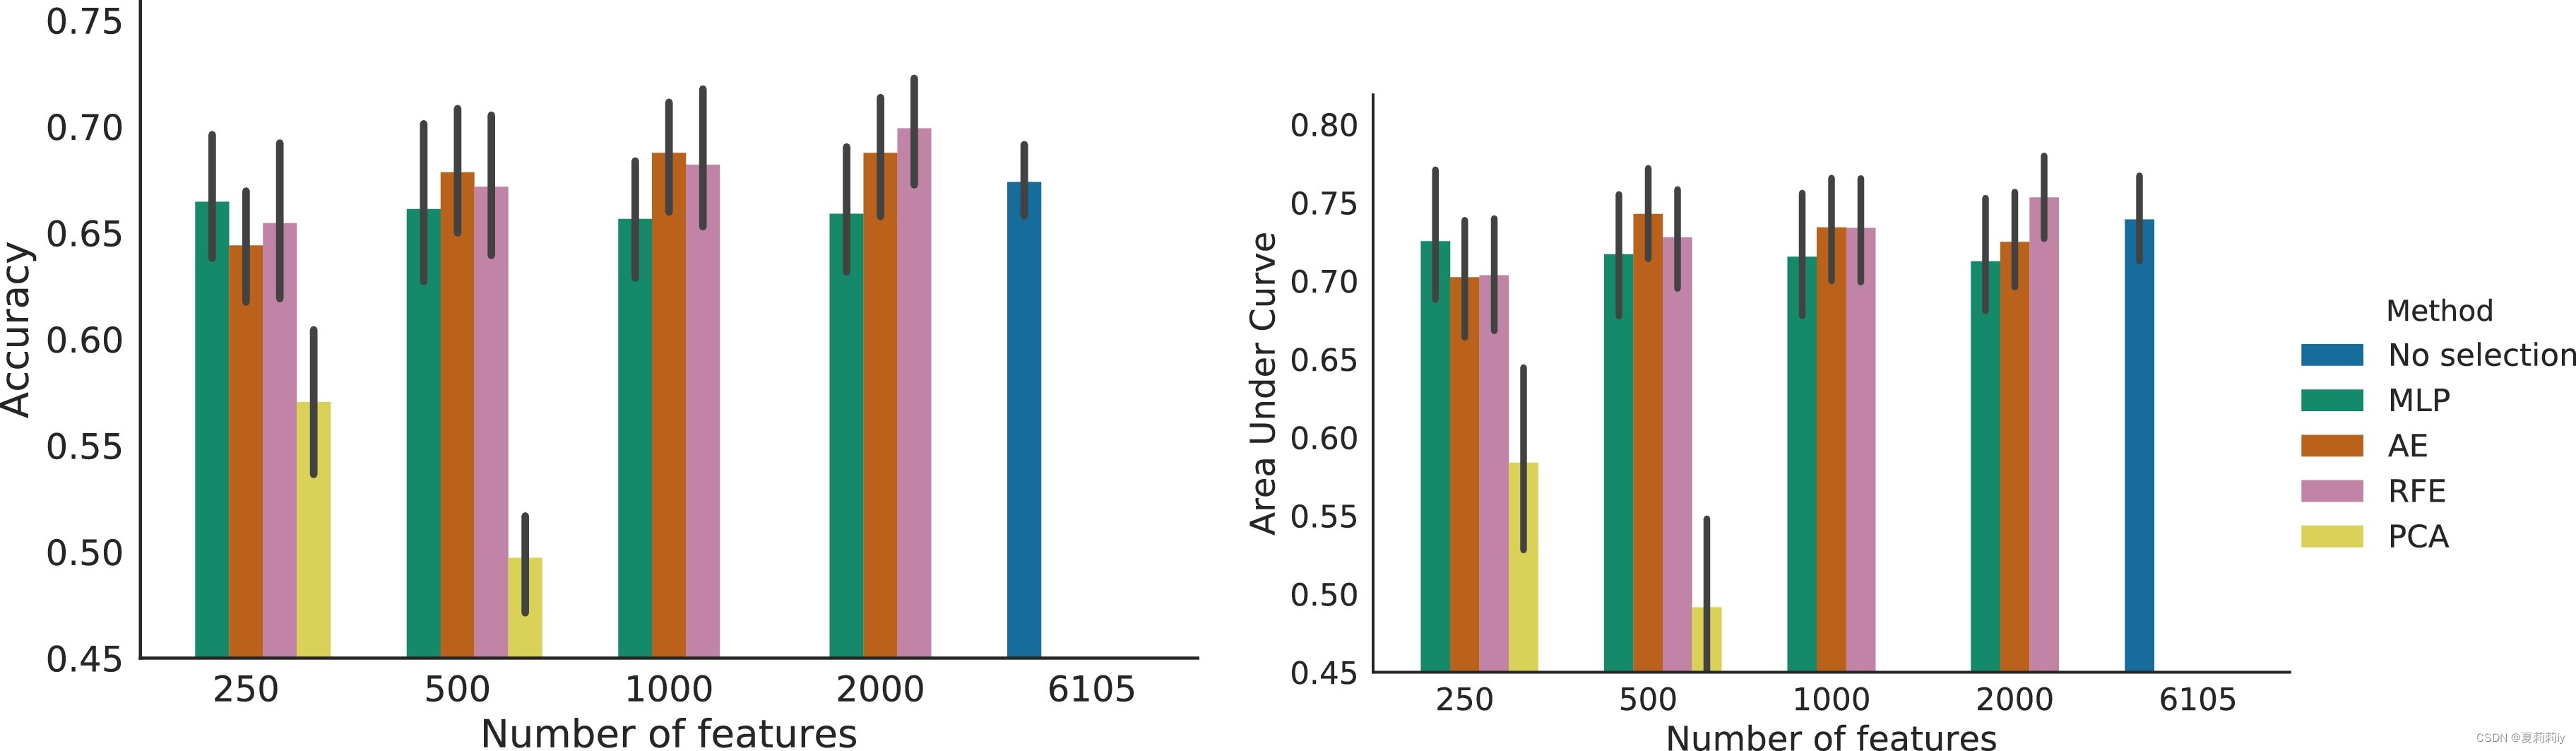
2.4.2. ABIDE feature selection strategy
①Grid search for num_node_feature:
②For PCA, they define for 85% and 95% explained variance
③Epoch of AE: 100, learning rate: 5E-4
④They applied MLP and PCA with the defualt parameter in scikit-learn
⑤Ablation study:
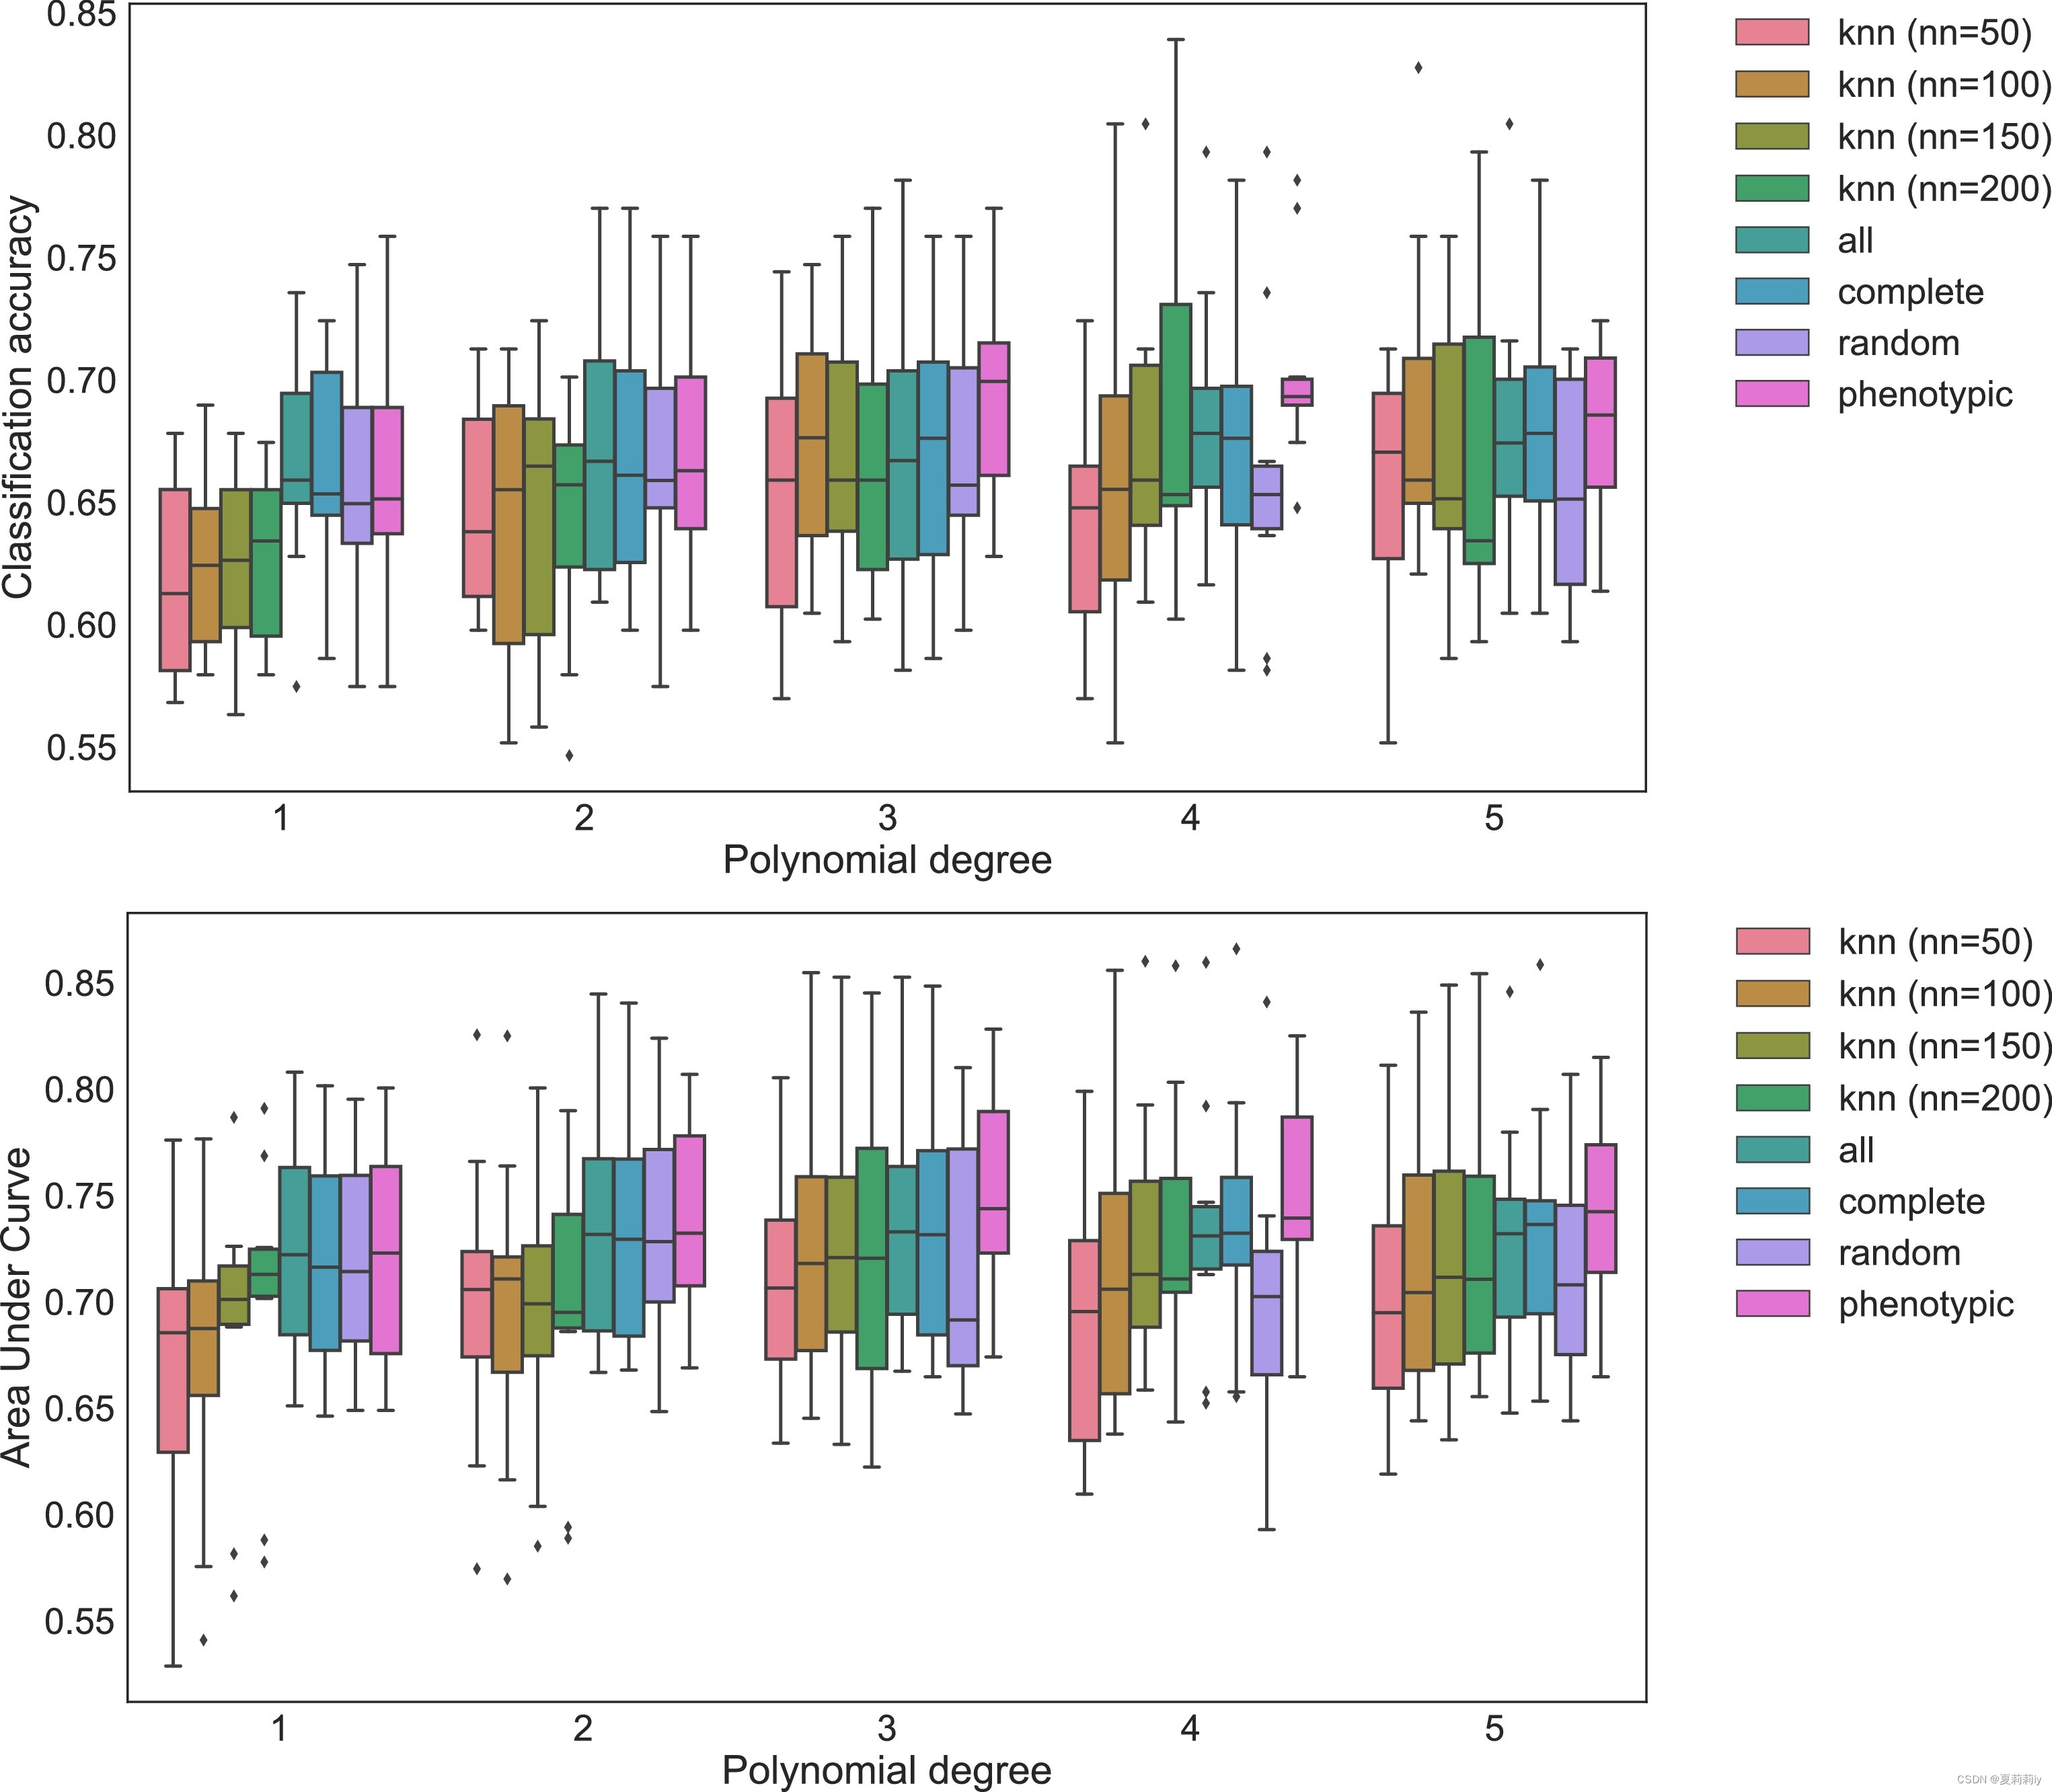
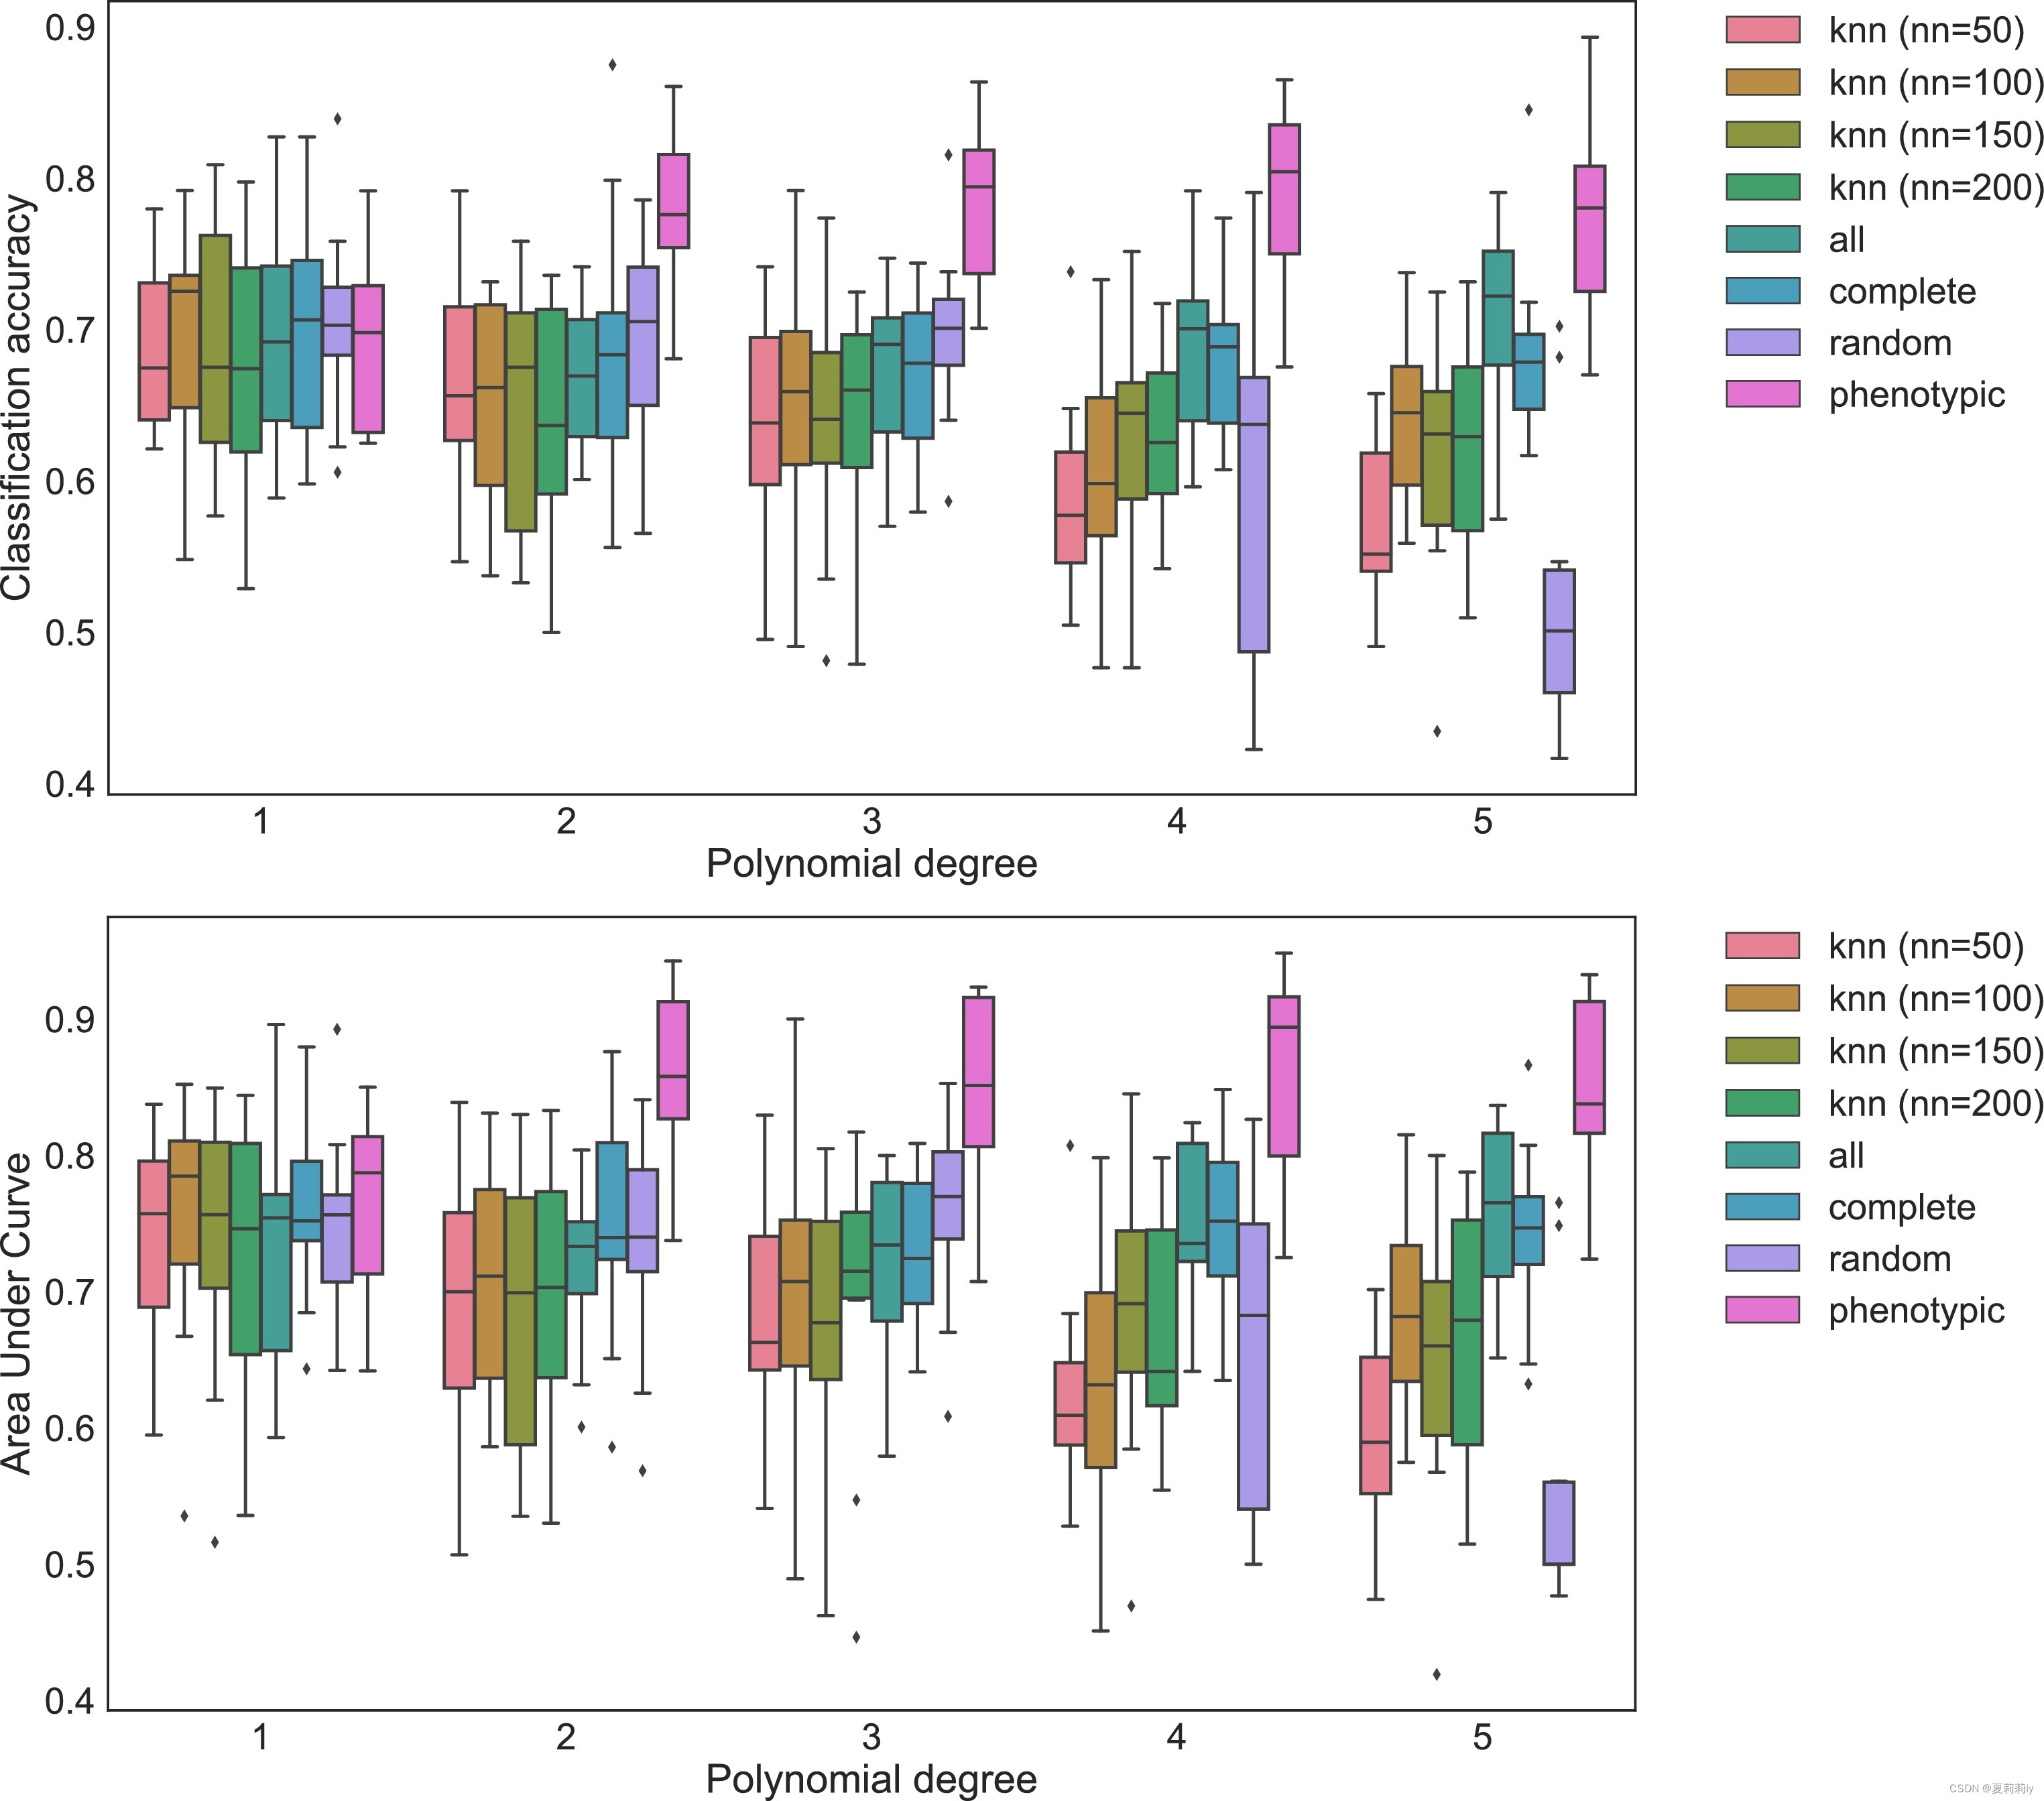
2.4.3. Influence of polynomial order K
①Testing
②Ablation study on ABIDE:
③Ablation study on ADNI:
2.4.4. Graph construction strategy
analysis
2.4.5. Influence of the phenotypic measures
①Ablation study on ADNI:
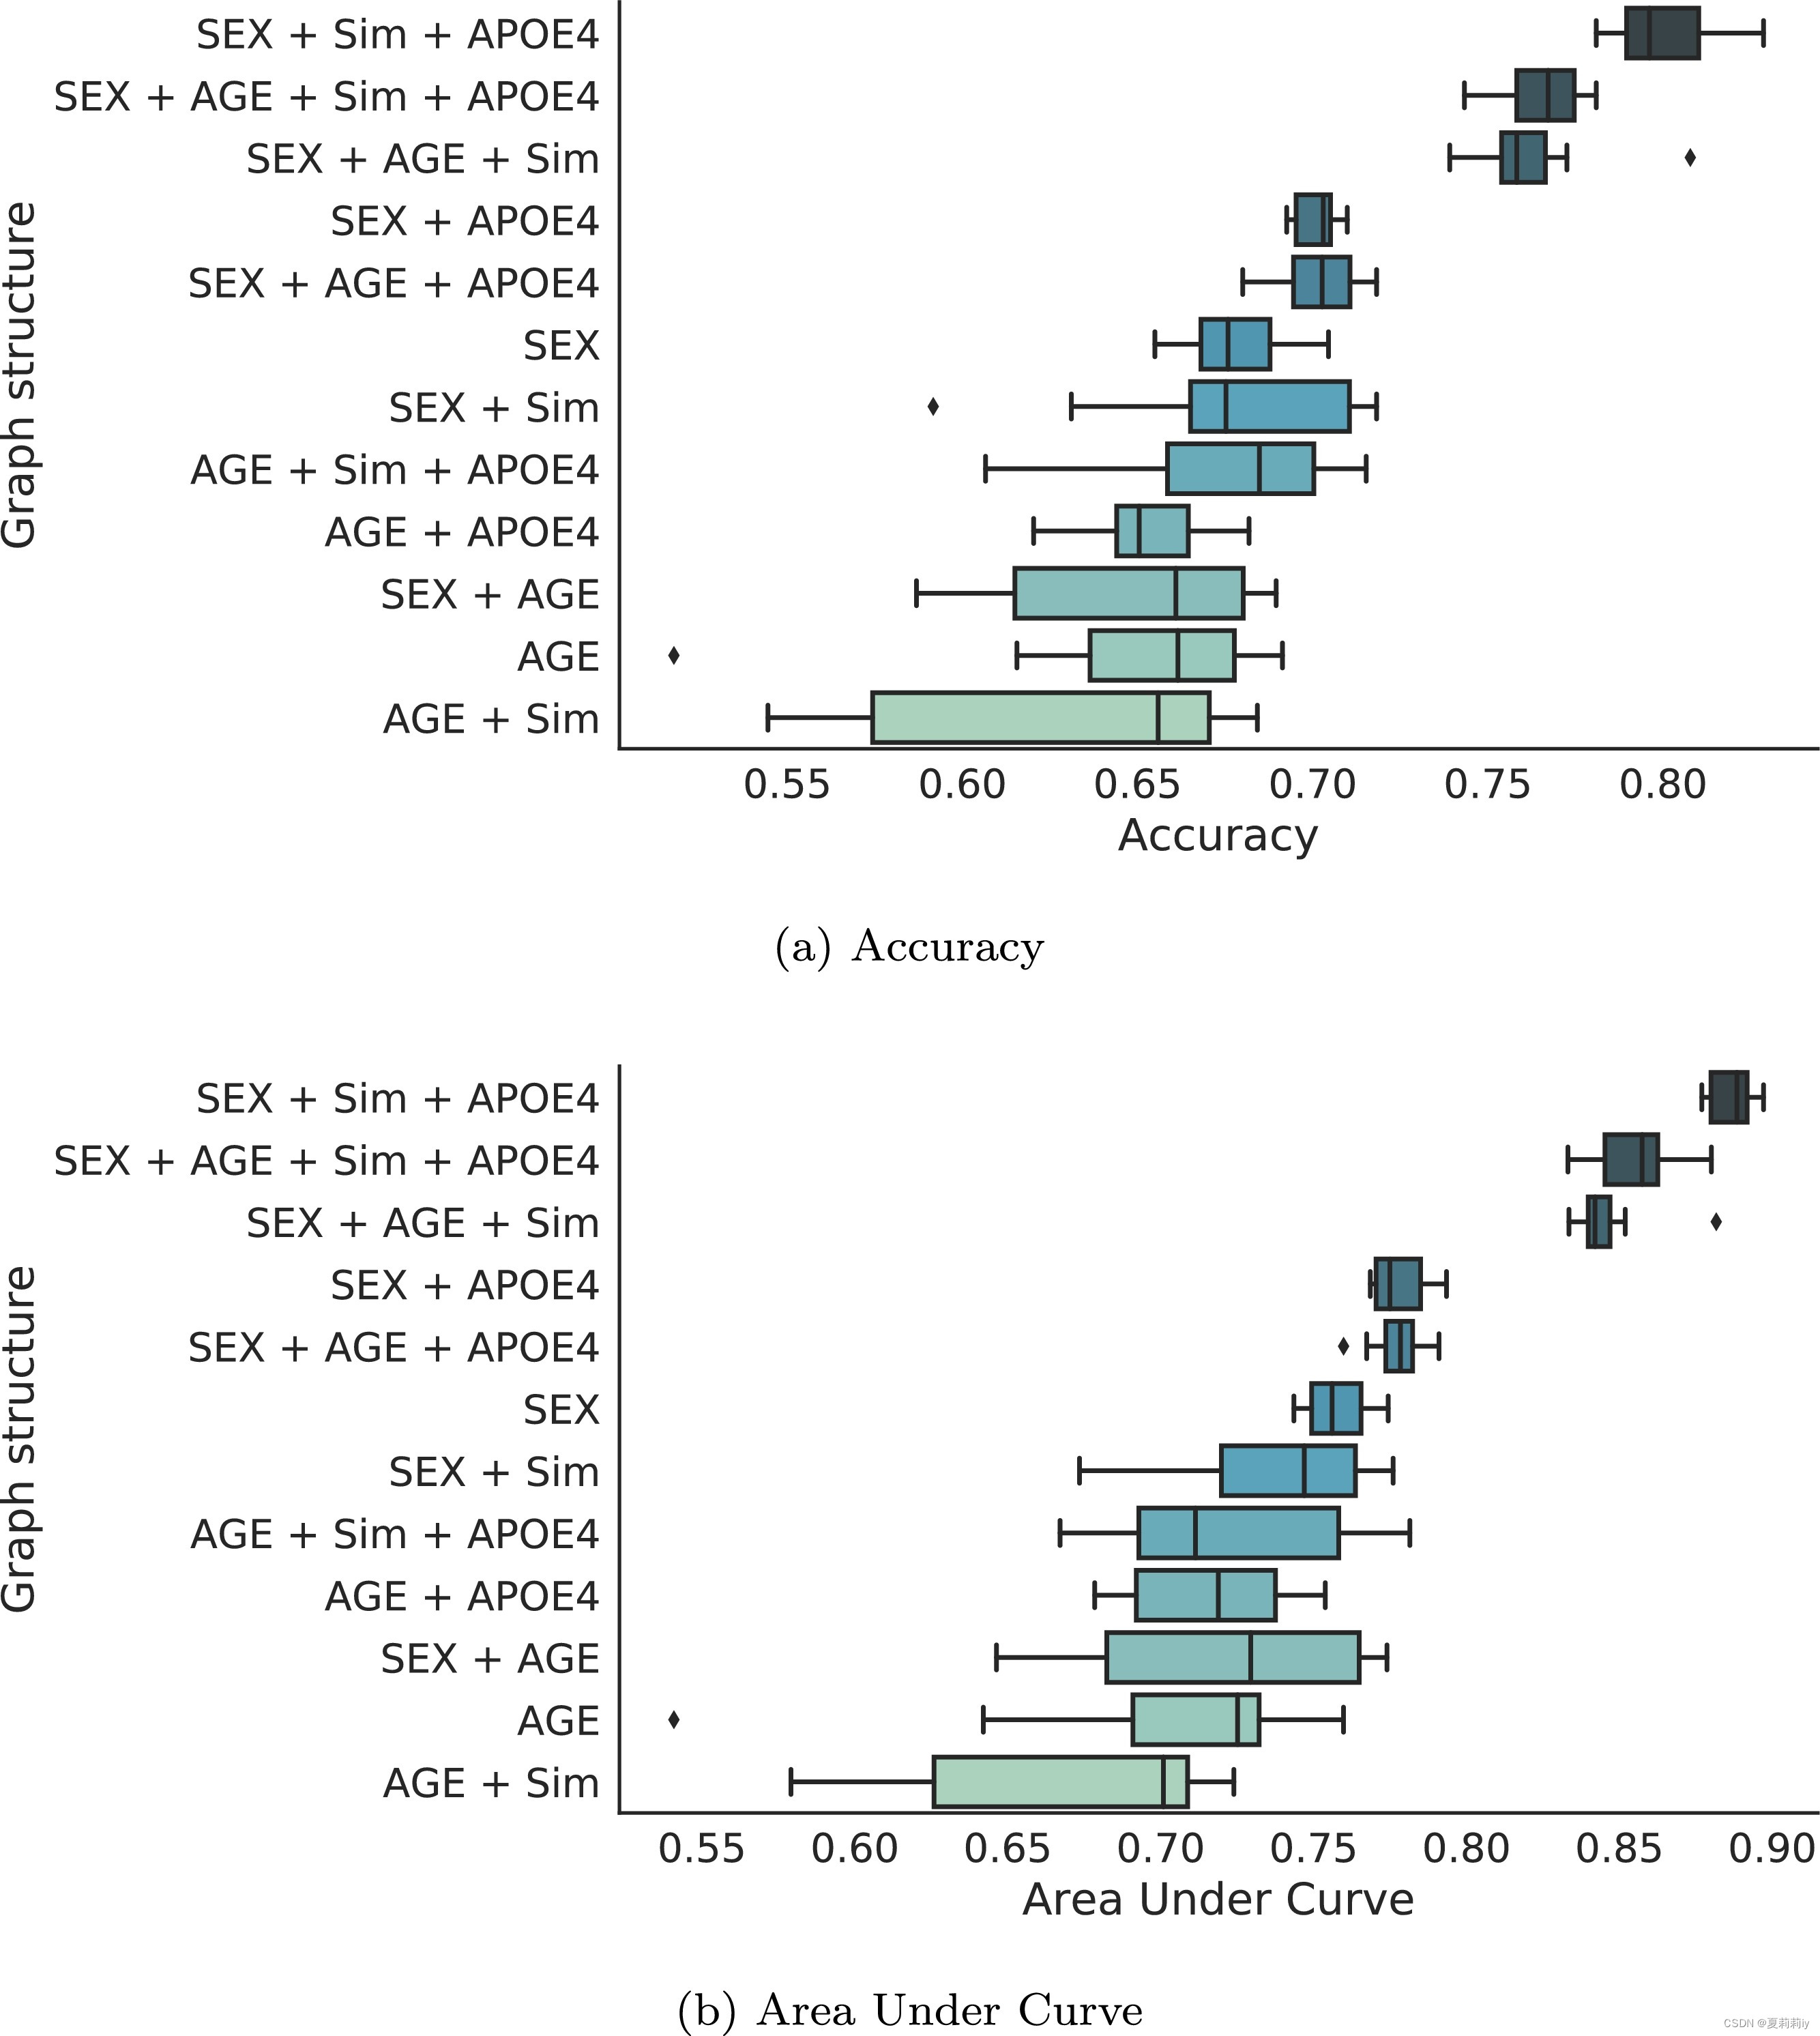
②Ablation study on ABIDE:
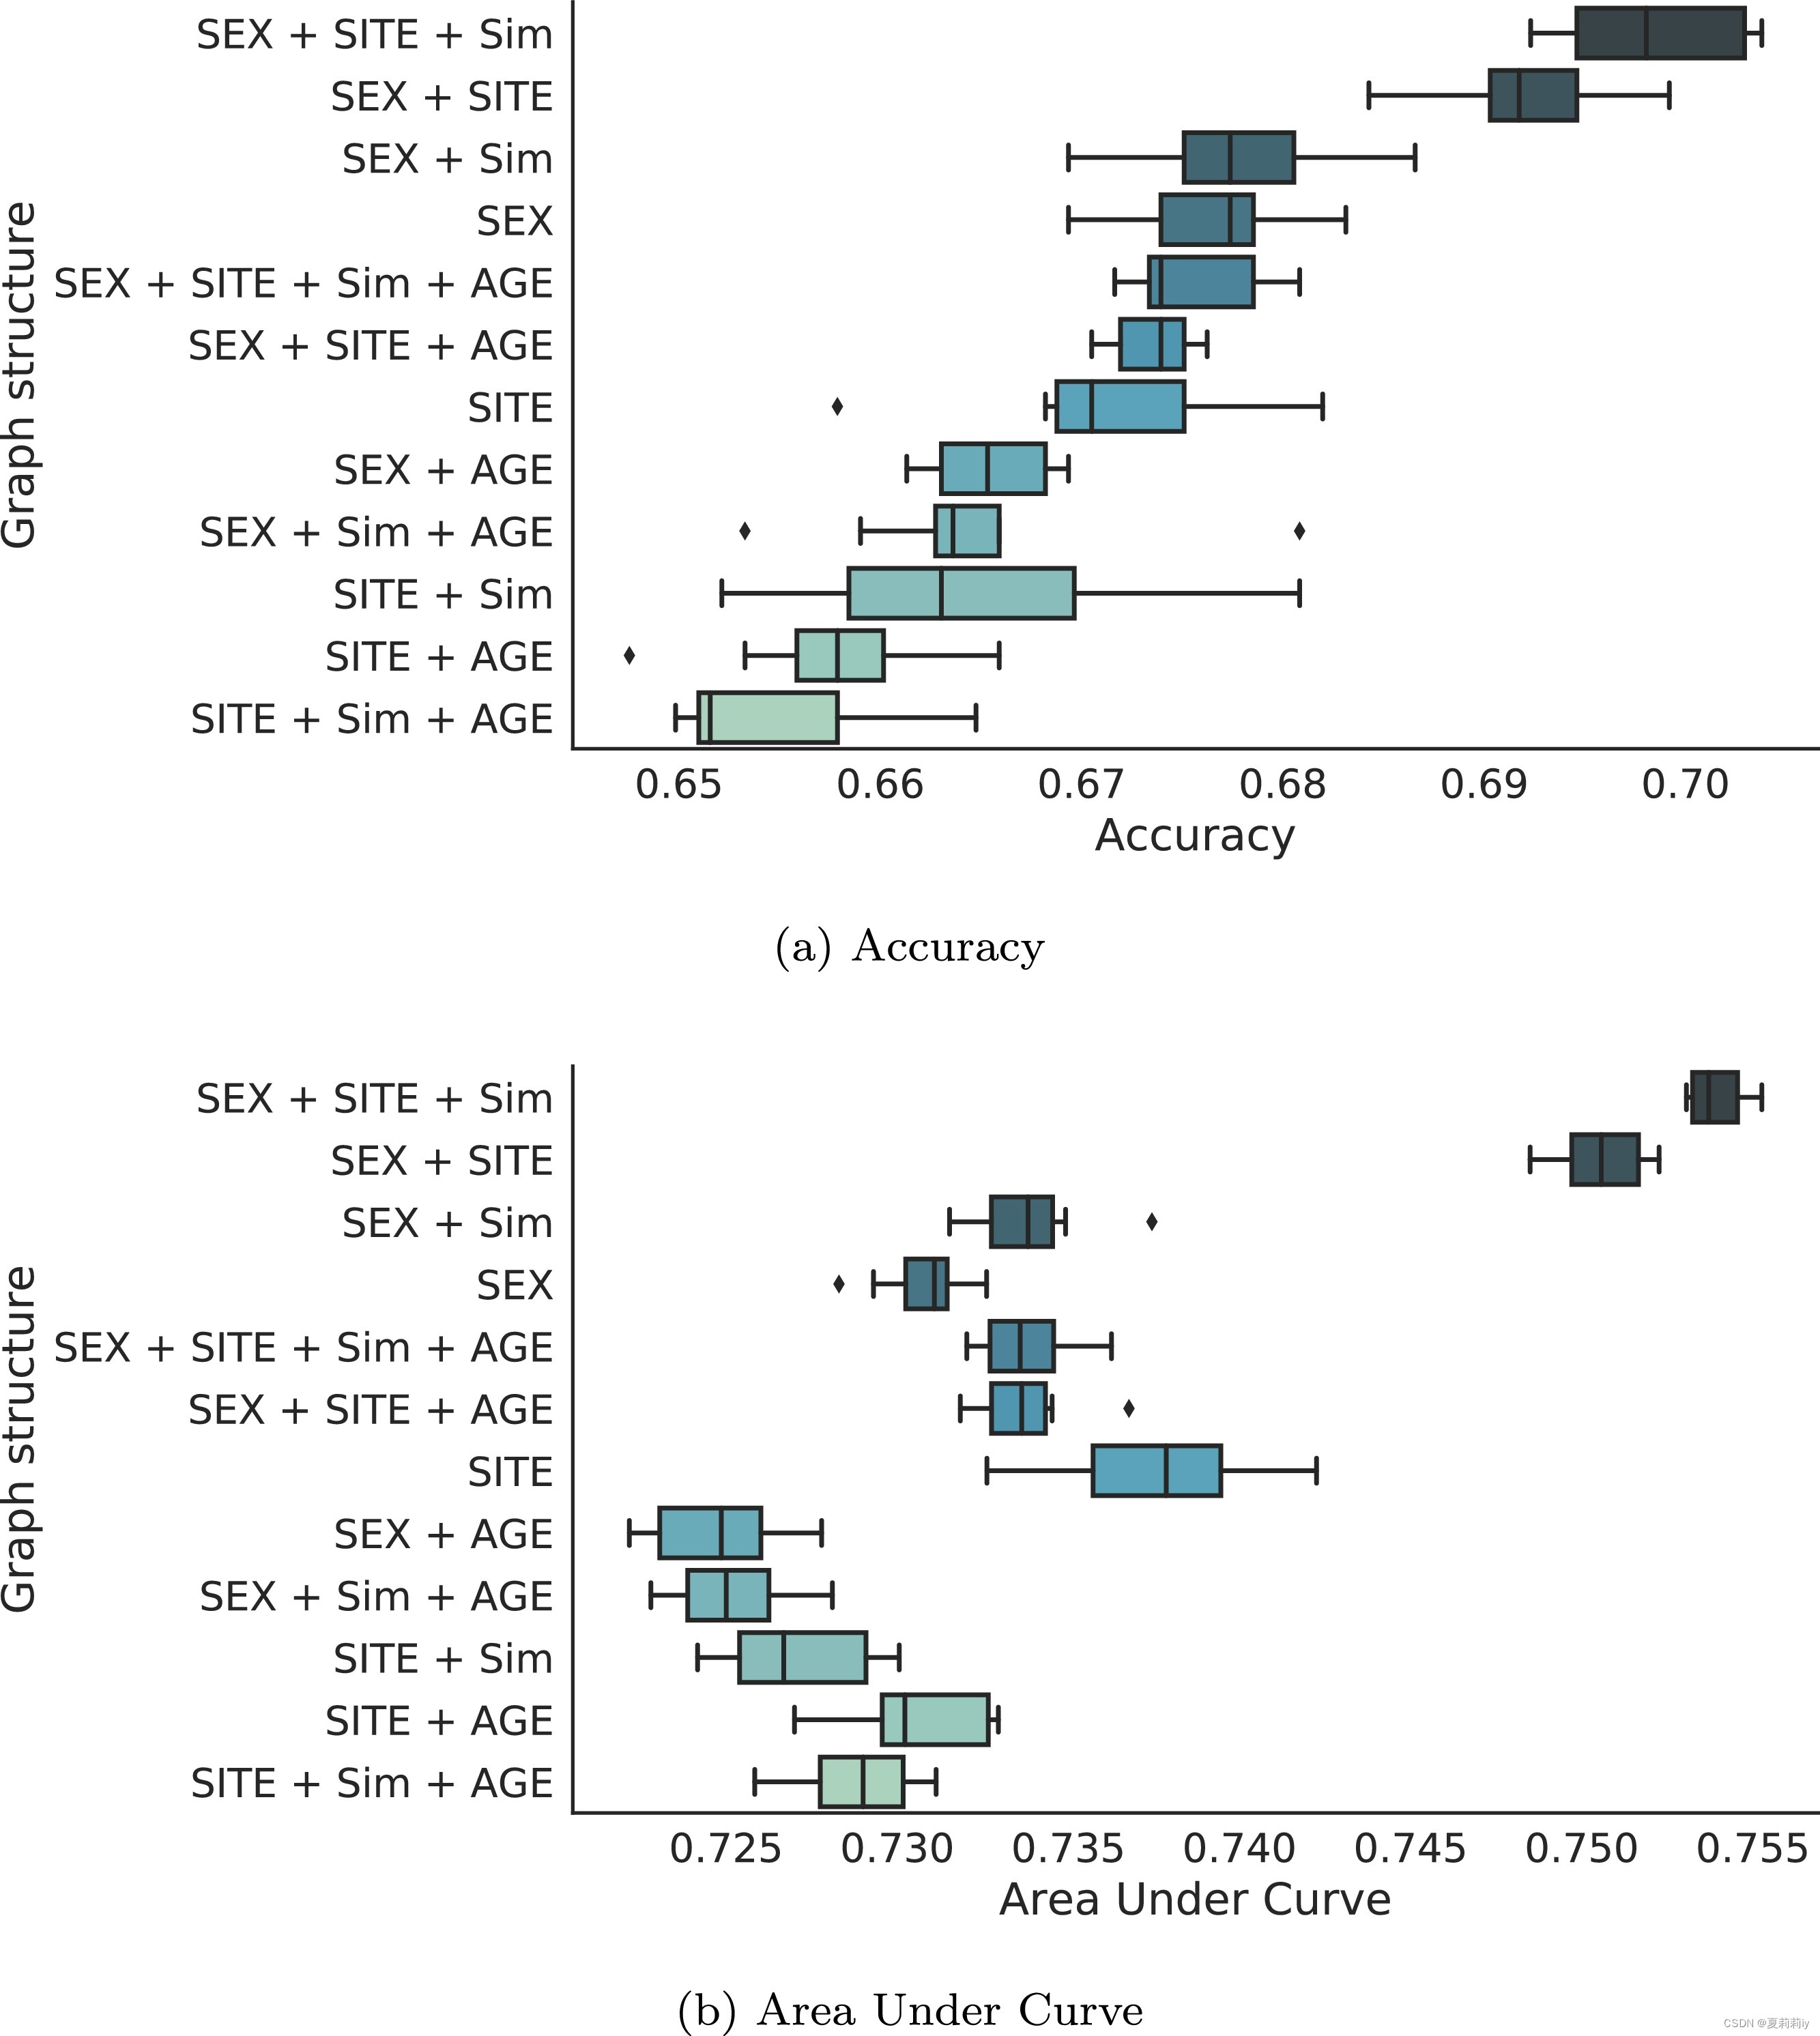
③Combining comparison:

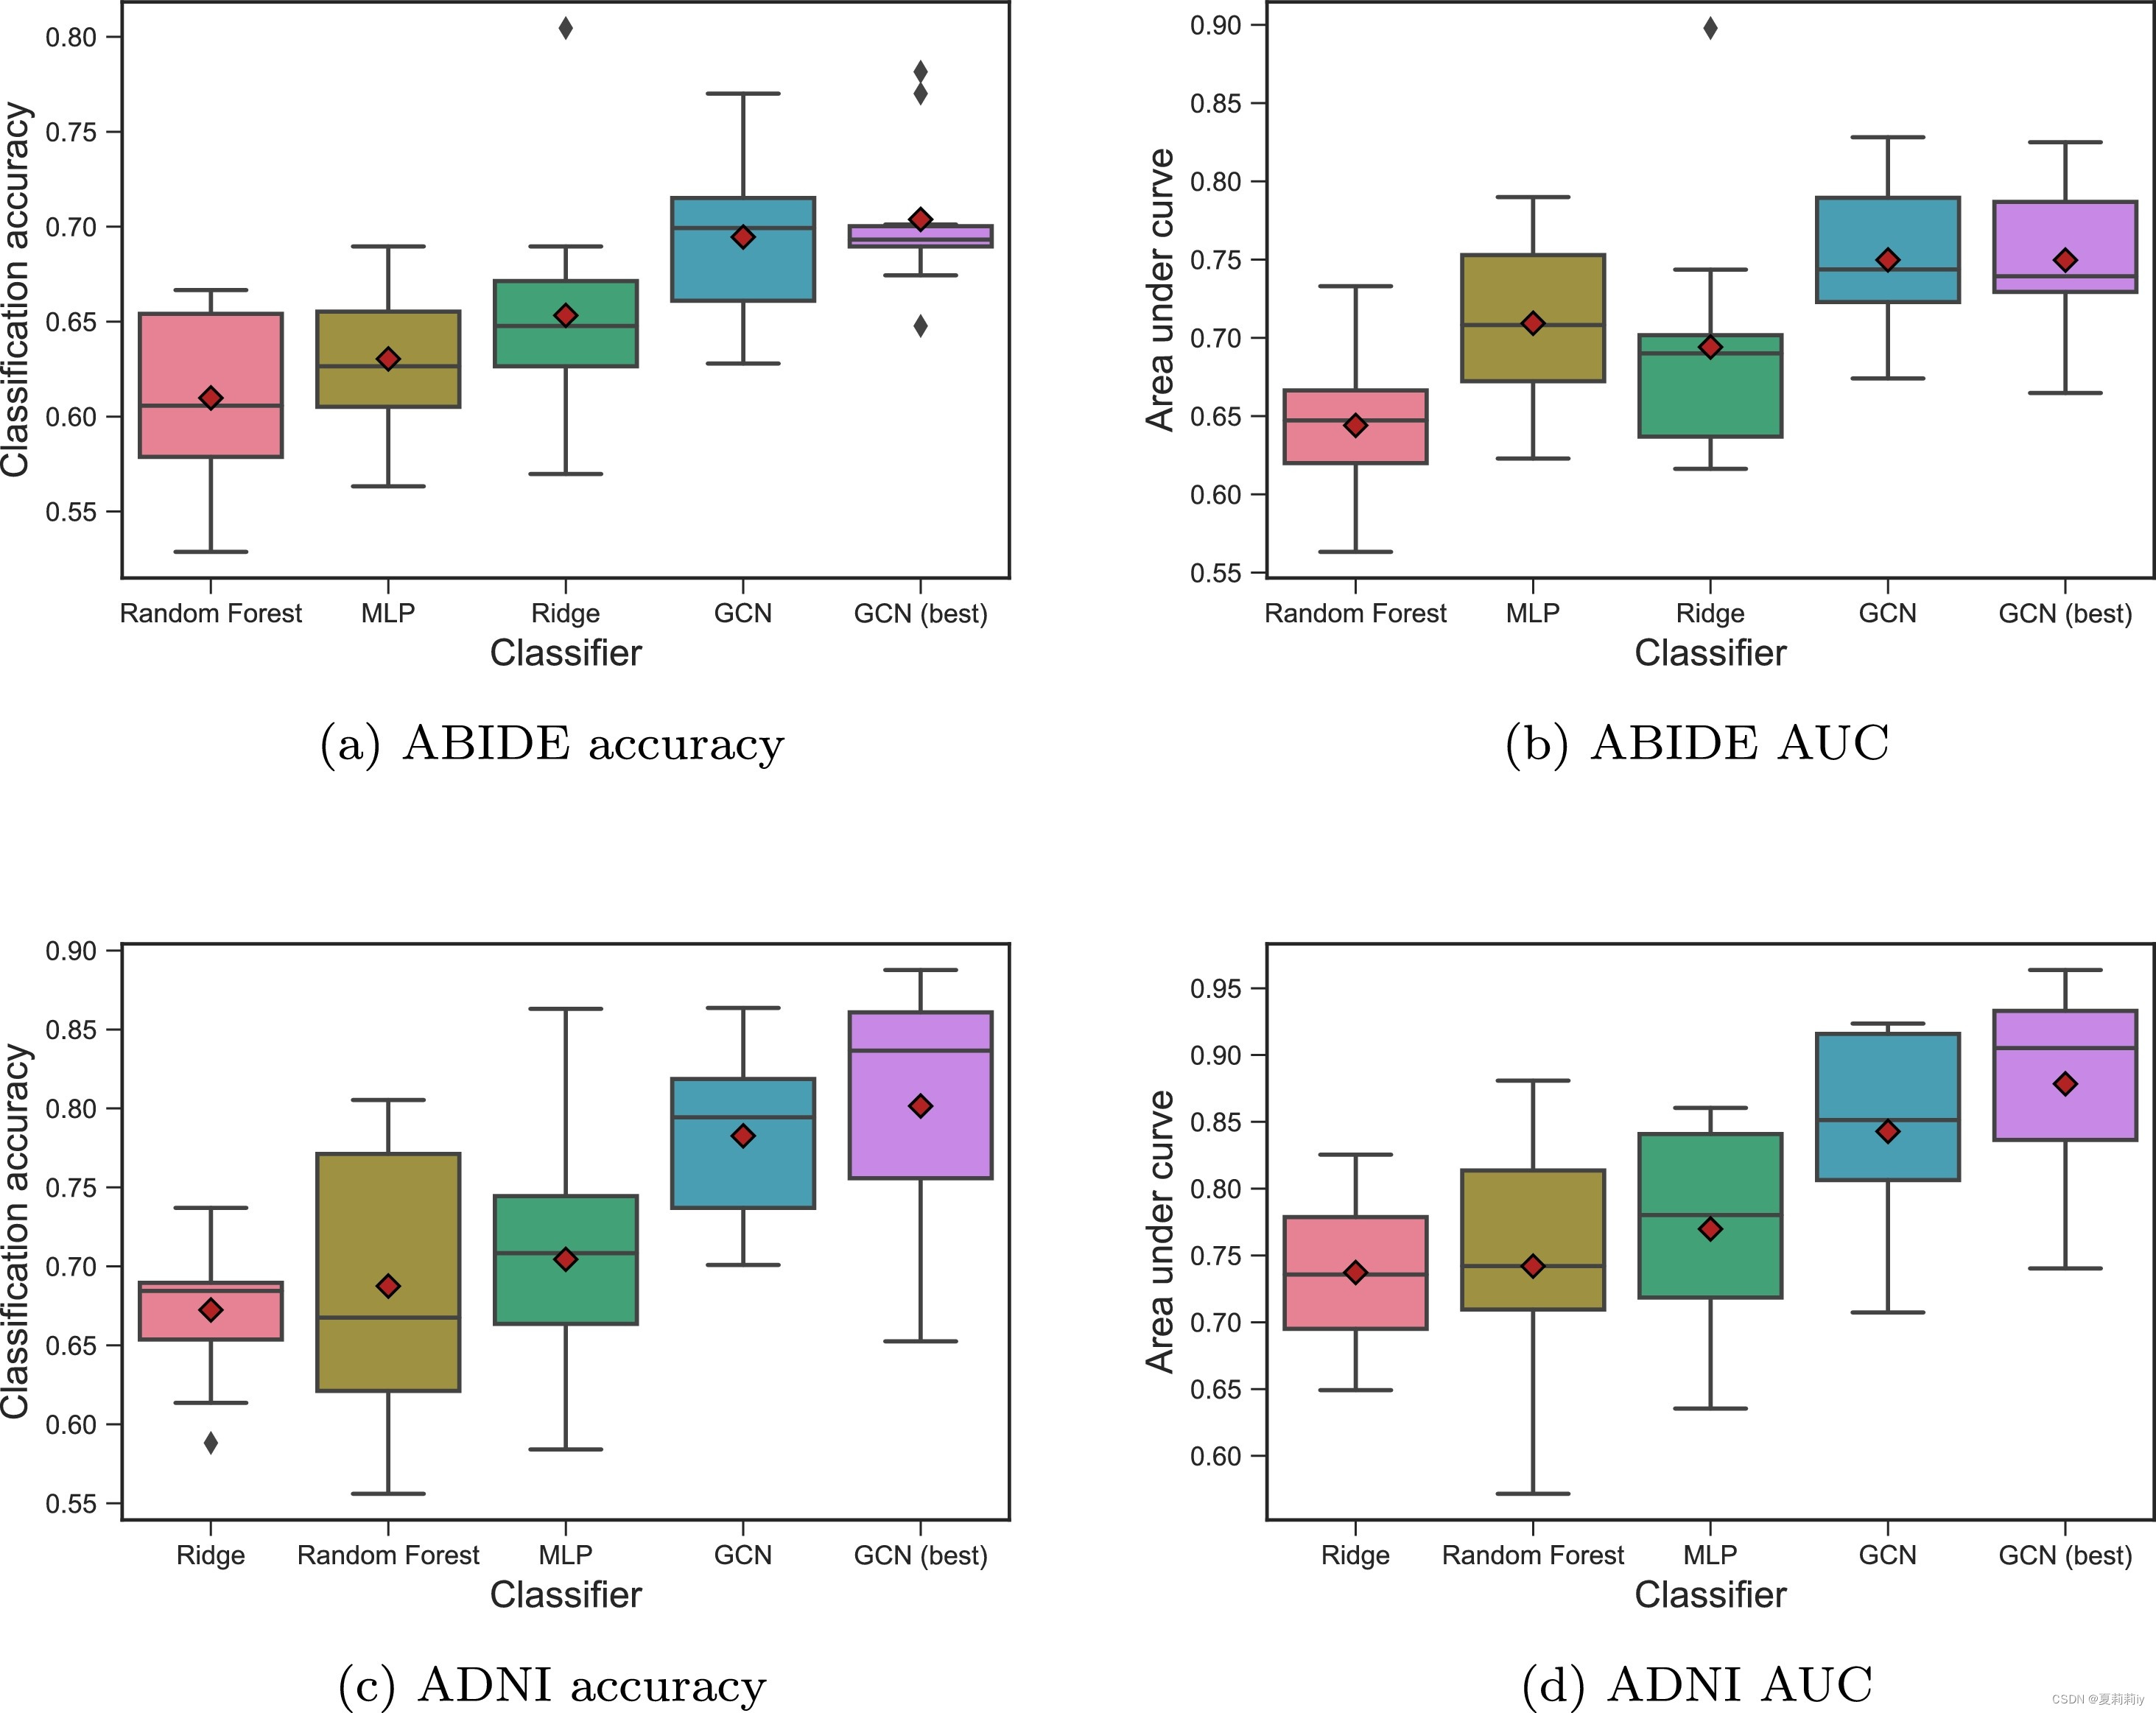
2.4.6. Comparison to other methods
①Comparison of RF, ridge and MLP:
2.5. Discussion
Discussion and conclusion
3. 知识补充
3.1. Kronecker delta function
(1)Kronecker delta function(又称Kronecker符号或克罗内克δ函数)是数学中的一个重要概念,尤其在线性代数、数字信号处理、物理学等领域有着广泛的应用。以下是关于Kronecker delta function的详细解释:
①定义:Kronecker delta function是一个二元函数,通常用于描述两个整数或实数之间的关系;如果两个输入值相等,则函数的输出值为1;如果两个输入值不相等,则输出值为0。
②性质:对称性:Kronecker delta函数具有对称性,即δ(i,j) = δ(j,i)。这意味着函数的输出值不依赖于输入值的顺序;;筛选性:Kronecker delta函数具有筛选性,可以在计算中用于选择或过滤特定的元素;收缩性:在计算中,如果一个指标被重复两次并通过求和符号相连,Kronecker delta函数会起到约简的作用。当两个指标相同时,函数约简求和的结果为1;当两个指标不同时,函数约简的结果为0。
③应用:线性代数:在线性代数中,Kronecker delta function被广泛应用于向量和矩阵运算。例如,在矩阵乘法中,它可以帮助表示两个矩阵的相等性,从而简化计算。此外,它还可以用于计算向量的内积和外积;数字信号处理:在数字信号处理中,Kronecker delta function用于表示离散时间信号的采样和重建过程;物理学:在物理学中,Kronecker delta function有着广泛的应用。例如,在电磁学中,它可以用来描述电流分布和电荷分布的关系;在量子力学中,它用于表示量子态之间的变换关系;在统计物理学中,它用于表示两个状态之间的转化概率。
④符号表示:Kronecker delta function通常使用δ符号表示,但在使用时需要注意与狄拉克δ函数的区别。克罗内克δ函数在使用时带两个下标,而狄拉克δ函数则只有一个变量。
⑤广义形式:除了基本的Kronecker delta function外,还存在广义克罗内克函数的概念,它涉及到矩阵的行列式和张量函数等更高级的数学概念。
(2)参考学习:张量学习(4):Kronecker delta(换标符号) and Eddington(排列符号)-CSDN博客
4. Reference
Parisot, S., Ktena, S. I., Ferrante, E., Lee, M., Guerrero, R., Glocker, B., & Rueckert, D. (2018) 'Disease prediction using graph convolutional networks: Application to Autism Spectrum Disorder and Alzheimer’s disease', Medical Image Analysis, 48: 117-130. doi: Redirecting


 9080
9080


 被折叠的 条评论
为什么被折叠?
被折叠的 条评论
为什么被折叠?
 到【灌水乐园】发言


