


本文转自:http://www.xuebuyuan.com/1014703.html
特别提醒读者:注意实例中数据成员很多都定义成数据,这是由于calcHist函数形参要求的。
直方图在图形处理中很常用,直方图可以统计图像的像素特征分布,用于修改图像显示,修改图像内容,通过比较不同图片的直方图可以识别和跟踪特殊纹理的物体和图像,下面先学习怎么计算图像的直方图。
opencv2提供calchist函数可以方便的计算直方图。
calchist函数头文件 #include <opencv2/imgproc/imgproc.hpp>
calchist函数定义:
//! computes the joint dense histogram for a set of images.
CV_EXPORTS void calcHist( const Mat* images, int nimages,
                          const int* channels, InputArray mask,
                          OutputArray hist, int dims, const int* histSize,
                          const float** ranges, bool uniform=true, bool accumulate=false );

//! computes the joint sparse histogram for a set of images.
CV_EXPORTS void calcHist( const Mat* images, int nimages,
                          const int* channels, InputArray mask,
                          SparseMat& hist, int dims,
                          const int* histSize, const float** ranges,
                          bool uniform=true, bool accumulate=false );

CV_EXPORTS_W void calcHist( InputArrayOfArrays images,
                            const vector<int>& channels,
                            InputArray mask, OutputArray hist,
                            const vector<int>& histSize,
                            const vector<float>& ranges,
                            bool accumulate=false );
举例说明函数应用:
Histogram1D::Histogram1D(){
	histSize[0] = 256;
	hranges[0] = 0.0;
	hranges[1] = 255.0;
	ranges[0] = hranges;
	channels[0] = 0;
}

cv::MatND Histogram1D::getHistogram(const cv::Mat &image){
	cv::MatND hist;
	cv::calcHist(&image,   //source image
		     1,        //histogram from 1 image only
		     channels, //the channel used
		     cv::Mat(),//no mask is uesd
		     hist,     //the resulting histogram
		     1,        //it is a 1D histogram
		     histSize, //number of bins
		     ranges    //pixel value range
				);//直方图函数
	return hist;
}
函数参数介绍:
const Mat* images //源图像组
int nimages (Number of source arrays) //源图像组图像个数
const int* channels (List of the dims channels used to compute the histogram.) //图像信道
InputArray mask ( Optional mask. If the matrix is not empty, it must be an 8-bit array of the same size as arrays[i]. The non-zero mask elements mark the array elements counted in the histogram.)
//可选的掩码,如果不为空,则必须是8-bit数组,而且大小和原图像相同,非零位置为要计算的直方 图区域
OutputArray hist (Output histogram, which is a dense or sparse dims -dimensional array.)
//输出直方图数组,稠密或者稀疏,dims维的数组
int dims ( Histogram dimensionality that must be positive and not greater than CV_MAX_DIMS)
//处理直方图的维数正数,最大32维,CV_MAX_DIMS是32.
const int* histSize ( Array of histogram sizes in each dimension.)
//每一维的直方图的尺寸大小
const float** ranges (Array of the dims arrays of the histogram bin boundaries in each dimension. When the histogram is uniform ( uniform =true), then for each dimension i it is enough to specify the lower (inclusive) boundary
of the 0-th histogram bin and the upper(exclusive) boundary for the last histogram bin histSize[i]-1. That is, in case of a uniform histogram each of ranges[i] is an array of 2 elements. When the histogram is not uniform ( uniform=false ), then each of
ranges[i] contains histSize[i]+1 elements:. The array elements, that are not between and,are not counted in the histogram.)
//直方图每一维的数据大小范围
下面是计算1维图像的直方图:
cv::Mat Histogram1D::getHistogramImage(const cv::Mat &image){
	//compute histogram first
	cv::MatND hist = getHistogram(image);
	//get min and max bin values
	double maxVal = 0;
	double minVal = 0;
	cv::minMaxLoc(hist,&minVal,&maxVal,0,0);
	//Image on which to display histogram
	cv::Mat histImg(histSize[0],histSize[0],CV_8U,cv::Scalar(255));
	//set highest point at 90% of nbins
	int hpt = static_cast<int>(0.9*histSize[0]);
	//Draw a vertical line for each bin
	for (int h =0;h<histSize[0];h++)
	{
		float binVal = hist.at<float>(h);
		int intensity = static_cast<int>(binVal*hpt/maxVal);
		cv::line(histImg,cv::Point(h,histSize[0]),cv::Point(h,histSize[0]-intensity),cv::Scalar::all(0));
	}
	return histImg;
}
源图像:
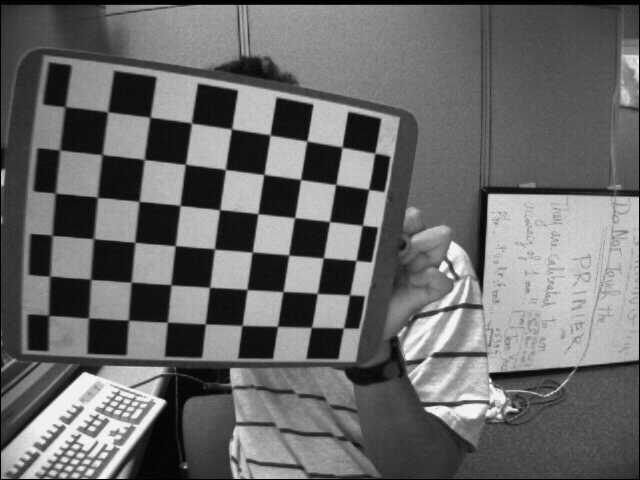
histogram:
计算H-S直方图分布:
/*********************************************
内容:计算H-S 直方图分布
时间:2013 5.27
作者:恋上蛋炒面
*********************************************/
#include <opencv2/core/core.hpp>
#include <opencv2/highgui/highgui.hpp>
#include <opencv2/imgproc/imgproc.hpp>
using namespace cv;
void main()
{
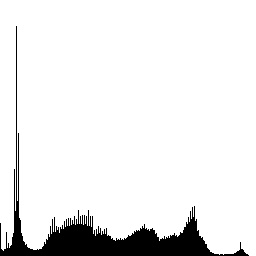
Mat source = imread("baboon.jpg");
namedWindow("Source");
imshow("Source",source);
Mat hsv;
cvtColor(source,hsv,CV_BGR2HSV);
//Quantize the hue to 60 levels
//and the saturation to 64 levels
int hbins = 60,sbins = 64;
int histSize[] = {hbins,sbins};
//hue varies from 0 to 179
float hranges[] = {0,180};
//saturation varies from 0 to 255
float sranges[] = {0,255};
const float *ranges[] = {hranges,sranges};
//two channels 0th,1th
int channels[] = {0,1};
MatND hist;
//compute h-s histogram
calcHist(&hsv,1,channels,Mat(),hist,2,histSize,ranges);
//get the max value
double maxVal = .0;
minMaxLoc(hist,0,&maxVal,0,0);
int scale = 8;
//show the histogram on the image
Mat histImg = Mat::zeros(sbins*scale,hbins*scale,CV_8UC3);
for (int h = 0;h < hbins;h++)
{
for (int s = 0;s<sbins;s++)
{
float binVal = hist.at<float>(h,s);
int intensity = cvRound(binVal*0.9*255/maxVal);
rectangle(histImg,Point(h*scale,s*scale),Point((h+1)*scale-1,(s+1)*scale-1),Scalar::all(intensity),CV_FILLED);
}
}
namedWindow("H-S Histogram");
imshow("H-S Histogram",histImg);
imwrite("hshistogram.jpg",histImg);
waitKey(0);
}源图像:
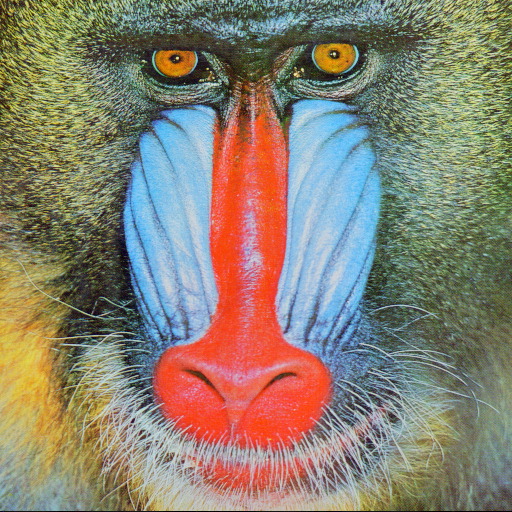
h-s histogram:
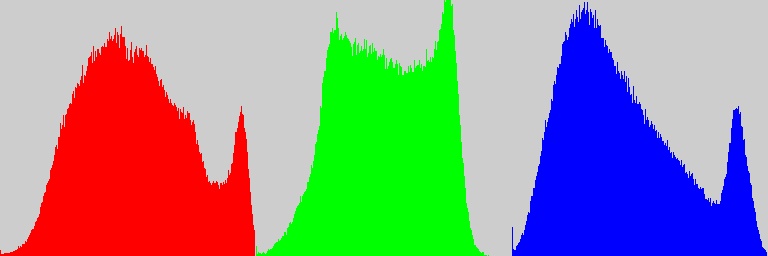
RGB直方图:
#include <opencv2/core/core.hpp>
#include <opencv2/highgui/highgui.hpp>
#include <opencv2/imgproc/imgproc.hpp>
using namespace cv;

void main()
{
	//Mat source = imread("red.jpg");
	Mat source = imread("baboon.jpg");
	//Mat source(300,300,CV_8UC3,Scalar(1,1,244));
	//imwrite("red.jpg",source);
	namedWindow("Source");
	imshow("Source",source);
	int channels_r[1],channels_g[1],channels_b[1],histSize[1];
	float hranges[2];
	const float *ranges[1];
	histSize[0] = 256;
	hranges[0] = 0.0;
	hranges[1] = 255.0;
	ranges[0] = hranges;
	channels_b[0] = 0;
	channels_g[0] = 1;
	channels_r[0] = 2;
	MatND hist_r,hist_g,hist_b;

	double max_val_r,max_val_g,max_val_b;
	Mat histImage(histSize[0],3*histSize[0],CV_8UC3);
	//R
	calcHist(&source,1,channels_r,Mat(),hist_r,1,histSize,ranges);
	minMaxLoc(hist_r,0,&max_val_r,0,0);
	//G
	calcHist(&source,1,channels_g,Mat(),hist_g,1,histSize,ranges);
	minMaxLoc(hist_r,0,&max_val_g,0,0);
	//B
	calcHist(&source,1,channels_b,Mat(),hist_b,1,histSize,ranges);
	minMaxLoc(hist_r,0,&max_val_b,0,0);

	for (int i =0;i<histSize[0];i++)
	{
		float binVal_r = hist_r.at<float>(i);
		float binVal_g = hist_g.at<float>(i);
		float binVal_b = hist_b.at<float>(i);
		int intensity_r = static_cast<int>(0.9*histSize[0]*binVal_r/max_val_r);
		int intensity_g = static_cast<int>(0.9*histSize[0]*binVal_g/max_val_g);
		int intensity_b = static_cast<int>(0.9*histSize[0]*binVal_b/max_val_b);
		line(histImage,Point(i,histImage.rows),Point(i,histImage.rows-intensity_r),Scalar(0,0,255));
		line(histImage,Point(i+histSize[0],histImage.rows),Point(i+histSize[0],histImage.rows-intensity_g),Scalar(0,255,0));
		line(histImage,Point(i+histSize[0]*2,histImage.rows),Point(i+histSize[0]*2,histImage.rows-intensity_b),Scalar(255,0,0));
	}
	namedWindow("RGB Histogram");
	imshow("RGB Histogram",histImage);
	waitKey(0);
}
源图像:图上图
RGB-Histogram:
<pre class="cpp" name="code"><pre class="cpp" name="code"><pre class="cpp" name="code"><pre class="cpp" name="code"><pre class="cpp" name="code"><pre>


 792
792

 被折叠的 条评论
为什么被折叠?
被折叠的 条评论
为什么被折叠?
 到【灌水乐园】发言


