


车辆轨迹预测系列 (五):Argoverse API Forecasting Tutorial代码解析
文章目录
本文简单介绍Argoverse API中
demo_usage/argoverse_forecasting_tutorial.ipynb所使用到的方法
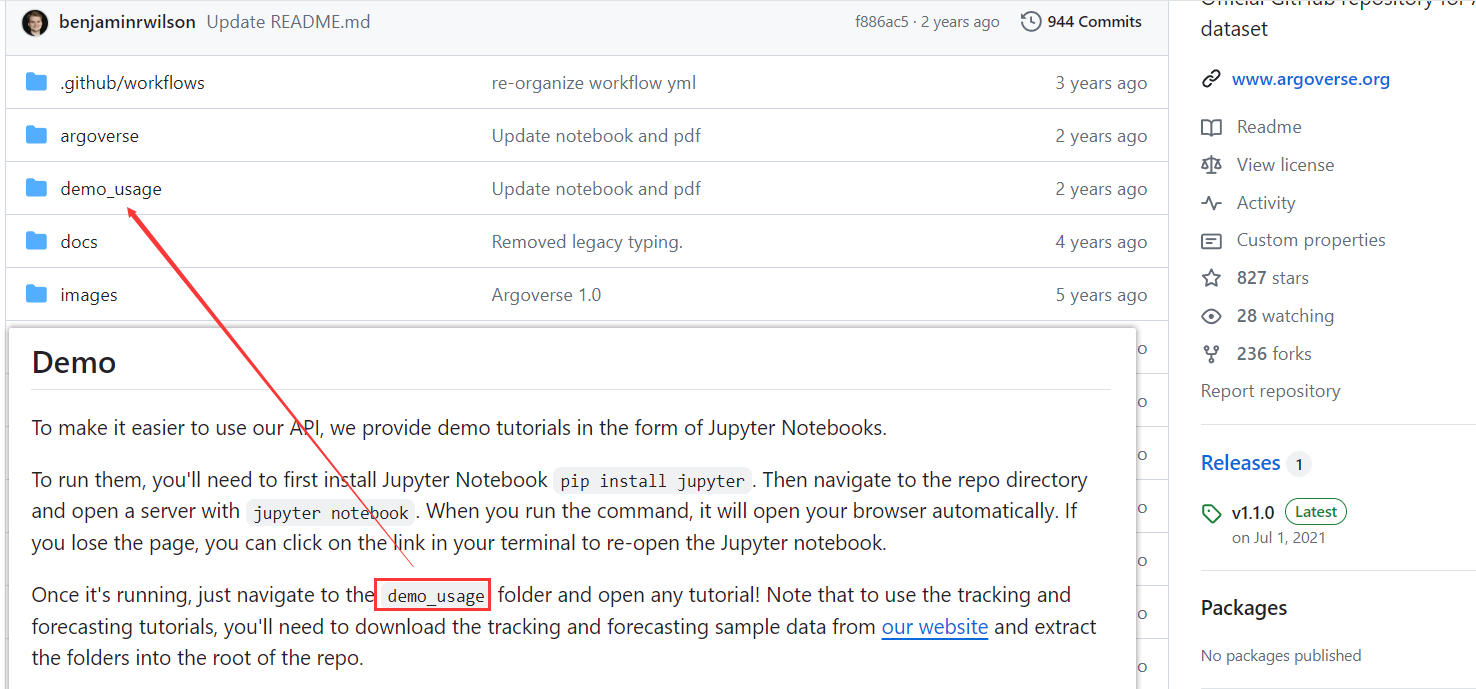
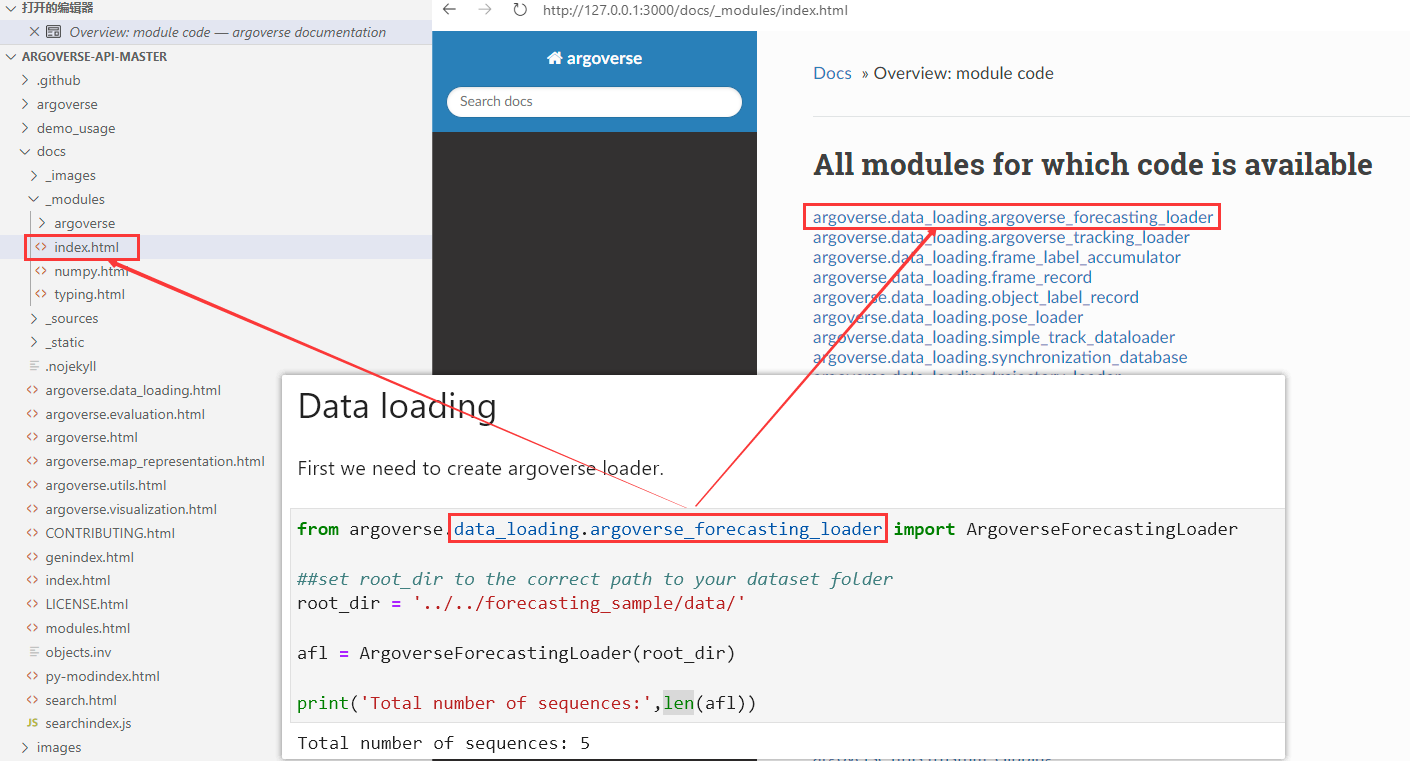
此外,官方提供了文档说明,但是好像没有在线版本,文档需的位置在于./docs/index,html
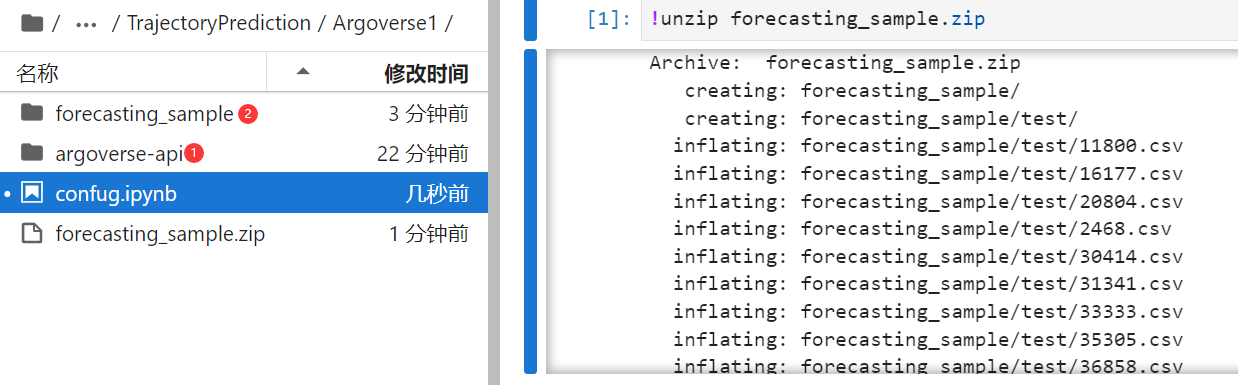
和之前类似,为了方便起见,我这里提供一个mini版本数据集,用于快速调试。forecasting_sample.zip可以访问https://github.com/daetz-coder/VectorNet_Code_Replication/tree/main/argoverse-api下载
- 保持
argoverse-api和forecasting_sample在同一级中 pip install argoverse-api可以参考https://blog.csdn.net/a_student_2020/article/details/140000845
具体的数据展示如下
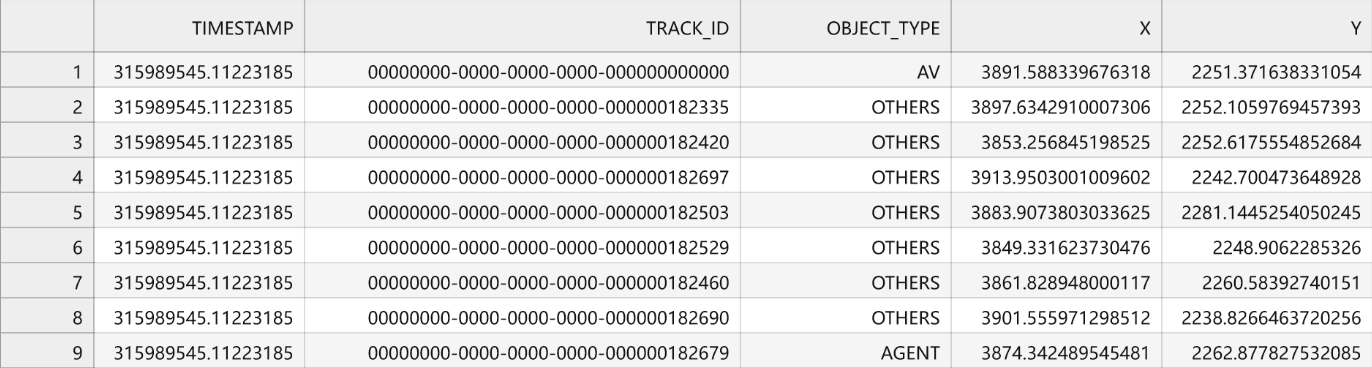
AV(Autonomous Vehicle)指的是自动驾驶汽车,也就是无人驾驶汽车(拍摄车辆)。
AGENT是指的是在汽车道路上行驶的所有车辆,包括自动驾驶汽车和人驾驶汽车。
OTHER是指的是道路上的其他物体,例如行人、自行车、摩托车等。
- What does “AV” mean in the forecasting dataset? · Issue #58 · argoverse/argoverse-api · GitHub
- argoverse数据集里面的AV,AGENT,OTHER是什么意思-CSDN博客
一、argoverse.data_loading.argoverse_forecasting_loader
from argoverse.data_loading.argoverse_forecasting_loader import ArgoverseForecastingLoader
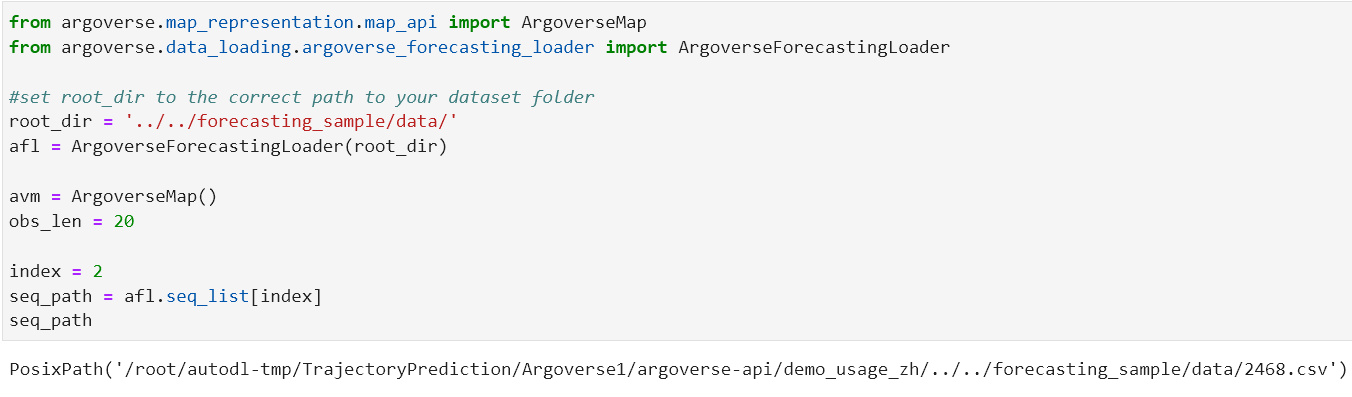
##set root_dir to the correct path to your dataset folder
root_dir = '../../forecasting_sample/data/'
afl = ArgoverseForecastingLoader(root_dir)
print('Total number of sequences:',len(afl))
-
__getitem__(key)[source]Get the DataLoader object for the sequence corresponding to the given index.Parameterskey (
int) – index of the elementReturn typeArgoverseForecastingLoaderReturnsData Loader object for the given indexdef __getitem__(self, key: int) -> "ArgoverseForecastingLoader": """Get the DataLoader object for the sequence corresponding to the given index. Args: key: index of the element Returns: Data Loader object for the given index """ self.counter = key self.current_seq = self.seq_list[self.counter] return self -
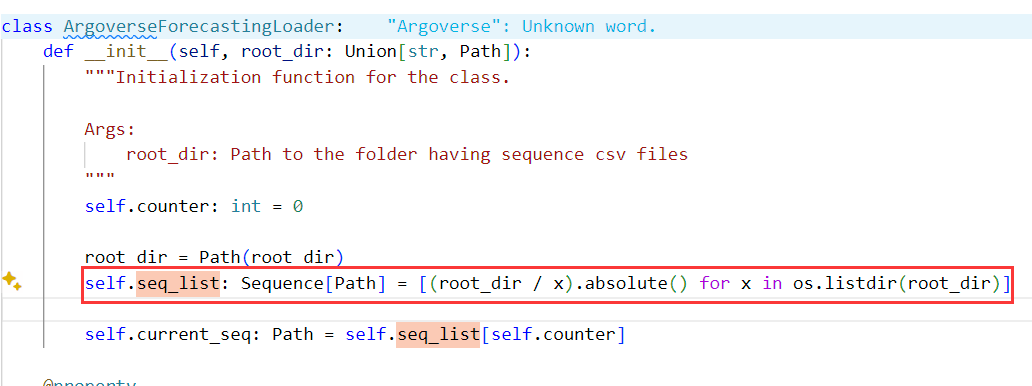
__init__(root_dir)[source]Initialization function for the class.Parametersroot_dir (
Union[str,Path]) – Path to the folder having sequence csv filesdef __init__(self, root_dir: Union[str, Path]): """Initialization function for the class. Args: root_dir: Path to the folder having sequence csv files """ self.counter: int = 0 root_dir = Path(root_dir) self.seq_list: Sequence[Path] = [(root_dir / x).absolute() for x in os.listdir(root_dir)] self.current_seq: Path = self.seq_list[self.counter]这里面的
counter会默认设置初值0,这意味着从序列列表的第一个元素开始处理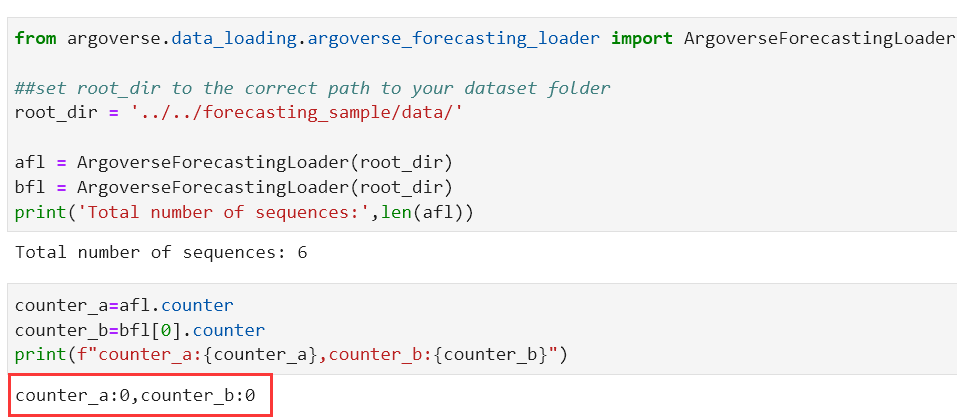
-
__iter__()[source]Iterator for enumerating over sequences in the root_dir specified.Return type
ArgoverseForecastingLoaderReturnsData Loader object for the first sequence in the data -
__len__()[source]Get the number of sequences in the dataReturn type
intReturnsNumber of sequences in the data -
__next__()[source]Get the Data Loader object for the next sequence in the data.Return type
ArgoverseForecastingLoaderReturnsData Loader object for the next sequence in the data__iter__和__next__提供迭代器方法,使用for循环遍历它的行为如下:for argoverse_forecasting_data in afl: print(argoverse_forecasting_data)Seq : /root/autodl-tmp/TrajectoryPrediction/Argoverse1/argoverse-api/demo_usage_zh/../../forecasting_sample/data/11800.csv ---------------------- || City: PIT || # Tracks: 42 ---------------------- Seq : /root/autodl-tmp/TrajectoryPrediction/Argoverse1/argoverse-api/demo_usage_zh/../../forecasting_sample/data/16177.csv ---------------------- || City: MIA || # Tracks: 19 ---------------------- Seq : /root/autodl-tmp/TrajectoryPrediction/Argoverse1/argoverse-api/demo_usage_zh/../../forecasting_sample/data/2468.csv ---------------------- || City: MIA || # Tracks: 24 ---------------------- Seq : /root/autodl-tmp/TrajectoryPrediction/Argoverse1/argoverse-api/demo_usage_zh/../../forecasting_sample/data/4674.csv ---------------------- || City: MIA || # Tracks: 36 ---------------------- Seq : /root/autodl-tmp/TrajectoryPrediction/Argoverse1/argoverse-api/demo_usage_zh/../../forecasting_sample/data/893.csv ---------------------- || City: MIA || # Tracks: 65 ---------------------- -
__str__()[source]Decorator that returns a string storing some stats of the current sequenceReturn type
strReturnsA string storing some stats of the current sequence生成关于当前处理序列的描述性文本,包括序列的关键统计信息
city和track_id_list。def __str__(self) -> str: """Decorator that returns a string storing some stats of the current sequence Returns: A string storing some stats of the current sequence """ return f"""Seq : {self.current_seq} ---------------------- || City: {self.city} || # Tracks: {len(self.track_id_list)} ----------------------""" -
property
agent_trajGet the trajectory for the track of type ‘AGENT’ in the current sequence.Return type
ndarrayReturnsnumpy array of shape (seq_len x 2) for the agent trajectory@property def agent_traj(self) -> np.ndarray: """Get the trajectory for the track of type 'AGENT' in the current sequence. Returns: numpy array of shape (seq_len x 2) for the agent trajectory """ agent_x = self.seq_df[self.seq_df["OBJECT_TYPE"] == "AGENT"]["X"] agent_y = self.seq_df[self.seq_df["OBJECT_TYPE"] == "AGENT"]["Y"] agent_traj = np.column_stack((agent_x, agent_y)) return agent_traj这里面的
@property是一个装饰器,用于将类中的方法转换为属性。这使得你可以对类属性的访问和修改提供控制,通过方法实现逻辑处理,而外部代码则以访问属性的形式进行交互。这里面筛选出 DataFrame 中代理对象
AGENT的所有数据点。这保证了从数据集中只选择与 “AGENT” 相关的行,用np.column_stack((agent_x, agent_y))将agent_x和agent_y合并为一个二维数组,其中第一列是 x 坐标,第二列是 y 坐标。这种结构非常适合表示二维空间中的轨迹点。agent_traj_list=afl.agent_traj agent_traj_listarray([[3874.34248955, 2262.87782753], [3874.75196342, 2263.28835122], [3874.73567177, 2263.23172256], [3875.99990412, 2264.75068299], [3876.44776876, 2265.18167102], ... ])使用MATLAB绘图如下
import matplotlib.pyplot as plt

# 使用 Matplotlib 绘制轨迹
plt.figure(figsize=(10, 6))  # 设置图形的显示大小
plt.plot(agent_traj_list[:, 0], agent_traj_list[:, 1], marker='o', linestyle='-', color='b')  # 绘制线条和点
plt.title('Agent Trajectory')  # 添加标题
plt.xlabel('X Coordinate')  # 添加 x 轴标签
plt.ylabel('Y Coordinate')  # 添加 y 轴标签
plt.grid(True)  # 显示网格
plt.show()  # 显示图形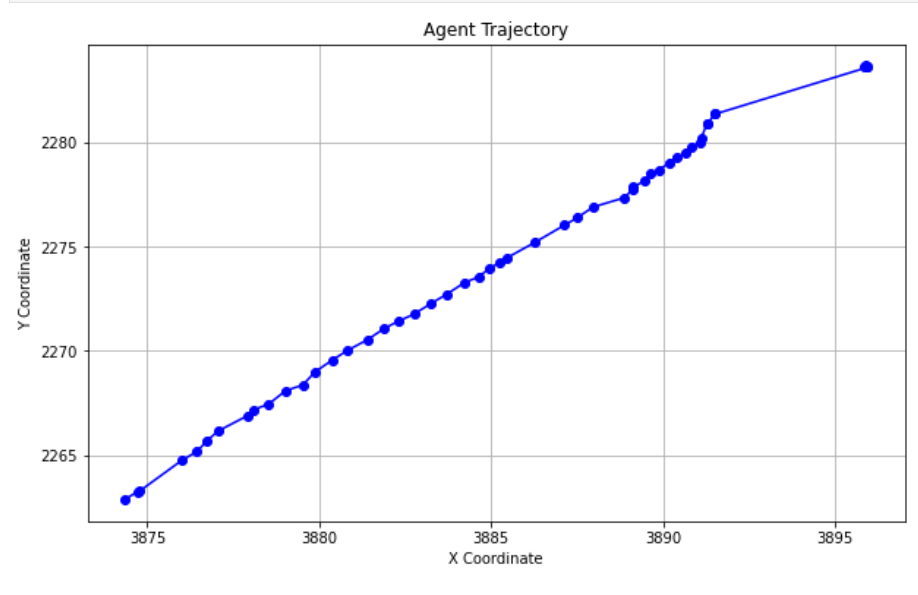
-
property
cityGet the city name for the current sequence.Return type
strReturnscity name, i.e., either ‘PIT’ or ‘MIA’获取当前序列的城市名称,例如 “PIT” 或 “MIA”。
-
get(seq_id)[source]Get the DataLoader object for the given sequence path.Parametersseq_id (
Union[Path,str]) – Fully qualified path to the sequenceReturn typeArgoverseForecastingLoaderReturnsData Loader object for the given sequence path -
property
num_tracksGet the number of tracks in the current sequence.Return type
intReturnsnumber of tracks in the current sequence获取当前序列中的轨迹数量。
@property def num_tracks(self) -> int: """Get the number of tracks in the current sequence. Returns: number of tracks in the current sequence """ return len(self.track_id_list)afl.num_tracks #42这里面是
len(self.track_id_list),而track_id_list执行了np.unique,所以这里并不是seq_df的总长度(seq_df包含同一个物体在不同时间戳下的记录),而是不同物体的总数,具体内容可以看track_id_list -
property
seq_dfGet the dataframe for the current sequence.Return type
DataFrameReturnspandas DataFrame for the current sequence获取当前序列的完整数据
    @property
    def seq_df(self) -> pd.DataFrame:
        """Get the dataframe for the current sequence.

        Returns:
            pandas DataFrame for the current sequence
        """
        return _read_csv(self.current_seq)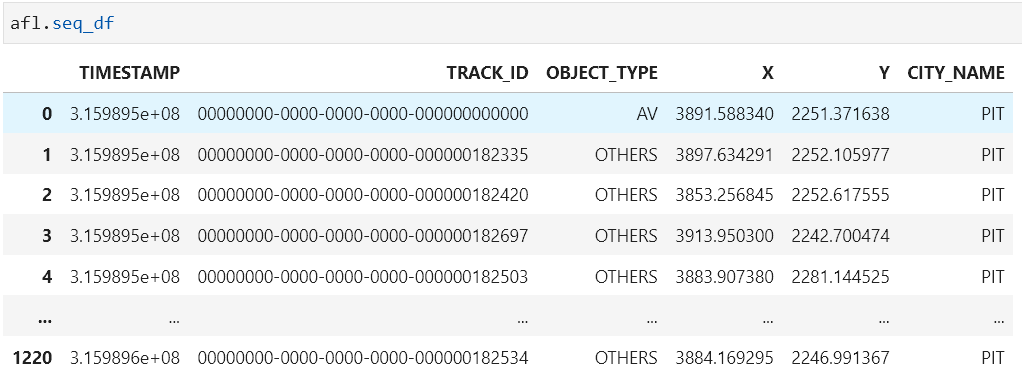
-
property
track_id_listGet the track ids in the current sequence.Return type
Sequence[int]Returnslist of track ids in the current sequence获取当前序列中的轨迹 ID 列表。
    @property
    def track_id_list(self) -> List[int]:
        """Get the track ids in the current sequence.

        Returns:
            list of track ids in the current sequence
        """
        _track_id_list: List[int] = np.unique(self.seq_df["TRACK_ID"].values).tolist()
        return _track_id_list
显示追踪的
track_id列表,注意这里面需要进行np.unique是因为csv中包含多个时间段的记录,但记录的都是同一个物体,我们只需要一个track_id即可。
二、argoverse.visualization.visualize_sequences( viz_sequence )
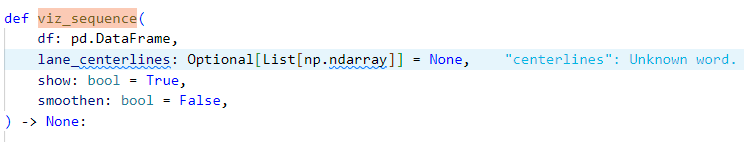
def viz_sequence(
    df: pd.DataFrame,
    lane_centerlines: Optional[List[np.ndarray]] = None,
    show: bool = True,
    smoothen: bool = False,
) -> None:
功能:
该方法用于可视化车辆轨迹数据,并可以选择性地显示车道中心线。可视化的轨迹数据可以进行平滑处理。
参数:
df(pd.DataFrame): 包含轨迹数据的Pandas DataFrame,必须包含 “CITY_NAME”, “X”, “Y”, “TRACK_ID”, 和 “OBJECT_TYPE” 列。lane_centerlines(Optional[List[np.ndarray]]): 可选的车道中心线数据列表。如果为None,则从Argoverse地图API中获取相应城市的车道中心线。show(bool): 是否显示图形。如果为True,则使用plt.show()显示图形。smoothen(bool): 是否对轨迹数据进行平滑处理。如果为True,则调用interpolate_polyline方法进行平滑处理。
实现细节:
- 从输入的DataFrame中提取城市名称,并根据城市名称获取对应的车道中心线(如果未提供)。
- 设置图形的显示范围为轨迹数据的范围。
- 如果未提供车道中心线,则从Argoverse地图API中获取当前城市的车道中心线,并筛选出在轨迹数据范围内的车道中心线进行绘制。
- 遍历轨迹数据,根据轨迹ID和对象类型进行分组并绘制每一组轨迹,使用不同颜色和标记表示不同类型的对象(AGENT, OTHERS, AV)。
- 如果
smoothen参数为True,则对轨迹数据进行插值平滑处理。 - 在图形中添加不同对象类型的图例。
- 如果
show参数为True,则显示图形。
from argoverse.visualization.visualize_sequences import viz_sequence
seq_path = f"{root_dir}/11800.csv"
viz_sequence(afl.get(seq_path).seq_df, show=True)
seq_path = f"{root_dir}/893.csv"
viz_sequence(afl.get(seq_path).seq_df, show=True)
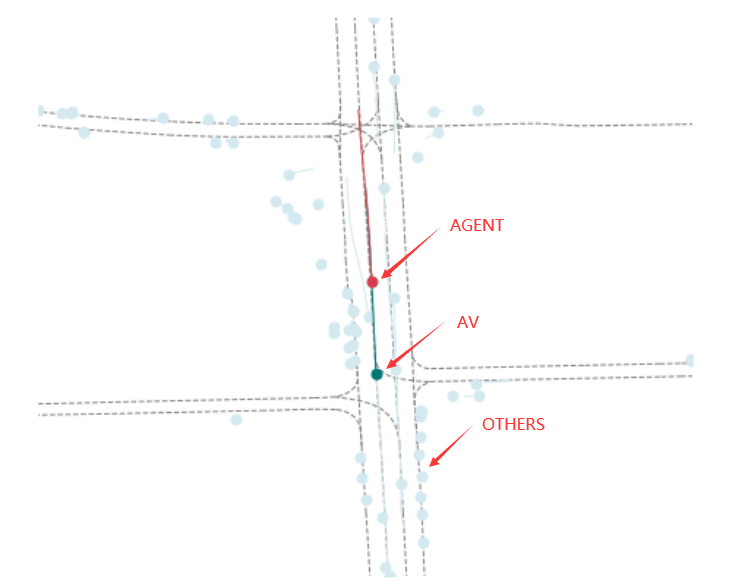
在上述图像中的红色表示AGENT的轨迹,绿色表示的是AV的轨,浅蓝色表示的是OTHERS
color_dict = {"AGENT": "#d33e4c", "OTHERS": "#d3e8ef", "AV": "#007672"}
AV是(Autonomous Vehicle)指的是自动驾驶汽车
三、argoverse.map_representation(map_api)
from argoverse.map_representation.map_api import ArgoverseMap
avm = ArgoverseMap()
obs_len = 20
index = 2
seq_path = afl.seq_list[index]
agent_obs_traj = afl.get(seq_path).agent_traj[:obs_len]
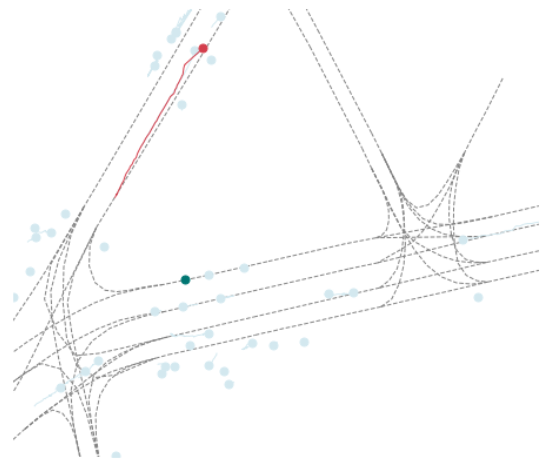
candidate_centerlines = avm.get_candidate_centerlines_for_traj(agent_obs_traj, afl[index].city, viz=True)
index = 3
seq_path = afl.seq_list[index]
agent_obs_traj = afl.get(seq_path).agent_traj[:obs_len]
candidate_centerlines = avm.get_candidate_centerlines_for_traj(agent_obs_traj, afl[index].city, viz=True)
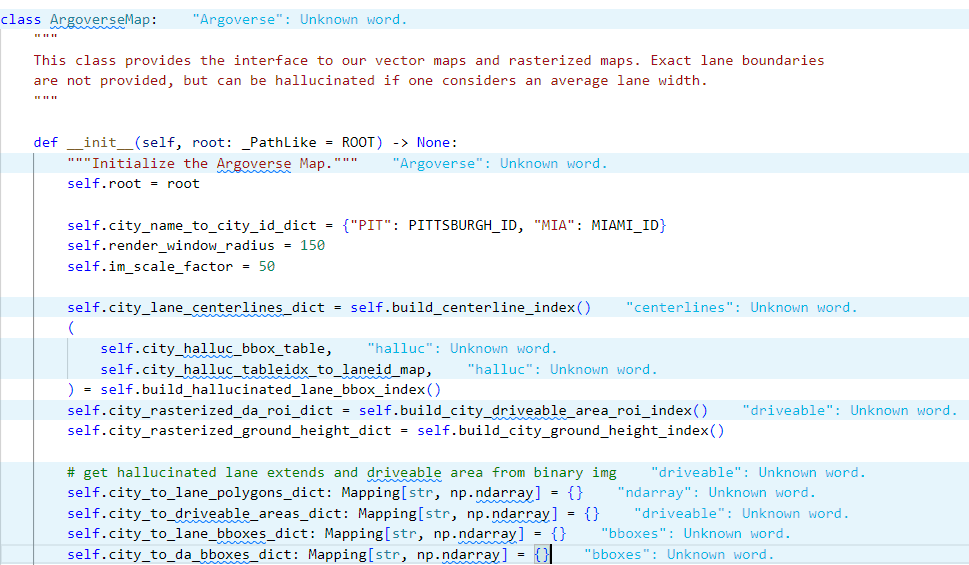
- 城市名称到城市ID的映射
self.city_name_to_city_id_dict = {"PIT": PITTSBURGH_ID, "MIA": MIAMI_ID}
- 渲染窗口半径和图像缩放因子
self.render_window_radius = 150
self.im_scale_factor = 50
-
调用 build_centerline_index 方法
构建一个字典 city_lane_centerlines_dict,用于存储每个城市的车道中心线。
self.city_lane_centerlines_dict = self.build_centerline_index()
构建可行驶区域索引,构建一个字典 city_rasterized_da_roi_dict,用于存储每个城市的可行驶区域。
self.city_rasterized_da_roi_dict = self.build_city_driveable_area_roi_index()
构建地面高度索引,构建一个字典 city_rasterized_ground_height_dict,用于存储每个城市的地面高度数据。
self.city_rasterized_ground_height_dict = self.build_city_ground_height_index()
#功能:初始化四个字典,用于存储每个城市的相关数据。
    self.city_to_lane_polygons_dict #存储每个城市的车道多边形。
    self.city_to_driveable_areas_dict #存储每个城市的可行驶区域。
    self.city_to_lane_bboxes_dict #存储每个城市的车道边界框。
    self.city_to_da_bboxes_dict #存储每个城市的可行驶区域边界框。
#作用:这些字典用于将每个城市的相关数据组织起来,以便后续的快速访问和使用。
这里面使用了seq_list[index],通过读取 root_dir 目录下的文件,生成包含所有序列 CSV 文件路径的列表。
在最后一段代码中
candidate_centerlines = avm.get_candidate_centerlines_for_traj(agent_obs_traj, afl[index].city, viz=True)
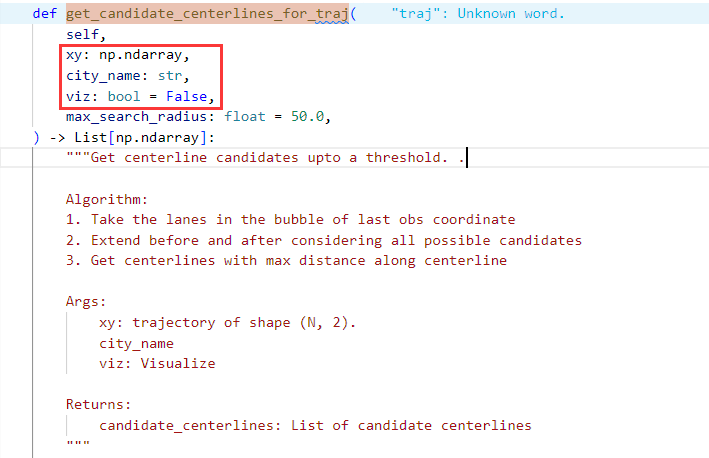
- 初始参数设置和获取初始车道候选:
manhattan_threshold = 2.5
curr_lane_candidates = self.get_lane_ids_in_xy_bbox(xy[-1, 0], xy[-1, 1], city_name, manhattan_threshold)
初始化曼哈顿阈值为 2.5。
获取车辆轨迹最后一个坐标点附近的车道候选(在初始阈值范围内)。
- 扩大搜索半径,直到找到至少一个车道:
while len(curr_lane_candidates) < 1 and manhattan_threshold < max_search_radius:
    manhattan_threshold *= 2
    curr_lane_candidates = self.get_lane_ids_in_xy_bbox(xy[-1, 0], xy[-1, 1], city_name, manhattan_threshold)
如果初始阈值范围内没有找到车道,扩大搜索半径(每次扩大一倍),直到找到至少一个车道或达到最大搜索半径。
- 计算 DFS 阈值:
displacement = np.sqrt((xy[0, 0] - xy[-1, 0]) ** 2 + (xy[0, 1] - xy[-1, 1]) ** 2)
dfs_threshold = displacement * 2.0
计算轨迹的位移(从起点到终点的距离)。设置 DFS(深度优先搜索)阈值为位移的两倍。
- 进行深度优先搜索 (DFS),获取所有候选车道:
obs_pred_lanes: List[List[int]] = []
for lane in curr_lane_candidates:
    candidates_future = self.dfs(lane, city_name, 0, dfs_threshold)
    candidates_past = self.dfs(lane, city_name, 0, dfs_threshold, True)
# Merge past and future
for past_lane_seq in candidates_past:
    for future_lane_seq in candidates_future:
        assert past_lane_seq[-1] == future_lane_seq[0], "Incorrect DFS for candidate lanes past and future"
        obs_pred_lanes.append(past_lane_seq + future_lane_seq[1:])
对每个初始车道候选,进行深度优先搜索,找到所有前序和后继的车道候选。
合并前序和后继车道候选,形成完整的车道序列。
- 去除重叠车道序列:
obs_pred_lanes = remove_overlapping_lane_seq(obs_pred_lanes)
obs_pred_lanes = remove_overlapping_lane_seq(obs_pred_lanes)
- 移除不必要的前序车道:
obs_pred_lanes = self.remove_extended_predecessors(obs_pred_lanes, xy, city_name)
调用 remove_extended_predecessors 方法,移除不必要的前序车道。
- 获取候选车道中心线:
candidate_cl = self.get_cl_from_lane_seq(obs_pred_lanes, city_name)
调用 get_cl_from_lane_seq 方法,从车道序列中获取车道中心线。
- 根据轨迹沿中心线的距离减少候选中心线数量:
candidate_centerlines = filter_candidate_centerlines(xy, candidate_cl)
调用 filter_candidate_centerlines 方法,根据轨迹沿中心线的距离减少候选中心线数量。
- 如果没有候选中心线,选择与轨迹最对齐的中心线:
if len(candidate_centerlines) < 1:
    candidate_centerlines = get_centerlines_most_aligned_with_trajectory(xy, candidate_cl)
如果根据前述标准没有找到候选中心线,调用 get_centerlines_most_aligned_with_trajectory 方法,选择与轨迹最对齐的中心线。
如何推测候选的中心线
manhattan_threshold = 2.5
curr_lane_candidates = self.get_lane_ids_in_xy_bbox(xy[-1, 0], xy[-1, 1], city_name, manhattan_threshold)
根据加载数据的最后一个x和最后一个y的数值进行推测,
def get_lane_ids_in_xy_bbox(
        self,
        query_x: float,
        query_y: float,
        city_name: str,
        query_search_range_manhattan: float = 5.0,
    ) -> List[int]:
        """
        Prune away all lane segments based on Manhattan distance. We vectorize this instead
        of using a for-loop. Get all lane IDs within a bounding box in the xy plane.
        This is a approximation of a bubble search for point-to-polygon distance.

        The bounding boxes of small point clouds (lane centerline waypoints) are precomputed in the map.
        We then can perform an efficient search based on manhattan distance search radius from a
        given 2D query point.

        We pre-assign lane segment IDs to indices inside a big lookup array, with precomputed
        hallucinated lane polygon extents.

        Args:
            query_x: representing x coordinate of xy query location
            query_y: representing y coordinate of xy query location
            city_name: either 'MIA' for Miami or 'PIT' for Pittsburgh
            query_search_range_manhattan: search radius along axes

        Returns:
            lane_ids: lane segment IDs that live within a bubble
        """
        query_min_x = query_x - query_search_range_manhattan
        query_max_x = query_x + query_search_range_manhattan
        query_min_y = query_y - query_search_range_manhattan
        query_max_y = query_y + query_search_range_manhattan

        overlap_indxs = find_all_polygon_bboxes_overlapping_query_bbox(
            self.city_halluc_bbox_table[city_name],
            np.array([query_min_x, query_min_y, query_max_x, query_max_y]),
        )

        if len(overlap_indxs) == 0:
            return []

        neighborhood_lane_ids: List[int] = []
        for overlap_idx in overlap_indxs:
            lane_segment_id = self.city_halluc_tableidx_to_laneid_map[city_name][str(overlap_idx)]
            neighborhood_lane_ids.append(lane_segment_id)

        return neighborhood_lane_ids
-
定义查询点周围的边界框:
query_min_x和query_max_x通过从query_x减去和加上query_search_range_manhattan来确定,这定义了查询点左右两侧的边界。query_min_y和query_max_y通过从query_y减去和加上query_search_range_manhattan来确定,这定义了查询点上下两侧的边界。- 这四个值共同定义了一个查询边界框,用于搜索在这个范围内的车道线段。
-
查找与查询边界框相交的车道线段:
- 使用
find_all_polygon_bboxes_overlapping_query_bbox函数,传入预先存储的每个城市车道线段边界框数据(self.city_halluc_bbox_table[city_name])和查询边界框数组[query_min_x, query_min_y, query_max_x, query_max_y]。 - 此函数返回所有与查询边界框相交的车道线段的索引。
- 使用
-
获取车道线段ID:
- 通过循环遍历找到的相交索引(
overlap_indxs),使用预先定义的映射表self.city_halluc_tableidx_to_laneid_map[city_name]将每个索引转换为相应的车道线段ID。 - 这个映射表将预先计算的车道线段索引映射到具体的车道线段ID,以便可以快速查询。
- 通过循环遍历找到的相交索引(
-
返回结果:
- 如果没有找到任何相交的索引,函数返回空列表[这就表示需要扩大搜索空间,如下所示]。
while len(curr_lane_candidates) < 1 and manhattan_threshold < max_search_radius: manhattan_threshold *= 2 curr_lane_candidates = self.get_lane_ids_in_xy_bbox(xy[-1, 0], xy[-1, 1], city_name, manhattan_threshold)- 如果有相交的索引,函数收集所有相关的车道线段ID并返回这些ID组成的列表。
最后是绘制轨迹坐标的车道方向
index = 2
seq_path = afl.seq_list[index]
agent_traj = afl.get(seq_path).agent_traj
lane_direction = avm.get_lane_direction(agent_traj[0], afl[index].city, visualize=True)
agent_traj[0]表示在最开始的位置进行车道方向绘制
def get_lane_direction(
        self, query_xy_city_coords: np.ndarray, city_name: str, visualize: bool = False
    ) -> Tuple[np.ndarray, float]:
        """
        Get vector direction of the lane you're in.
        We ignore the sparse version of the centerline that we could
        trivially pull from lane_obj['centerline'].

        Args:
            query_xy_city_coords: Numpy array of shape (2,) representing (x,y) position in city coordinates
            city_name: either 'MIA' for Miami or 'PIT' for Pittsburgh
            visualize: to also visualize the result

        Returns:
            lane_dir_vector: Numpy array of shape (2,) representing the direction (as a vector) of the closest
                lane to the provided position in city coordinates
            conf: real-valued confidence. less than 0.85 is almost always unreliable

        We have access to all of the following fields in "lane_obj":
            'centerline', 'predecessor', 'successor', 'turn_direction',
            'is_intersection', 'has_traffic_control'
        """
        cache = self.get_nearest_centerline(query_xy_city_coords, city_name)
        lane_obj, confidence, dense_centerline = cache
        centerline = dense_centerline

        waypoint_dists = np.linalg.norm(centerline - query_xy_city_coords, axis=1)
        closest_waypt_indxs = np.argsort(waypoint_dists)[:2]

        prev_waypoint_id = closest_waypt_indxs.min()
        next_waypoint_id = closest_waypt_indxs.max()

        prev_waypoint = centerline[prev_waypoint_id]
        next_waypoint = centerline[next_waypoint_id]

        lane_dir_vector = next_waypoint - prev_waypoint
        if visualize:
            plt.plot(centerline[:, 0], centerline[:, 1], color="y")
            plt.scatter(
                query_xy_city_coords[0],
                query_xy_city_coords[1],
                200,
                marker=".",
                color="b",
            )
            dx = lane_dir_vector[0] * 10
            dy = lane_dir_vector[1] * 10
            plt.arrow(
                query_xy_city_coords[0],
                query_xy_city_coords[1],
                dx,
                dy,
                color="r",
                width=0.3,
                zorder=2,
            )
            centerline_length = centerline.shape[0]
            for i in range(centerline_length):
                plt.scatter(centerline[i, 0], centerline[i, 1], i / 5.0, marker=".", color="k")
            plt.axis("equal")
            plt.show()
            plt.close("all")

        return lane_dir_vector, confidence
获取最近的车道中心线:
get_nearest_centerline(query_xy_city_coords, city_name)是一个函数调用,它返回与提供的位置(x, y)最接近的车道对象 (lane_obj),以及车道中心线的置信度和密集表示(dense_centerline)。
计算距离并找到最近的两个点:
- 使用
np.linalg.norm(centerline - query_xy_city_coords, axis=1)计算查询点到车道中心线上每个点的欧氏距离。 - 使用
np.argsort(waypoint_dists)[:2]找到距离最近的两个点的索引,这两个点用于确定局部的车道方向。
确定车道方向:
- 根据找到的两个最近点的索引,提取这两个点 (
prev_waypoint和next_waypoint)。 - 计算这两个点的向量差
next_waypoint - prev_waypoint,这个向量表示了这段车道的局部方向。
可视化(如果需要):
- 如果
visualize参数为True,则使用matplotlib.pyplot进行可视化。 - 画出车道中心线、查询点和表示车道方向的箭头。
- 为了增强可视化的信息量,车道上的每个点也用散点图表示,并且点的大小随着索引增加而变大,以显示车道方向。


 609
609


 被折叠的 条评论
为什么被折叠?
被折叠的 条评论
为什么被折叠?
 到【灌水乐园】发言


