


Day4
为什么要学习pandas
那么问题来了:numpy已经能够帮助我们处理数据,能够结合matplotlib解决我们数据分析的问题,那么pandas学习的目的在什么地方呢?
numpy能够帮我们处理处理数值型数据,但是这还不够
很多时候,我们的数据除了数值之外,还有字符串,还有时间序列等
比如:我们通过爬虫获取到了存储在数据库中的数据
比如:之前youtube的例子中除了数值之外还有国家的信息,视频
分类(tag)信息,标题信息等
所以,numpy能够帮助我们处理数值,但是pandas除了处理数值之外(基于numpy),还能够帮助我们处理其他类型的数据
什么是pandas
pandas is an open source, BSD-licensed library providing high-performance, easy-to-use data structures and data analysis tools for the Python programming language.
pandas的常用数据类型
- Series 一维,带标签数组
2. DataFrame 二维,Series容器
pandas之Series创建

【示例】
| #coding=utf-8 |
结果:
a 1
b 2
c 31
d 12
e 3
f 4
dtype: int64 <class 'pandas.core.series.Series'>
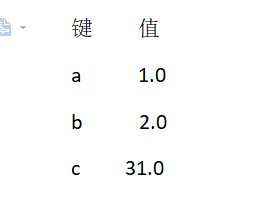
键 值
a 1.0
b 2.0
c 31.0
d 12.0
e 3.0
f 4.0
dtype: float64 float64

| #coding=utf-8
|
结果:
name xiaohong
age 30
tel 10086
dtype: object object
age 30
tel 10086
dtype: object
xiaohong
取前三行
name xiaohong
age 30
dtype: object
age 30
tel 10086
dtype: object
pandas之Series切片和索引

因为t中没有’g’,所以得到nan

pandas之Series的索引和值
对于一个陌生的series类型,我们如何知道他的索引和具体的值呢?

Series对象本质上由两个数组构成
一个数组构成对象的键(index, 索引),一个数字构成对象的值(values),键-->值
ndarray的很多方法都可以运用于series类型,比如argmax,clip
series具有where方法,但是结果和ndarray不同
【示例】where
| s = pd.Series(range(5)) #不大于1,则变为10 |
结果:
0 0
1 1
2 2
3 3
4 4
dtype: int64
0 NaN
1 1.0
2 2.0
3 3.0
4 4.0
dtype: float64
0 10
1 10
2 2
3 3
4 4
dtype: int64
【示例】索引操作
| #coding=utf-8
print(t3.index) |
结果:
Index(['name', 'age', 'tel'], dtype='object')
<class 'pandas.core.indexes.base.Index'>
3
['name', 'age']
【示例】values操作
| #coding=utf-8 temp_dict = {"name":"xiaohong","age":30,"tel":10086} #values操作 |
结果:
['xiaohong' 30 10086] <class 'numpy.ndarray'>
pandas之读取外部数据
现在假设我们有一个组关于狗的名字的统计数据,那么为了观察这组数据的情况,我们应该怎么做呢?

【示例】pandas读取csv文件
| #coding=utf-8 |
结果:
Row_Labels Count_AnimalName
0 1 1
1 2 2
2 40804 1
3 90201 1
4 90203 1
... ... ...
16215 37916 1
16216 38282 1
16217 38583 1
16218 38948 1
16219 39743 1
[16220 rows x 2 columns]
我们的这组数据存在csv中,我们直接使用pd. read_csv即可
和我们想象的有些差别,我们以为他会是一个Series类型,但是他是一个DataFrame,那么接下来我们就来了解这种数据类型
但是,还有一个问题:
对于数据库比如mysql中数据我们如何使用呢?
pd.read_sql(sql_sentence,connection)
pandas之DataFrame(二维)

DataFrame对象既有行索引,又有列索引
行索引,表明不同行,横向索引,叫index,0轴,axis=0
列索引,表名不同列,纵向索引,叫columns,1轴,axis=1
DataFrame

ndarray: N 维数组对象 ndarray,它是一系列同类型数据的集合,以 0 下标为开始进行集合中元素的索引。
【示例】
| #coding=utf-8 |
结果:
W X Y Z
a 0 1 2 3
b 4 5 6 7
c 8 9 10 11

那么问题来了:
1.DataFrame和Series有什么关系呢?
DataFrame中某一行或某一列(一维)就是Series,DataFrame是Series的容器
2.Series能够传入字典,那么DataFrame能够传入字典作为数据么?
【示例】
| #coding=utf-8 |
结果:
name age tel
0 xiaoming 20 10086
1 xiaogang 32 10010
name age tel
0 xiaohong 32.0 10010.0
1 xiaogang NaN 10011.0
2 xiaowang 22.0 NaN
3.对于一个dataframe类型,既有行索引,又有列索引,我们能够对他做什么操作呢
和一个ndarray一样,我们通过shape,ndim,dtype了解这个ndarray的基本信息,那么对于DataFrame我们有什么方法了解呢

【示例】
| #coding=utf-8 |
结果:
name age tel
0 xiaohong 32.0 10010.0
1 xiaogang NaN 10011.0
2 xiaowang 22.0 NaN
RangeIndex(start=0, stop=3, step=1)
Index(['name', 'age', 'tel'], dtype='object')
[['xiaohong' 32.0 10010.0]
['xiaogang' nan 10011.0]
['xiaowang' 22.0 nan]]
(3, 3)
name object
age float64
tel float64
dtype: object
2
练习:
那么回到之前我们读取的狗名字统计的数据上,我们尝试一下刚刚的方法
那么问题来了:
很多同学肯定想知道使用次数最高的前几个名字是什么呢?
df.sort_values(by="Count_AnimalName",ascending=False)
【操作】
| #coding=utf-8 |
结果:
Row_Labels Count_AnimalName
1156 BELLA 1195
9140 MAX 1153
2660 CHARLIE 856
3251 COCO 852
12368 ROCKY 823
那么问题又来了:
如果我的数据有10列,我想按照其中的第1,第3,第8列排序,怎么办?(看ipythpn的帮助文档)
pandas之取行或者列
刚刚我们知道了如何给数据按照某一行或者列排序,那么现在我们想单独研究使用次数前100的数据,应该如何做?
df_sorted = df.sort_values(by="Count_AnimalName")
df_sorted[:100]
那么问题来了:
我们具体要选择某一列该怎么选择呢?df[" Count_AnimalName "]
我们要同时选择行和列该怎么办?df[:100][" Count_AnimalName "]
【操作】
| #coding=utf-8 #dataFrame中排序的方法 print('-----------------') |
Row_Labels Count_AnimalName
1156 BELLA 1195
9140 MAX 1153
2660 CHARLIE 856
3251 COCO 852
12368 ROCKY 823
8417 LOLA 795
8552 LUCKY 723
8560 LUCY 710
-----------------
1156 BELLA
9140 MAX
2660 CHARLIE
3251 COCO
12368 ROCKY
8417 LOLA
8552 LUCKY
8560 LUCY
Name: Row_Labels, dtype: object
pandas之loc
还有更多的经过pandas优化过的选择方式:
1.df.loc 通过标签(字符串)索引行数据
2.df.iloc 通过位置获取行数据
df.loc

df.iloc

赋值更改数据的过程

pandas之布尔索引
回到之前狗的名字的问题上,假如我们想找到所有的使用次数超过800的狗的名字,应该怎么选择?

回到之前狗的名字的问题上,假如我们想找到所有的使用次数超过700并且名字的字符串的长度大于4的狗的名字,应该怎么选择?


【示例】找到次数700-800之间的
| #coding=utf-8 |
结果:
Row_Labels Count_AnimalName
8417 LOLA 795
8552 LUCKY 723
8560 LUCY 710
pandas之字符串方法

缺失数据的处理
观察下面这组数据

我们的数据缺失通常有两种情况:
一种就是空,None等,在pandas是NaN(和np.nan一样)
另一种是我们让其为0,蓝色框中
对于NaN的数据,在numpy中我们是如何处理的?
在pandas中我们处理起来非常容易
判断数据是否为NaN:pd.isnull(df),pd.notnull(df)
处理方式1:删除NaN所在的行列dropna (axis=0, how='any', inplace=False)
(how=‘all’是整行全部为nan时才删除)
处理方式2:填充数据,t.fillna(t.mean()),t.fiallna(t.median()),t.fillna(0)
处理为0的数据:t[t==0]=np.nan
当然并不是每次为0的数据都需要处理
计算平均值等情况,nan是不参与计算的,但是0会
【示例】
| #coding=utf-8 #填充nan print(t2) |
结果:
0 1 2 3
0 0 NaN 2 3
1 4 5.0 6 7
2 8 9.0 10 11
0 1 2 3
0 False True False False
1 False False False False
2 False False False False
0 1 2 3
1 4 5.0 6 7
2 8 9.0 10 11
0 1 2 3
0 0 7.0 2 3
1 4 5.0 6 7
2 8 9.0 10 11
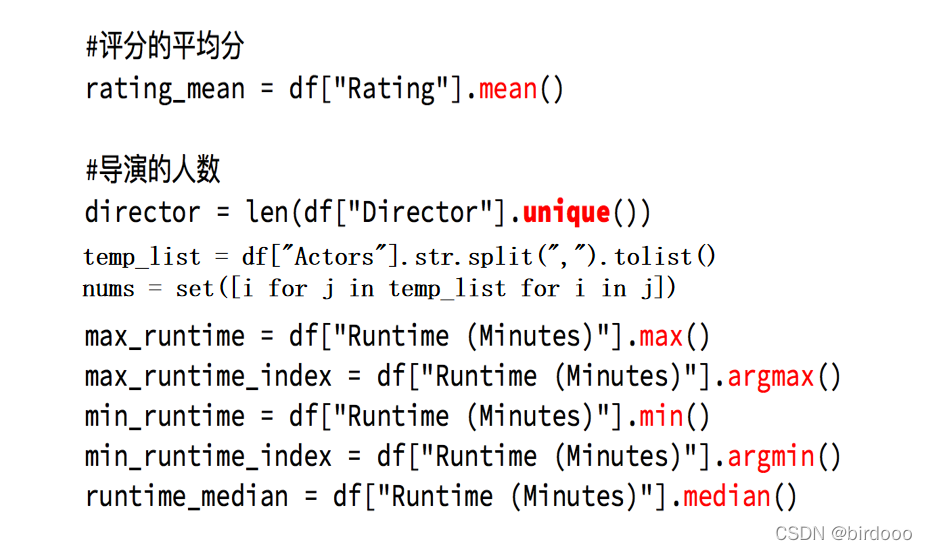
pandas常用统计方法
假设现在我们有一组从2006年到2016年1000部最流行的电影数据,我们想知道这些电影数据中评分的平均分,导演的人数等信息,我们应该怎么获取?
【操作】
| #coding=utf-8 |
结果:
<class 'pandas.core.frame.DataFrame'>
RangeIndex: 1000 entries, 0 to 999
Data columns (total 12 columns):
# Column Non-Null Count Dtype
--- ------ -------------- -----
0 Rank 1000 non-null int64
1 Title 1000 non-null object
2 Genre 1000 non-null object
3 Description 1000 non-null object
4 Director 1000 non-null object
5 Actors 1000 non-null object
6 Year 1000 non-null int64
7 Runtime (Minutes) 1000 non-null int64
8 Rating 1000 non-null float64
9 Votes 1000 non-null int64
10 Revenue (Millions) 872 non-null float64
11 Metascore 936 non-null float64
dtypes: float64(3), int64(4), object(5)
memory usage: 93.9+ KB
None
Rank Title ... Revenue (Millions) Metascore
0 1 Guardians of the Galaxy ... 333.13 76.0
[1 rows x 12 columns]
平均评分: 6.723200000000003
演员人数 2394
练习:
对于这一组电影数据,如果我们想rating,runtime的分布情况,应该如何呈现数据?(连续数据的统计,使用直方图)
【操作】Runtime
| #coding=utf-8 |
结果:


 1143
1143


 被折叠的 条评论
为什么被折叠?
被折叠的 条评论
为什么被折叠?
 到【灌水乐园】发言


