
极客时间和极客学院

In today’s edition of Geek School, we look at the tools we can use to monitor the performance and reliability of our computers.
在今天的Geek School版本中,我们介绍了可用于监视计算机性能和可靠性的工具。
Be sure to check out the previous articles in this Geek School series on Windows 7:
请务必查看Windows 7上此Geek School系列中的先前文章:
And stay tuned for the rest of the series all this week.
并继续关注本周剩余的系列节目。
事件记录 (Event Logs)
Event logs are special files that record significant events on your computer, such as when a user logs on to your computer or when a program crashes. Event logs are very useful tools when you are troubleshooting an issue with your computer. You can use the Windows Event Viewer to read event logs, however you will need to be administrator on the machine in order to do so.
事件日志是特殊文件,用于记录计算机上的重要事件,例如,当用户登录到计算机或程序崩溃时。 当您对计算机问题进行故障排除时,事件日志是非常有用的工具。 您可以使用Windows事件查看器读取事件日志,但是您需要成为计算机的管理员才能这样做。
打开事件查看器 (Opening the Event Viewer)
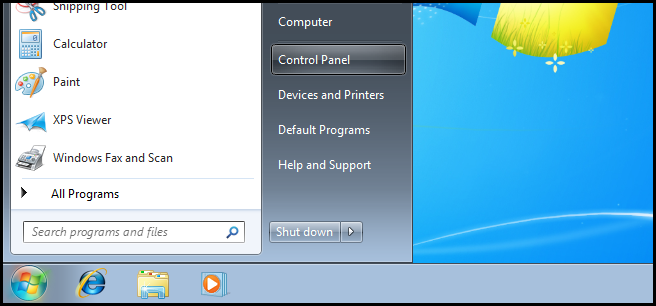
To open the Event viewer, click on Start and launch the Control Panel.
要打开事件查看器,请单击开始并启动控制面板。
Then head into the System and Security section.
然后进入“系统和安全性”部分。

Here you will want to click on Administrative Tools.
在这里,您将要单击管理工具。
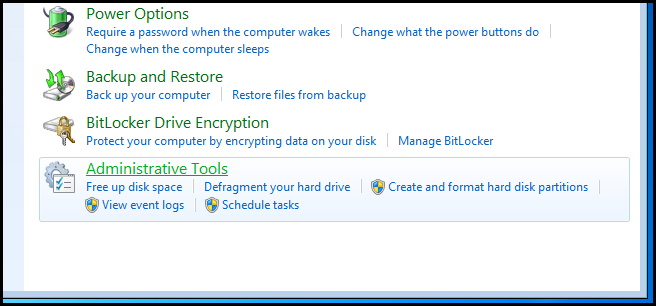
You can then open it by clicking on the Event Viewer shortcut.
然后,您可以通过单击事件查看器快捷方式将其打开。

That’s all there is to it.
这里的所有都是它的。
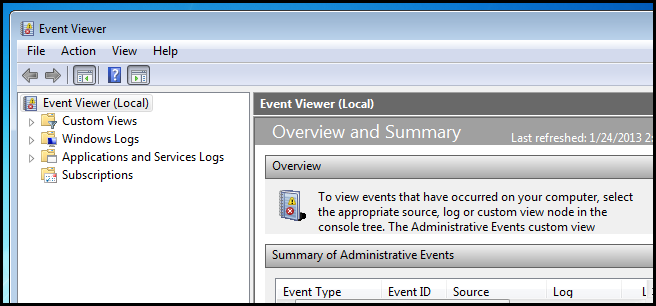
The Event Viewer displays events in several different logs. Windows Logs include:
事件查看器在几个不同的日志中显示事件。 Windows日志包括:
The Application Log – The application log contains events logged by programs, for example it might be able to tell you why a particular program crashed.
应用程序日志 –应用程序日志包含程序记录的事件,例如,它可能能够告诉您特定程序崩溃的原因。
The Security Log – The security log records events such as valid and invalid logon attempts, as well as events related to resource use, such as the creating, opening, or deleting of files.
安全日志 –安全日志记录诸如有效和无效的登录尝试之类的事件,以及与资源使用相关的事件,例如文件的创建,打开或删除。
The Setup Log – The setup log records events that add, remove or update a Windows feature. For example an entry is logged every time you install a Windows Update.
安装日志 –安装日志记录添加,删除或更新Windows功能的事件。 例如,每次您安装Windows Update时都会记录一个条目。
The System Log – The system log contains events logged by Windows system components. For example, if a driver fails to load during startup, an event is recorded in the system log.
系统日志–系统日志包含Windows系统组件记录的事件。 例如,如果驱动程序在启动期间无法加载,则会在系统日志中记录一个事件。
To view one of the Windows Logs, simply expand the Windows Logs Console Tree item and select the log you want to view.
要查看Windows日志之一,只需展开Windows日志控制台树项,然后选择要查看的日志。
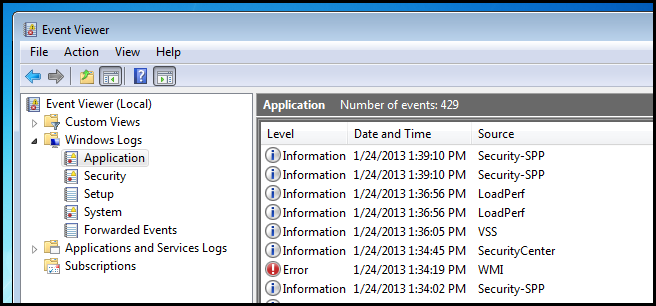
One the right hand side you can see all the events that the log contains. There are three kinds of events:
您可以在右侧查看日志包含的所有事件。 共有三种事件:
Errors – Indicated by the nasty red exclamation mark, errors indicate that there has been a fatal problem, such as a loss of data.
错误 -由令人讨厌的红色感叹号指示的错误表明存在致命问题,例如数据丢失。
Warning – Indicated by the yellow exclamation mark, warnings indicate that there has been a problem but the program can continue to function. They also serve as a notice that futures errors could occur.
警告 –黄色惊叹号表示警告,表示存在问题,但程序可以继续运行。 它们还用作可能发生期货错误的通知。
Information – Indicated by the white exclamation mark, information events describe the successful operation of a program, driver, or service.
信息 –用白色感叹号指示,信息事件描述程序,驱动程序或服务的成功操作。
Note: The security log doesn’t use the above event levels and rather uses security audits.
注意:安全日志不使用上述事件级别,而是使用安全审核。
过滤日志 (Filtering Logs)
Event logs contain thousands of events, and finding the information you need can sometimes be tricky. Provided you know what you are looking for, you can always use a log filter to filter out all the irrelevant information. Let’s look at how we can use the Event Viewer to find out how long it takes our computer to start up. The first thing you will need to do is open the Application and Service logs, then drill down into Microsoft and then Windows.
事件日志包含数以千计的事件,有时找到所需的信息可能很棘手。 只要您知道要查找的内容,就可以始终使用日志过滤器过滤掉所有不相关的信息。 让我们看一下如何使用事件查看器找出计算机启动需要多长时间。 您需要做的第一件事是打开“应用程序和服务”日志,然后依次深入到Microsoft和Windows。
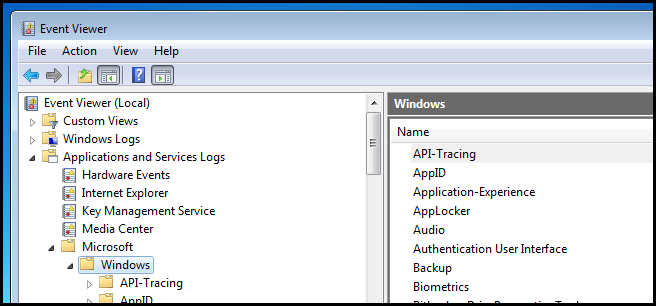
Then find the Diagnostics-Performance folder and filter its Operational log file.
然后找到Diagnostics-Performance文件夹并过滤其“操作日志”文件。
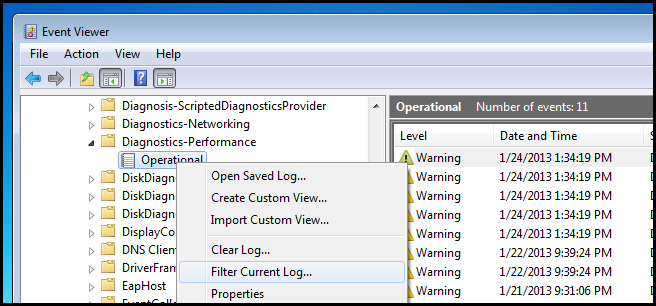
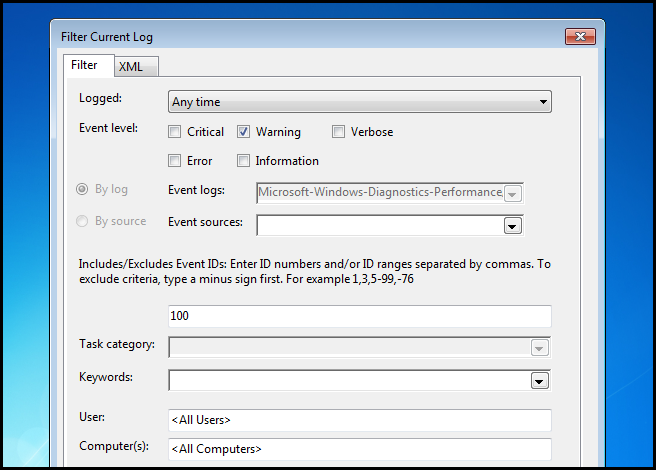
Now create a filter for all Warning level events that have an Event ID of 100.
现在为事件ID为100的所有警告级别事件创建一个过滤器。
Note: I only happen to know this information because I have needed to use it before. You should focus on how you would create a filter, not that the boot up event has an Event ID of 100.
注意:我只是碰巧知道此信息,因为我以前需要使用它 。 您应该专注于如何创建过滤器,而不是启动事件的事件ID为100。
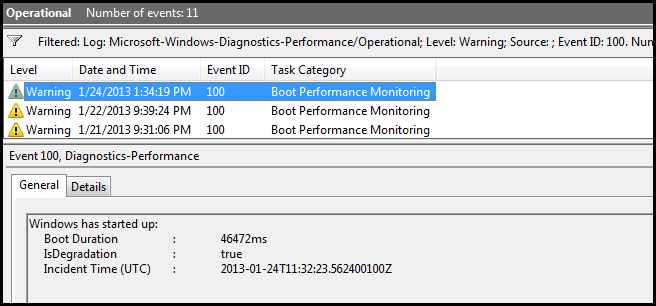
Once you click OK, you should only see warning level events.
单击“确定”后,您应该只看到警告级别的事件。

If you select one of the results and look at its contents you will see your boot time in milliseconds.
如果选择其中一个结果并查看其内容,则将看到启动时间(以毫秒为单位)。
创建自定义视图 (Creating a Custom View)
If you know that every day you are going to connect to a server and apply a custom filter to view specific events, you might want to consider creating a custom view which allows you to create your own pre-filtered log files. Creating a new custom view is exactly the same as creating a new filter: just right click on the log and select Create Custom View from the context menu.
如果您知道每天都要连接到服务器并应用自定义过滤器来查看特定事件,则可能需要考虑创建一个自定义视图,该视图允许您创建自己的预先过滤的日志文件。 创建新的自定义视图与创建新的过滤器完全相同:只需右键单击日志,然后从上下文菜单中选择“创建自定义视图”。
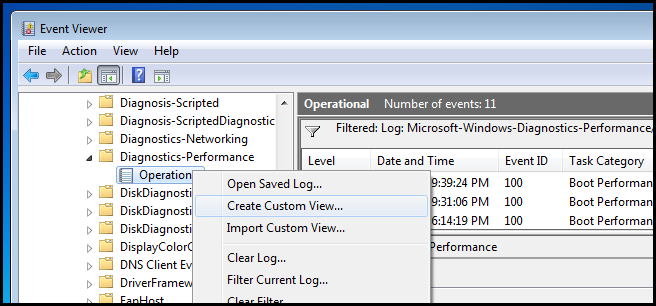
Then choose a filtering criteria. We will again go for warning level events with an event ID of 100.
然后选择一个过滤条件。 我们将再次使用事件ID为100的警告级别事件。

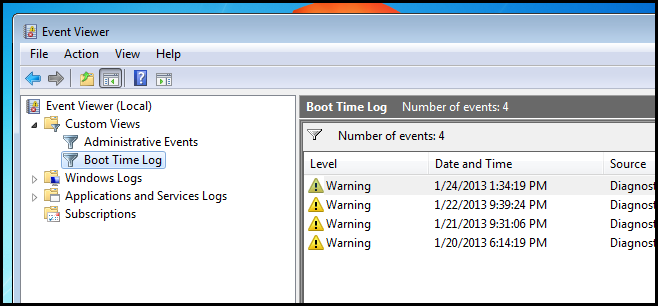
Then give your new custom view a name and click OK.
然后为新的自定义视图命名,然后单击“确定”。

Now you will have a nice, pre-filtered log.
现在,您将拥有一个不错的,预先过滤的日志。
限制日志文件的大小 (Limiting the Size of Your Log Files)
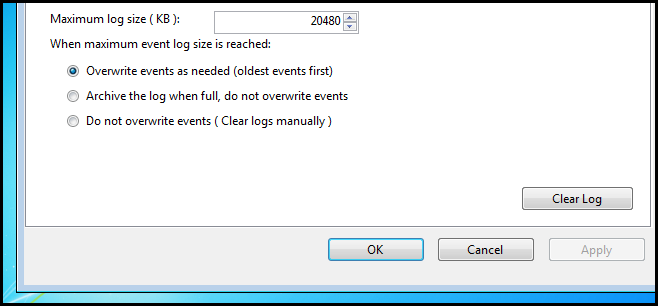
If you need to control the size of the log files you can do so by right-clicking on a log selecting properties.
如果需要控制日志文件的大小,可以通过右键单击日志并选择属性来进行控制。

Here you can change the size of the log file in KB, the default is 20MB.
您可以在此处更改以KB为单位的日志文件的大小,默认值为20MB。
Note: The default is fine for most purposes.
注意:默认值适用于大多数用途。
资源监控器 (Resource Monitor)
The Windows 7 Resource Monitor provides a quick summary of overall CPU, disk, network and memory utilization in one easy to use interface. You can think of it as a more detailed version of Task Manager.
Windows 7资源监视器在一个易于使用的界面中提供了有关CPU,磁盘,网络和内存总体利用率的快速摘要。 您可以将其视为任务管理器的更详细版本。
To open resource monitor, press the Win + R keyboard combination to open a run box, then type resmon and press enter.
要打开资源监视器,请按Win + R键盘组合以打开运行框,然后键入resmon并按Enter。

The default windows will appear with the Overview tab displayed. In the Overview tab, you can see the four monitored resources – CPU, disk, network and memory.
将显示默认窗口,并显示“概述”选项卡。 在“概述”选项卡中,您可以查看四个受监视的资源– CPU,磁盘,网络和内存。
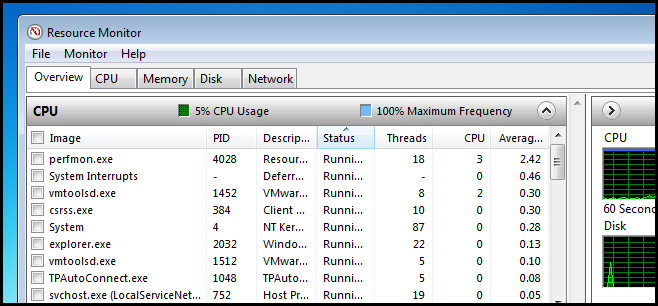
The resource monitor is very useful for those times when your computer is running slow all of the sudden.
对于计算机突然突然变慢的那些时间,资源监视器非常有用。
可靠性监控器 (Reliability Monitor)
Reliability Monitor is an advanced tool that measures hardware and software problems and other changes to your computer. To open the reliability monitor, press the Win + R keyboard combination to open a run box, then type perfmon /rel and press enter.
可靠性监视器是一种高级工具,可以测量硬件和软件问题以及计算机的其他更改。 要打开可靠性监视器,请按Win + R键盘组合打开运行框,然后键入perfmon / rel并按Enter。

You will be greeted with a large graph displaying the overall reliability of your system over the last week or so. You are given a system stability rating on a scale of 1 to 10, with 1 being the worst and 10 the best.
您将看到一个大图,它显示了过去一周左右的时间,系统的整体可靠性。 系统稳定度等级为1到10,其中1为最差,10为最佳。
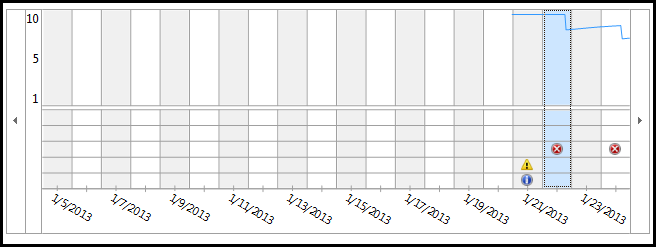
As time goes by you will notice the rating gets lower and lower on my machine, but you will also notice that there are two errors on the chart. To view the errors that occurred, simply select the day.
随着时间的流逝,您会注意到我的机器上的额定值越来越低,但是您也会注意到图表上有两个错误。 要查看发生的错误,只需选择日期。
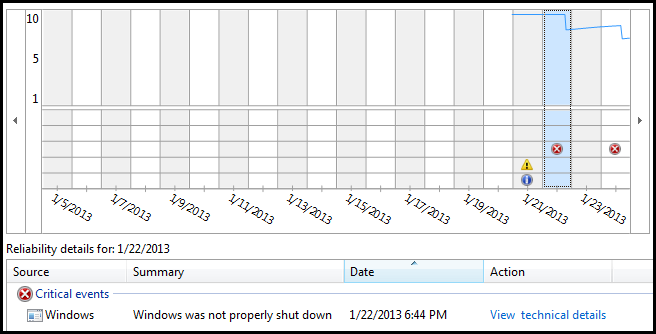
In the above screenshot, you will see a critical event, logged due to power outage, significantly reduced the reliability of my system. It looks like there was another error earlier today. Let’s check it out as well.
在上面的屏幕截图中,您将看到由于停电而记录的严重事件,大大降低了系统的可靠性。 看来今天早些时候还有另一个错误。 我们也来检查一下。
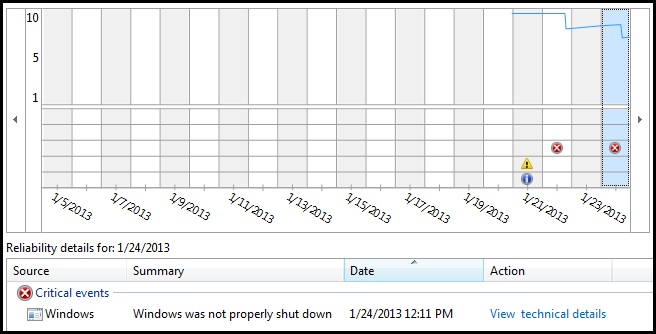
It looks like another power outage. Looks like I need to invest in a UPS unit. As you can see the reliability monitor can be extremely useful for tracking trends in system behavior.
看来又是一次停电。 看来我需要投资UPS部门。 如您所见,可靠性监视器对于跟踪系统行为的趋势非常有用。
性能监控器 (Performance Monitor)
The Windows Performance Monitor allows you to measure the performance of a local or a remote computer on the network, both in real time and by collecting log data for later analysis.
Windows Performance Monitor允许您实时或通过收集日志数据以供以后分析来测量网络上本地或远程计算机的性能。
打开性能监视器 (Opening the Performance Monitor)
To open the Performance Monitor, press the Win + R keyboard combination to open the run dialog, then type perfmon then hit enter.
要打开性能监视器,请按Win + R键盘组合打开运行对话框,然后键入perfmon,然后按Enter。

Once the MMC console opens, expand the Monitoring Tools item in the Console Tree and select Performance Monitor.
MMC控制台打开后,在控制台树中展开“监视工具”项,然后选择“性能监视器”。
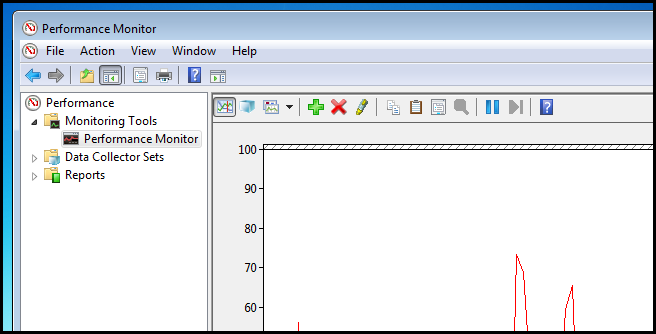
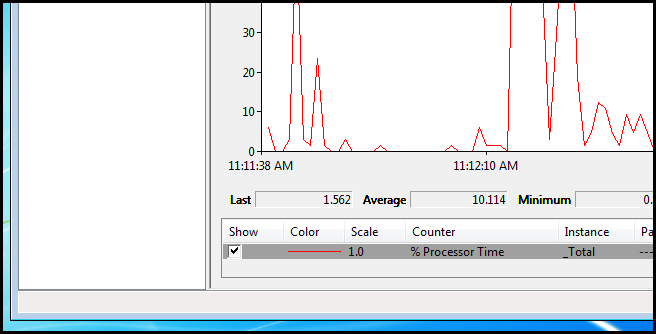
One of the great things about the performance monitor is that it allows you to graphically view real time performance information. It does this by the use of performance counters. Performance counters are measurements of how something is performing at a given time, and performance counters can either be included in the operating system or as part of an application. One example of a what a performance counter could measure is how much time the CPU spends responding to system requests, as seen below.
性能监视器的一大优点是,它允许您以图形方式查看实时性能信息。 它通过使用性能计数器来做到这一点。 性能计数器是对给定时间某事物的执行情况的度量,性能计数器既可以包含在操作系统中,也可以包含在应用程序中。 性能计数器可以衡量的一个示例是CPU花费多少时间来响应系统请求,如下所示。
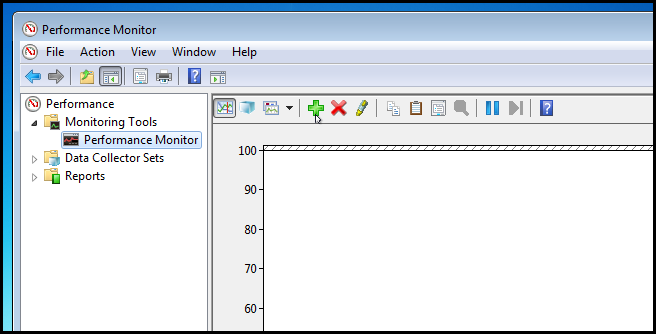
To add a performance counter, simply click on the green add button.
要添加性能计数器,只需单击绿色的添加按钮。
Then choose the performance counters you want to add by selecting them and clicking the add button.
然后通过选择要添加的性能计数器并单击添加按钮来选择它们。

There are literally thousands of counters, but the ones I added above are the most important to remember for the exam. Here’s a brief explanation of each one:
实际上有成千上万的计数器,但是我在上面添加的那些对于考试来说是最重要的。 以下是对每个选项的简要说明:
处理器 (Processor)
The following performance counters are useful for troubleshooting CPU issues and are available under the Processor section:
以下性能计数器对于解决CPU问题很有用,并且在“处理器”部分下可用:
% Processor Time: This shows you how much time that the CPU spends responding to system requests.
%Processor Time :显示您的CPU用于响应系统请求的时间。
Interrupts/sec: This measures the average number of hardware interrupts received by the processor each second.
中断/秒:测量处理器每秒接收到的平均硬件中断数。
记忆 (Memory)
The following performance counters are useful for troubleshooting memory issues and are available under the Memory section:
以下性能计数器对于解决内存问题很有用,并且在“内存”部分下可用:
Available MBytes: This measures the amount of memory that is available to run processes on the computer.
Available MBytes(可用兆字节) :此度量可用于运行计算机上的进程的内存量。
Pages/sec: This shows you the number of hard faults per second. Hard faults are page faults that require disk access.
Pages / sec : 每秒显示的硬故障数。 硬故障是需要磁盘访问的页面故障。
物理磁盘 (Physical Disk)
The following performance counters are useful for troubleshooting physical disk constraints and are available under the PhysicalDisk section:
以下性能计数器对于解决物理磁盘限制很有用,并且在“ PhysicalDisk”部分下可用:
% Disk Time: This measures the amount of time the disk is busy because it is servicing read or write requests.
%Disk Time(磁盘时间百分比) :它测量磁盘因正在处理读取或写入请求而繁忙的时间。
Current Disk Queue Length: This shows you the number of outstanding disk requests that are waiting to be processed.
当前磁盘队列长度 :这显示了等待处理的未完成磁盘请求的数量。
逻辑磁盘 (Logical Disk)
The following performance counter is useful for troubleshooting logical disk constraints and is available under the LogicalDisk section:
以下性能计数器对于排除逻辑磁盘约束很有用,并且在LogicalDisk部分下可用:
% Free Space: This shows you how much free disk space is available.
%可用空间 :这将显示可用的可用磁盘空间。
网络接口 (Network Interface)
The following performance counter is useful for troubleshooting network issues and is available under the NetworkInterface section:
以下性能计数器对于解决网络问题很有用,可在NetworkInterface部分中找到:
Bytes Total/sec: This shows you the total number of bytes sent and received from your network interface across all protocols.
总字节数/秒 :这显示了所有协议中从网络接口发送和接收的字节总数。
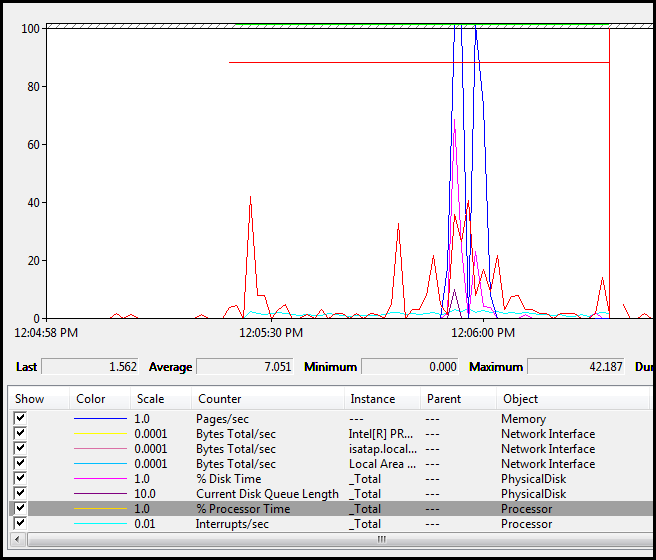
Once you have added all your counters you can see all your data in real time.
添加完所有计数器后,您可以实时查看所有数据。
保持Windows最新 (Keeping Windows Up to Date)
The one exception to my “if it’s not broken don’t fix it” rule is installing Windows Updates. There are two ways you can update Windows:
我的“如果未损坏,请不要修复”规则的一个例外是安装Windows Update。 有两种更新Windows的方法:
Using the Internet –When you buy a new Windows 7 PC it is configured in such a way that if you choose to enable Windows Updates the updates themselves will be downloaded from the Microsoft servers when its time to install them.
使用Internet –购买新的Windows 7 PC时,其配置方式如下:如果选择启用Windows Updates,则将在安装时从Microsoft服务器下载更新本身。
As opposed to what, you might ask? The answer is as opposed to using Windows Server Update Services (WSUS).
与什么相反,您可能会问? 答案与使用Windows Server Update Services(WSUS)相反。
WSUS – When you use WSUS, you have a central server that downloads all the updates for your entire company, for all Microsoft products, not just Windows. When it is time for your client computers to install updates, instead of 30,000 computers connecting to the internet to download the same files, they all connect to the WSUS server and install the updates using your network’s local bandwidth. As you can imagine this saves massive amounts of bandwidth as the updates are only downloaded once.
WSUS –使用WSUS时,您有一台中央服务器,可以下载整个公司,所有Microsoft产品的所有更新,而不仅仅是Windows。 是时候让客户端计算机安装更新了,而不是将30,000台计算机连接到Internet下载相同的文件,而是它们都连接到WSUS服务器并使用网络的本地带宽安装更新。 您可以想象,由于更新仅下载一次,因此可以节省大量带宽。
更改从何处获取更新 (Changing Where You Get Your Updates From)
While setting up a WSUS server is out of scope of the exam objectives, you certainly need to know how to set up a Windows 7 client to use a WSUS server. Normally, you will have at least at least ten clients by the time you are using WSUS, so it is best done through a GPO. So go ahead and press the Win + R keyboard combination to bring up a run dialog, then type gpedit.msc and press enter.
虽然设置WSUS服务器超出了考试目标的范围,但是您当然需要知道如何设置Windows 7客户端以使用WSUS服务器。 通常,到使用WSUS时,至少会有至少十个客户端,因此最好通过GPO进行。 因此,继续并按Win + R键盘组合以打开运行对话框,然后键入gpedit.msc并按Enter。
Note: Remember that we are setting up a GPO on one Windows 7 client. Usually this is done on a central server and linked to an OU that contains the machines in your organization so that you don’t have to go around to each machine and tell them to use WSUS.
注意:请记住,我们正在一个Windows 7客户端上设置GPO。 通常,这是在中央服务器上完成的,并链接到包含组织中计算机的OU,因此您不必四处浏览每台计算机并告诉他们使用WSUS。

Then drill down to:
然后深入到:
Computer Configuration\Administrative Templates\Windows Components\Windows Update
计算机配置\管理模板\ Windows组件\ Windows更新
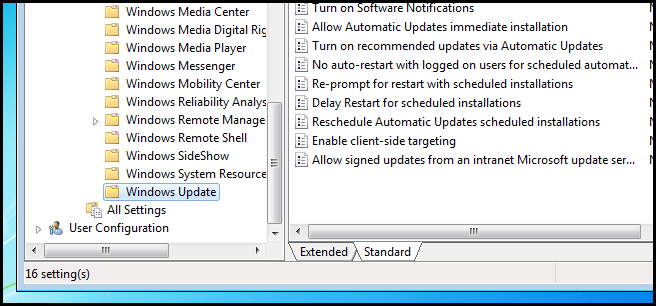
Then double click on the “Specify intranet Microsoft update service location” setting on the right hand side.
然后双击右侧的“指定Intranet Microsoft更新服务位置”设置。
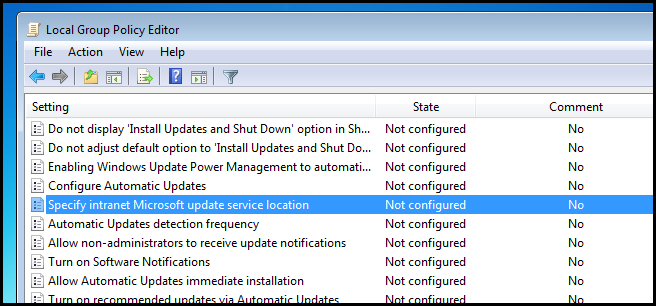
Then you will need to enable the policy and enter in the URI of the WSUS server.
然后,您将需要启用策略并输入WSUS服务器的URI。

That’s all there is to it.
这里的所有都是它的。
更改Windows更新设置 (Changing Windows Update Settings)
Note: If you are using WSUS, you are likely to edit these setting through Group Policy, rather than on each client as shown below.
注意:如果使用的是WSUS,则可能通过组策略而不是如下所示在每个客户端上编辑这些设置。
Open the Start Menu and click on the Windows Update item.
打开开始菜单,然后单击Windows Update项。

Here you will see a Change settings link on the left hand side.
在这里,您会在左侧看到“更改设置”链接。
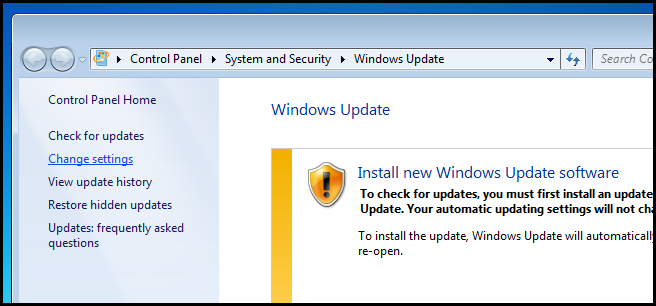
From this centralized location you can change nearly every aspect of Windows Updates.
从此集中位置,您几乎可以更改Windows Update的各个方面。

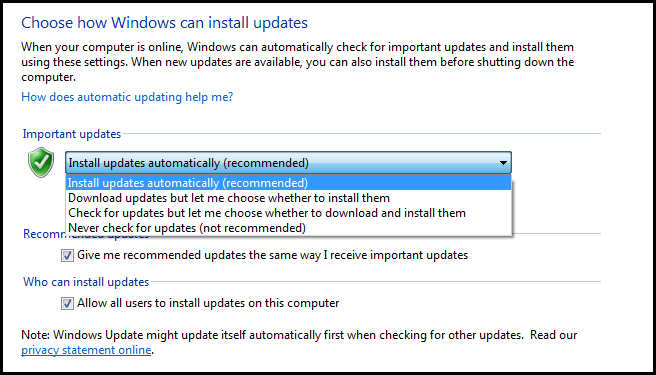
One thing to be aware of is that you can change the Windows Update behavior using the drop down list.
要注意的一件事是,您可以使用下拉列表更改Windows Update行为。
摘要 (Summary)
It has been a long one so here’s a short summary:
它已经很长了,所以这里是一个简短的摘要:
- The Windows Event Viewer allows you to view log files which contain important information about events that have occurred on your PC. Windows事件查看器允许您查看日志文件,其中包含有关PC上已发生事件的重要信息。
- Resource Monitor is a more verbose version of Task Manager that allows us to view detailed information about what is currently happening on your machine. 资源监视器是任务管理器的更详细的版本,它使我们可以查看有关计算机上当前正在发生的事情的详细信息。
- The Reliability Monitor allows you to easily identify trends that are reducing the reliability of your PC. 可靠性监视器可让您轻松识别降低PC可靠性的趋势。
- The Windows Performance Monitor allows you to view custom performance information in real time as well as view performance data that has been tracked over a period of time. Windows Performance Monitor允许您实时查看自定义性能信息以及查看一段时间内跟踪的性能数据。
- Windows Updates allow your PC to stay up to date with the latest security patches. While you might use the out-the-box Windows Update configuration in very small businesses, WSUS and Group Policy are the way to go. Windows Update使您的PC可以保持最新的安全补丁程序。 尽管您可能在非常小的企业中使用开箱即用的Windows Update配置,但是WSUS和组策略是解决之道。
家庭作业 (Homework)
- Learn about and set up event subscriptions using two Windows 7 virtual machines. 了解和使用两个Windows 7虚拟机设置事件订阅。
- Learn how to use Data Collector Sets to track performance information over time using the Performance Monitor. 了解如何使用数据收集器集通过性能监视器跟踪一段时间内的性能信息。
In addition to today’s homework, you should read the following posts and get familiar with the little tips and tricks you can use to improve your computer’s performance. These are also part of the exam objectives.
除了今天的作业外,您还应该阅读以下文章,并熟悉可用于提高计算机性能的一些小技巧。 这些也是考试目标的一部分。
Learn how to improve your computer’s performance using ReadyBoost.
Learn how you can evaluate your computers power efficiency using powercfg
If you have any questions you can tweet me @taybgibb, or just leave a comment.
如果您有任何疑问,可以发给我@taybgibb ,或发表评论。
极客时间和极客学院


 1832
1832

 被折叠的 条评论
为什么被折叠?


