


最近用到了β分布,需要理解一下β分布的原理
1.Beta分布
参考:直观理解β分布
2.python 绘图
画图工具源码:https://github.com/technojoe9982/Beta-Distribution-Plotter
画PDF(Probability Density Function)的关键代码段(截取自上述链接的源码):
def plot_pdf(x_range, a, b, **kwargs):
    #this is a function which plots the beta probability desnity function

    #axises are cleared so when you want to draw a plot with new values you don't have multiple lines
    axs[0].cla()
    #here we plot text which shows the outcomes which are being plotted, done for clarity
    goodOutcomes = "Good outcomes: " + str(a-1)
    badOutcomes = "Bad outcomes: " + str(b-1)
    axs[0].text(0.01, 0.95, goodOutcomes, transform=axs[0].transAxes, fontsize=10)
    axs[0].text(0.01, 0.87, badOutcomes, transform=axs[0].transAxes, fontsize=10)

    #labels are re-wrriten as the axis have just been cleared
    axs[0].set_ylabel('Probability Density')
    axs[0].set_xlabel('Probability')
    x = x_range
    #array of y values are calculated using the betapdf function
    y = ss.beta.pdf(x, a, b)
    #plotting the array of x and y values, takes in extra arguements so it's easy to adjust properties of the line
    axs[0].plot(x, y, **kwargs)
    plt.show()
关键代码段的调用:
import numpy as np
import matplotlib.pyplot as plt
import scipy.stats as ss
import PySimpleGUI as sg
x = np.linspace(0, 1, 5000)
plot_pdf(x, a, b,  color='red', lw=2, ls='-', alpha=0.7)
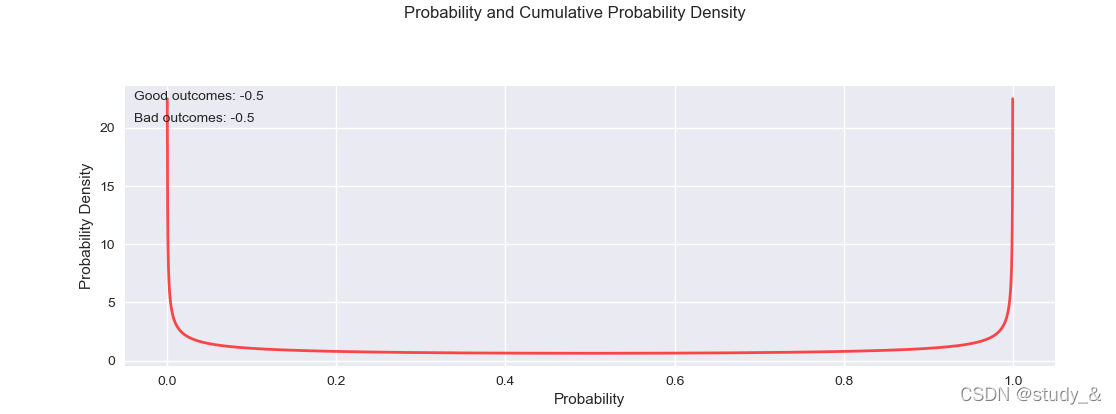
a=0.5,b=0.5
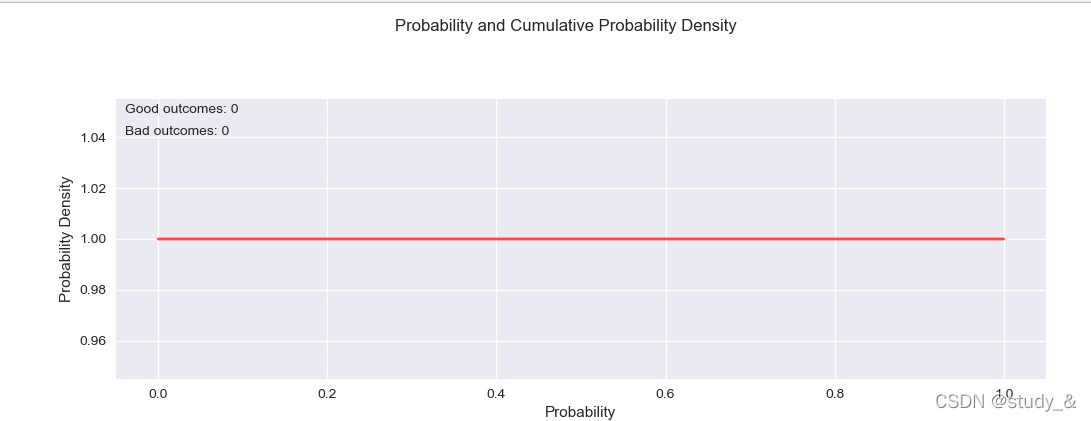
a=1,b=1
(此时β分布等于均匀分布)
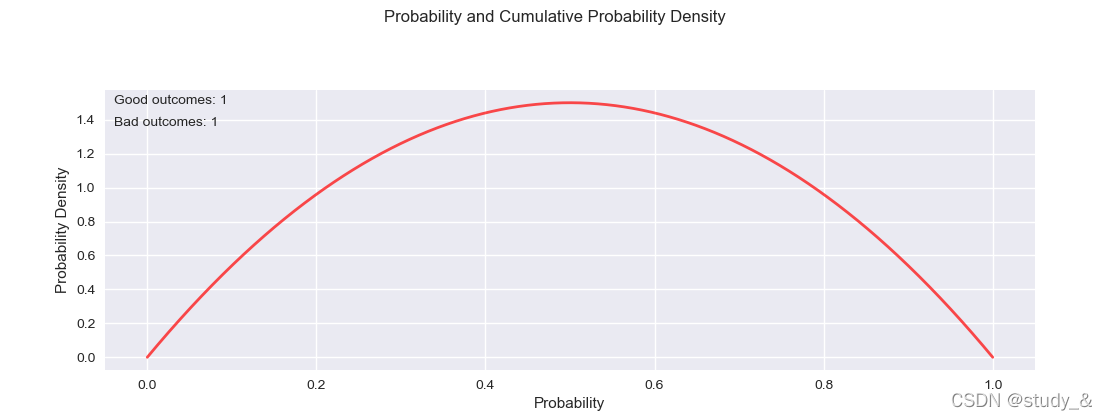
a=2,b=2
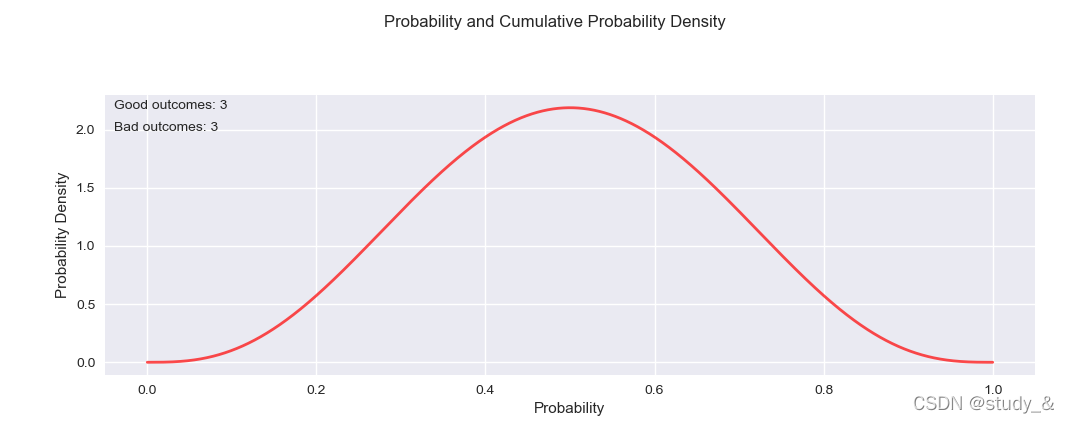
a=4,b=4


 1211
1211

 被折叠的 条评论
为什么被折叠?
被折叠的 条评论
为什么被折叠?
 到【灌水乐园】发言


