


整理了一下几种滤波方法,对其原理也不甚清楚,还请大家指教。
1.Butterworth滤波器
from scipy import signal
sample_fre = 1
lv_frequency =1/12
highcut = 2*lv_frequency/sample_fre
b, a = signal.butter(8, highcut, 'lowpass')
nino_butter = signal.filtfilt(b, a, nino1)
其中,sample_fre为样本频率,lv_frequency为要过滤的频率,8为滤波器阶数,highcut为临界频率,通过样本频率和要过滤的频率计算得到,‘lowpass’表示滤波器类型,表示滤去高于此频率的波,还可以设置为‘highpass’、‘bandpass’、‘bandstop’。nino1为要滤波的数据。
2. savgol_filter滤波
from scipy.signal import savgol_filter
y_smooth=savgol_filter(nino1,13,3)
其中nino1为要滤波的数据,13为window_length,越大滤波越厉害,只能为正奇整数,3为阶数,表示对窗口内数据进行3阶多项式拟合,小于window_length。
3.平滑
import numpy as np
a=np.repeat(1/9,9)
len1=len(nino1)
yy=np.convolve(nino1,a,mode='full')
其中nino1为要滤波的数据,9和1/9表示滑动长度为9,每个点的权重是等权重的1/9。mode表示序列两端的处理方式,可以选为‘full’、‘same’、‘valid’。
平滑效果对比
通过以上三种方法平滑后,看画图效果
ax1.plot(x, nino1, 'tab:grey', alpha=1, linewidth=1,label='nino')
ax1.set_title('origin nino',fontsize=fs,x=0.03,y=0.85)

ax2.plot(x, nino_butter, 'tab:blue', alpha=1, linewidth=2,label='butterworth')
ax2.set_title('butterworth',fontsize=fs,x=0.03,y=0.85)

ax3.plot(x, y_smooth, 'tab:green', alpha=1, linewidth=2,label='savgol_filter')
ax3.set_title('savgol_filter',fontsize=fs,x=0.03,y=0.85)

ax4.plot(time2, yy, 'tab:orange', alpha=1, linewidth=2,label='convolve')
ax4.set_title('pinghua',fontsize=fs,x=0.03,y=0.85)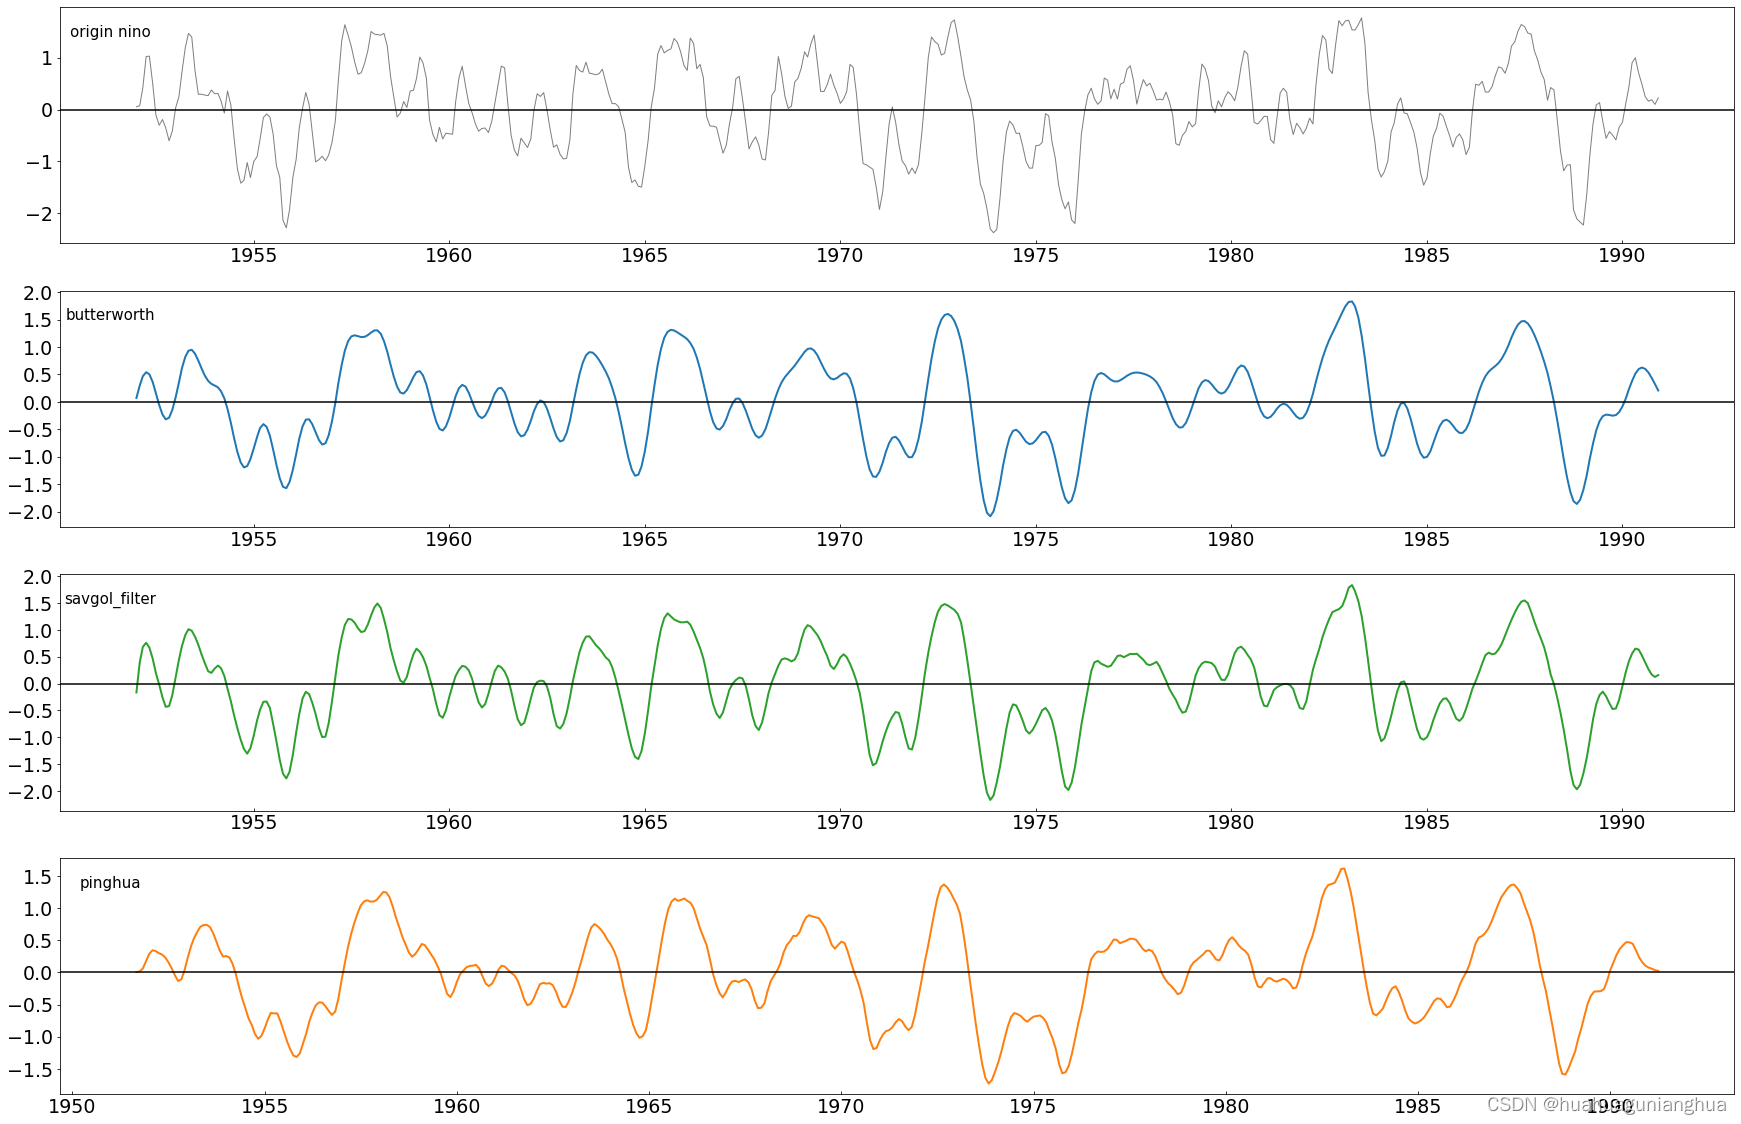
参考链接:https://blog.csdn.net/weixin_42782150/article/details/107176500


 266
266

 被折叠的 条评论
为什么被折叠?
被折叠的 条评论
为什么被折叠?
 到【灌水乐园】发言


