


安装
install.packages("cowplot")
# or
remotes::install_github("wilkelab/cowplot")
参考文档
https://www.rdocumentation.org/packages/cowplot/versions/1.1.1 ⇐ R documentation
https://wilkelab.org/cowplot/articles/introduction.html ⇐ introduction
https://wilkelab.org/cowplot/reference/index.html ⇐ function reference
Function reference
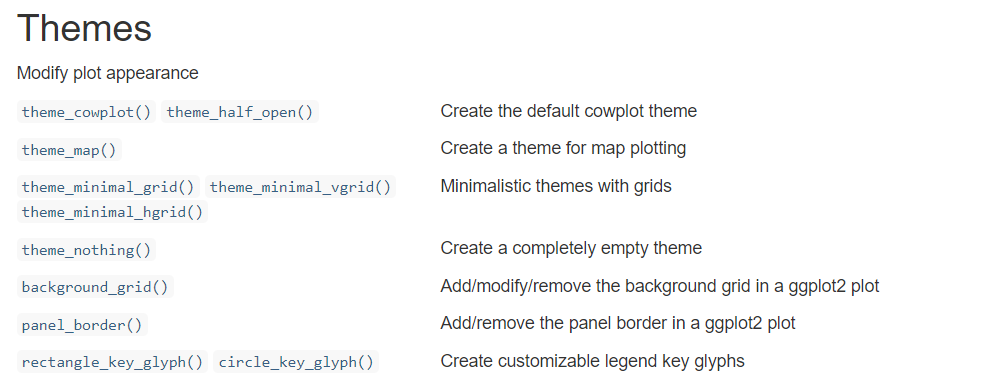
Theme function
- 制造像 ggplot2’s theme_classic()一样的主题
library(ggplot2)
library(cowplot)

# classic cowplot theme
ggplot(iris, aes(Sepal.Length, Sepal.Width, color = Species)) +
  geom_point() +
  theme_cowplot(12)

- 其他的主题
# minimal grid theme
ggplot(iris, aes(Sepal.Length, Sepal.Width, color = Species)) +
  geom_point() +
  theme_minimal_grid(12)

# minimal horizontal grid theme
ggplot(iris, aes(Sepal.Length, fill = Species)) +
  geom_density(alpha = 0.5) +
  scale_y_continuous(expand = expansion(mult = c(0, 0.05))) +
  theme_minimal_hgrid(12)

- 参考主题
Arranging plots or 组图
p1 <- ggplot(mtcars, aes(disp, mpg)) +
  geom_point()
p2 <- ggplot(mtcars, aes(qsec, mpg)) +
  geom_point()

plot_grid(p1, p2, labels = c('A', 'B'), label_size = 12)

# 参考文档:https://wilkelab.org/cowplot/reference/plot_grid.html

图片对齐
library(cowplot)
df <- data.frame(
  x = 1:10, y1 = 1:10, y2 = (1:10)^2, y3 = (1:10)^3
)

p1 <- ggplot(df, aes(x, y1)) + geom_point() + theme(axis.text.y = element_text(size = 14))
p3 <- ggplot(df, aes(x, y3)) + geom_point() + theme(axis.text.y = element_text(size = 28))

plot_grid(p1,p3,ncol=1)

# 当你 使用align参数时,plot_grid会调用 align_plots函数,最终使得图片的某个坐标轴对齐
plot_grid(p1,p3,ncol=1,axis = "lr",align = "hv")

- 手动使图片对齐
p1 <- ggplot(mpg, aes(manufacturer, hwy)) + stat_summary(fun="median", geom = "bar") +
  theme_half_open() +
  theme(axis.text.x = element_text(angle = 45, hjust = 1, vjust= 1))
p2 <- ggplot(mpg, aes(manufacturer, displ)) + geom_point(color="red") +
scale_y_continuous(position = "right") +
  theme_half_open() + theme(axis.text.x = element_blank())

plot_grid(p1,p2,ncol = 1)

# manually align and plot on top of each other
aligned_plots <- align_plots(p1, p2, align="hv", axis="tblr")

# Note: In most cases two y-axes should not be used, but this example
# illustrates how one could accomplish it.
ggdraw(aligned_plots[[1]]) + draw_plot(aligned_plots[[2]])

图中图
p <- ggplot(mtcars, aes(disp, mpg)) +
  geom_point(size = 1.5, color = "blue") +
  theme_cowplot(12)

logo_file <- system.file("extdata", "logo.png", package = "cowplot")

# ggdraw() takes a snapshot of the plot and places it at full size into a new drawing canvas
# draw_image() then draws an image on top of the plot
ggdraw(p) +
  draw_image(logo_file, x = 1, y = 1, hjust = 1, vjust = 1, width = 0.13, height = 0.2)

# ggdraw  & draw_image &  draw_plot 的组合顺序不同会有不同的效果
#   ggdraw()  first setting up an empty drawing canvas
#  draw_image  then drawing the image
#  draw_plot(p)  and then drawing the plot on top
ggdraw() +
  draw_image(logo_file, scale = 0.5) +
  draw_plot(p)


 681
681


 被折叠的 条评论
为什么被折叠?
被折叠的 条评论
为什么被折叠?
 到【灌水乐园】发言


