


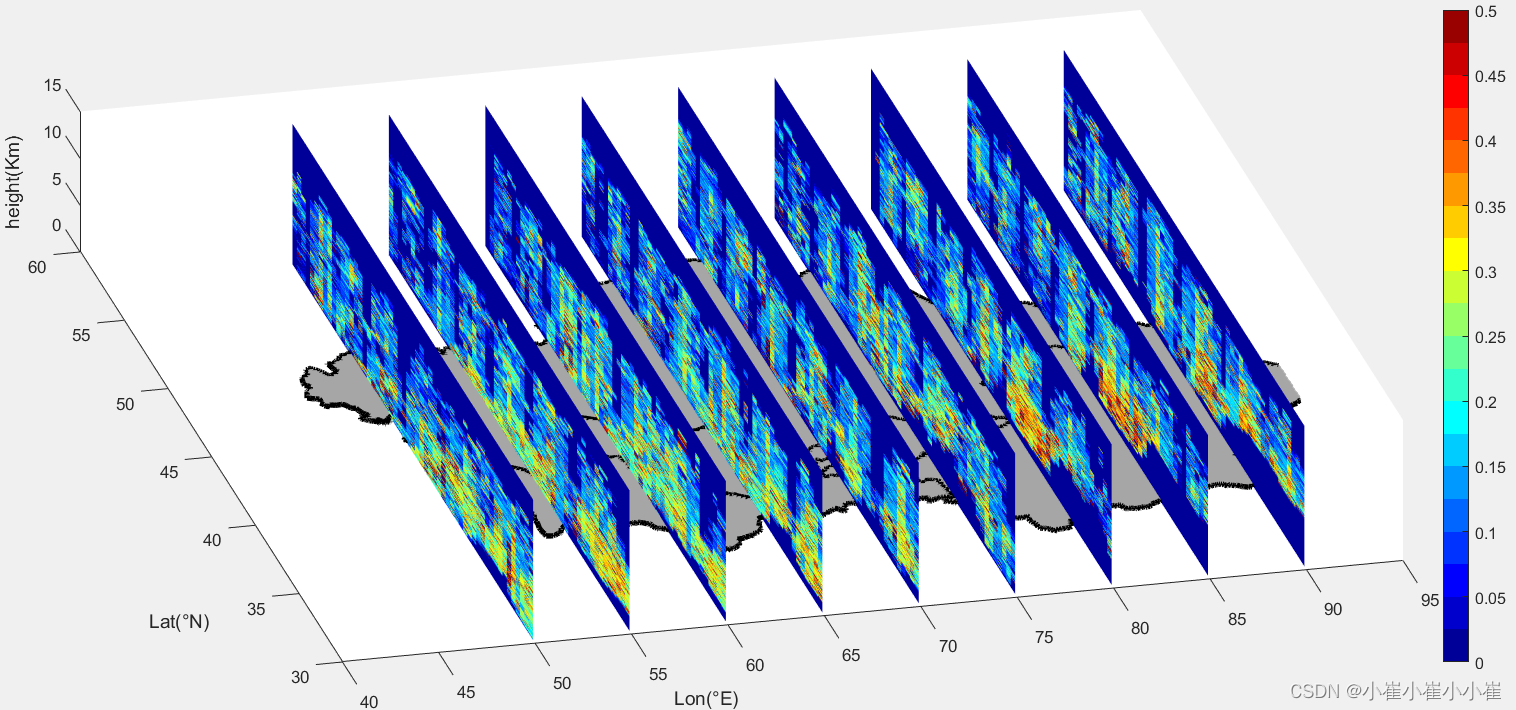
Calipso三维可视化 [matlab]
接上一篇博文,对calipso光学参数进行长时间统计后得到三维空间分布的结果,对该结果进行可视化处理。
测试数据下载
clear all;
clc;
load('E:\alts.mat');
load('E:\spring_pdr.mat');
lonst = -180;
loned = 180;
latst = -90;
lated = 90;
lon = lonst+0.25:0.5:loned-0.25;
lat = latst+0.25:0.5:lated-0.25;
[x,y,z] = meshgrid(lon(361:720),lat(181:360),double(alts));
tt = squeeze(result_pdr(181:360,361:720,:));
%%
[lon_1,lat_1] = meshgrid((40:0.1:100),fliplr(30:0.1:60));
[lon_2,lat_2] = meshgrid((40:0.1:100),fliplr(30:0.1:60));
[nl,ns] = size(lat_1);
%%
map = shaperead('E:\zyxj1.shp');
bou2_x = [map(:).X];
bou2_y = [map(:).Y];
mask = nan(nl,ns);
for l=1:length(map)
    inshp = inpolygon(lon_2,lat_2,map(l).X,map(l).Y);
    mask(inshp==1) = 1;
end
lon_1 = lon_1.*mask;
lat_1 = lat_1.*mask;
lon_s = reshape(lon_1,nl*ns,1);
lat_s = reshape(lat_1,nl*ns,1);
%%
figure(1);
set(gcf,'position',[0,0,1800,800]);
%%
scatter(lon_s,lat_s,6,...
    [0.65 0.65 0.65],'filled');
hold on;
plot(bou2_x,bou2_y,'-k','LineWidth',4);
hold on;
%%
h = slice(x,y,z,tt,[50 55 60 65 70 75 80 85 90 85 100 105 110 115 120],[],[]);       % [30,33,36,39,42,45,48],z方向分成4分
shading flat;                              % 图像平滑
colorbar                                   % 颜色条
colormap(jet(20))                          % 颜色属性
caxis([0,0.5]);
zlim([0,15]);
xlim([40,95]);
ylim([30,60]);
view([-13.9 71.6]);
xlabel('Lon(°E)', 'fontsize', 13);
ylabel('Lat(°N)', 'fontsize', 13);
zlabel('height(Km)', 'fontsize', 13);
set(gca,'fontsize',13);


 2898
2898


 被折叠的 条评论
为什么被折叠?
被折叠的 条评论
为什么被折叠?
 到【灌水乐园】发言


