


1、matplotlibcpp
matplotlibcpp包,是一个利用C++实现的调用Python接口和Matplotlib实现绘图的工具包。github网址。
2、环境
配置python需要的环境
sudo apt-get install python3-dev
3、使用
在CmakeList.txt中添加
find_package(PythonLibs REQUIRED)
include_directories(
        ${PYTHON_INCLUDE_DIRS}
)
target_link_libraries(${PROJ_NAME}
        ${PYTHON_LIBRARIES}
)
并且将matplotlibcpp.h 文件添加到头文件目录即可。
4、例子
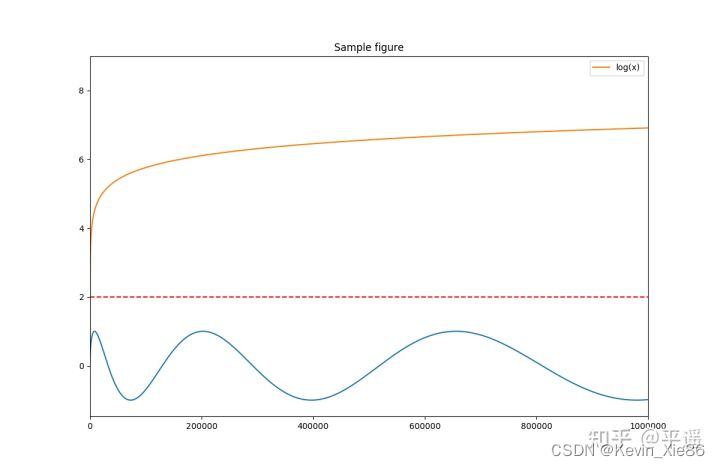
4.1 例子1
#include "matplotlibcpp.h"
#include <cmath>

namespace plt = matplotlibcpp;

int main()
{
    // Prepare data.
    int n = 5000;
    std::vector<double> x(n), y(n), z(n), w(n,2);
    for(int i=0; i<n; ++i) {
        x.at(i) = i*i;
        y.at(i) = sin(2*M_PI*i/360.0);
        z.at(i) = log(i);
    }

    // Set the size of output image to 1200x780 pixels
    plt::figure_size(1200, 780);
    // Plot line from given x and y data. Color is selected automatically.
    plt::plot(x, y);
    // Plot a red dashed line from given x and y data.
    plt::plot(x, w,"r--");
    // Plot a line whose name will show up as "log(x)" in the legend.
    plt::named_plot("log(x)", x, z);
    // Set x-axis to interval [0,1000000]
    plt::xlim(0, 1000*1000);
    // Add graph title
    plt::title("Sample figure");
    // Enable legend.
    plt::legend();
    // Save the image (file format is determined by the extension)
    plt::save("./basic.png");
}
图像会保存下来,没有显示,需要plt.show()才会显示图像。
4.2 例子2 动态显示图片
#define _USE_MATH_DEFINES
#include <cmath>
#include "../matplotlibcpp.h"

namespace plt = matplotlibcpp;

int main()
{
	int n = 1000;
	std::vector<double> x, y, z;

	for(int i=0; i<n; i++) {
		x.push_back(i*i);
		y.push_back(sin(2*M_PI*i/360.0));
		z.push_back(log(i));

		if (i % 10 == 0) {
			// Clear previous plot
			plt::clf();
			// Plot line from given x and y data. Color is selected automatically.
			plt::plot(x, y);
			// Plot a line whose name will show up as "log(x)" in the legend.
			plt::named_plot("log(x)", x, z);

			// Set x-axis to interval [0,1000000]
			plt::xlim(0, n*n);

			// Add graph title
			plt::title("Sample figure");
			// Enable legend.
			plt::legend();
			// Display plot continuously
			plt::pause(0.01);
		}
	}
}
 注意:这个画图会占用线程,如果想边执行程序边画图,最好开多线程,否则程序会卡在画图这,不会往后执行。


 1万+
1万+


 被折叠的 条评论
为什么被折叠?
被折叠的 条评论
为什么被折叠?
 到【灌水乐园】发言


