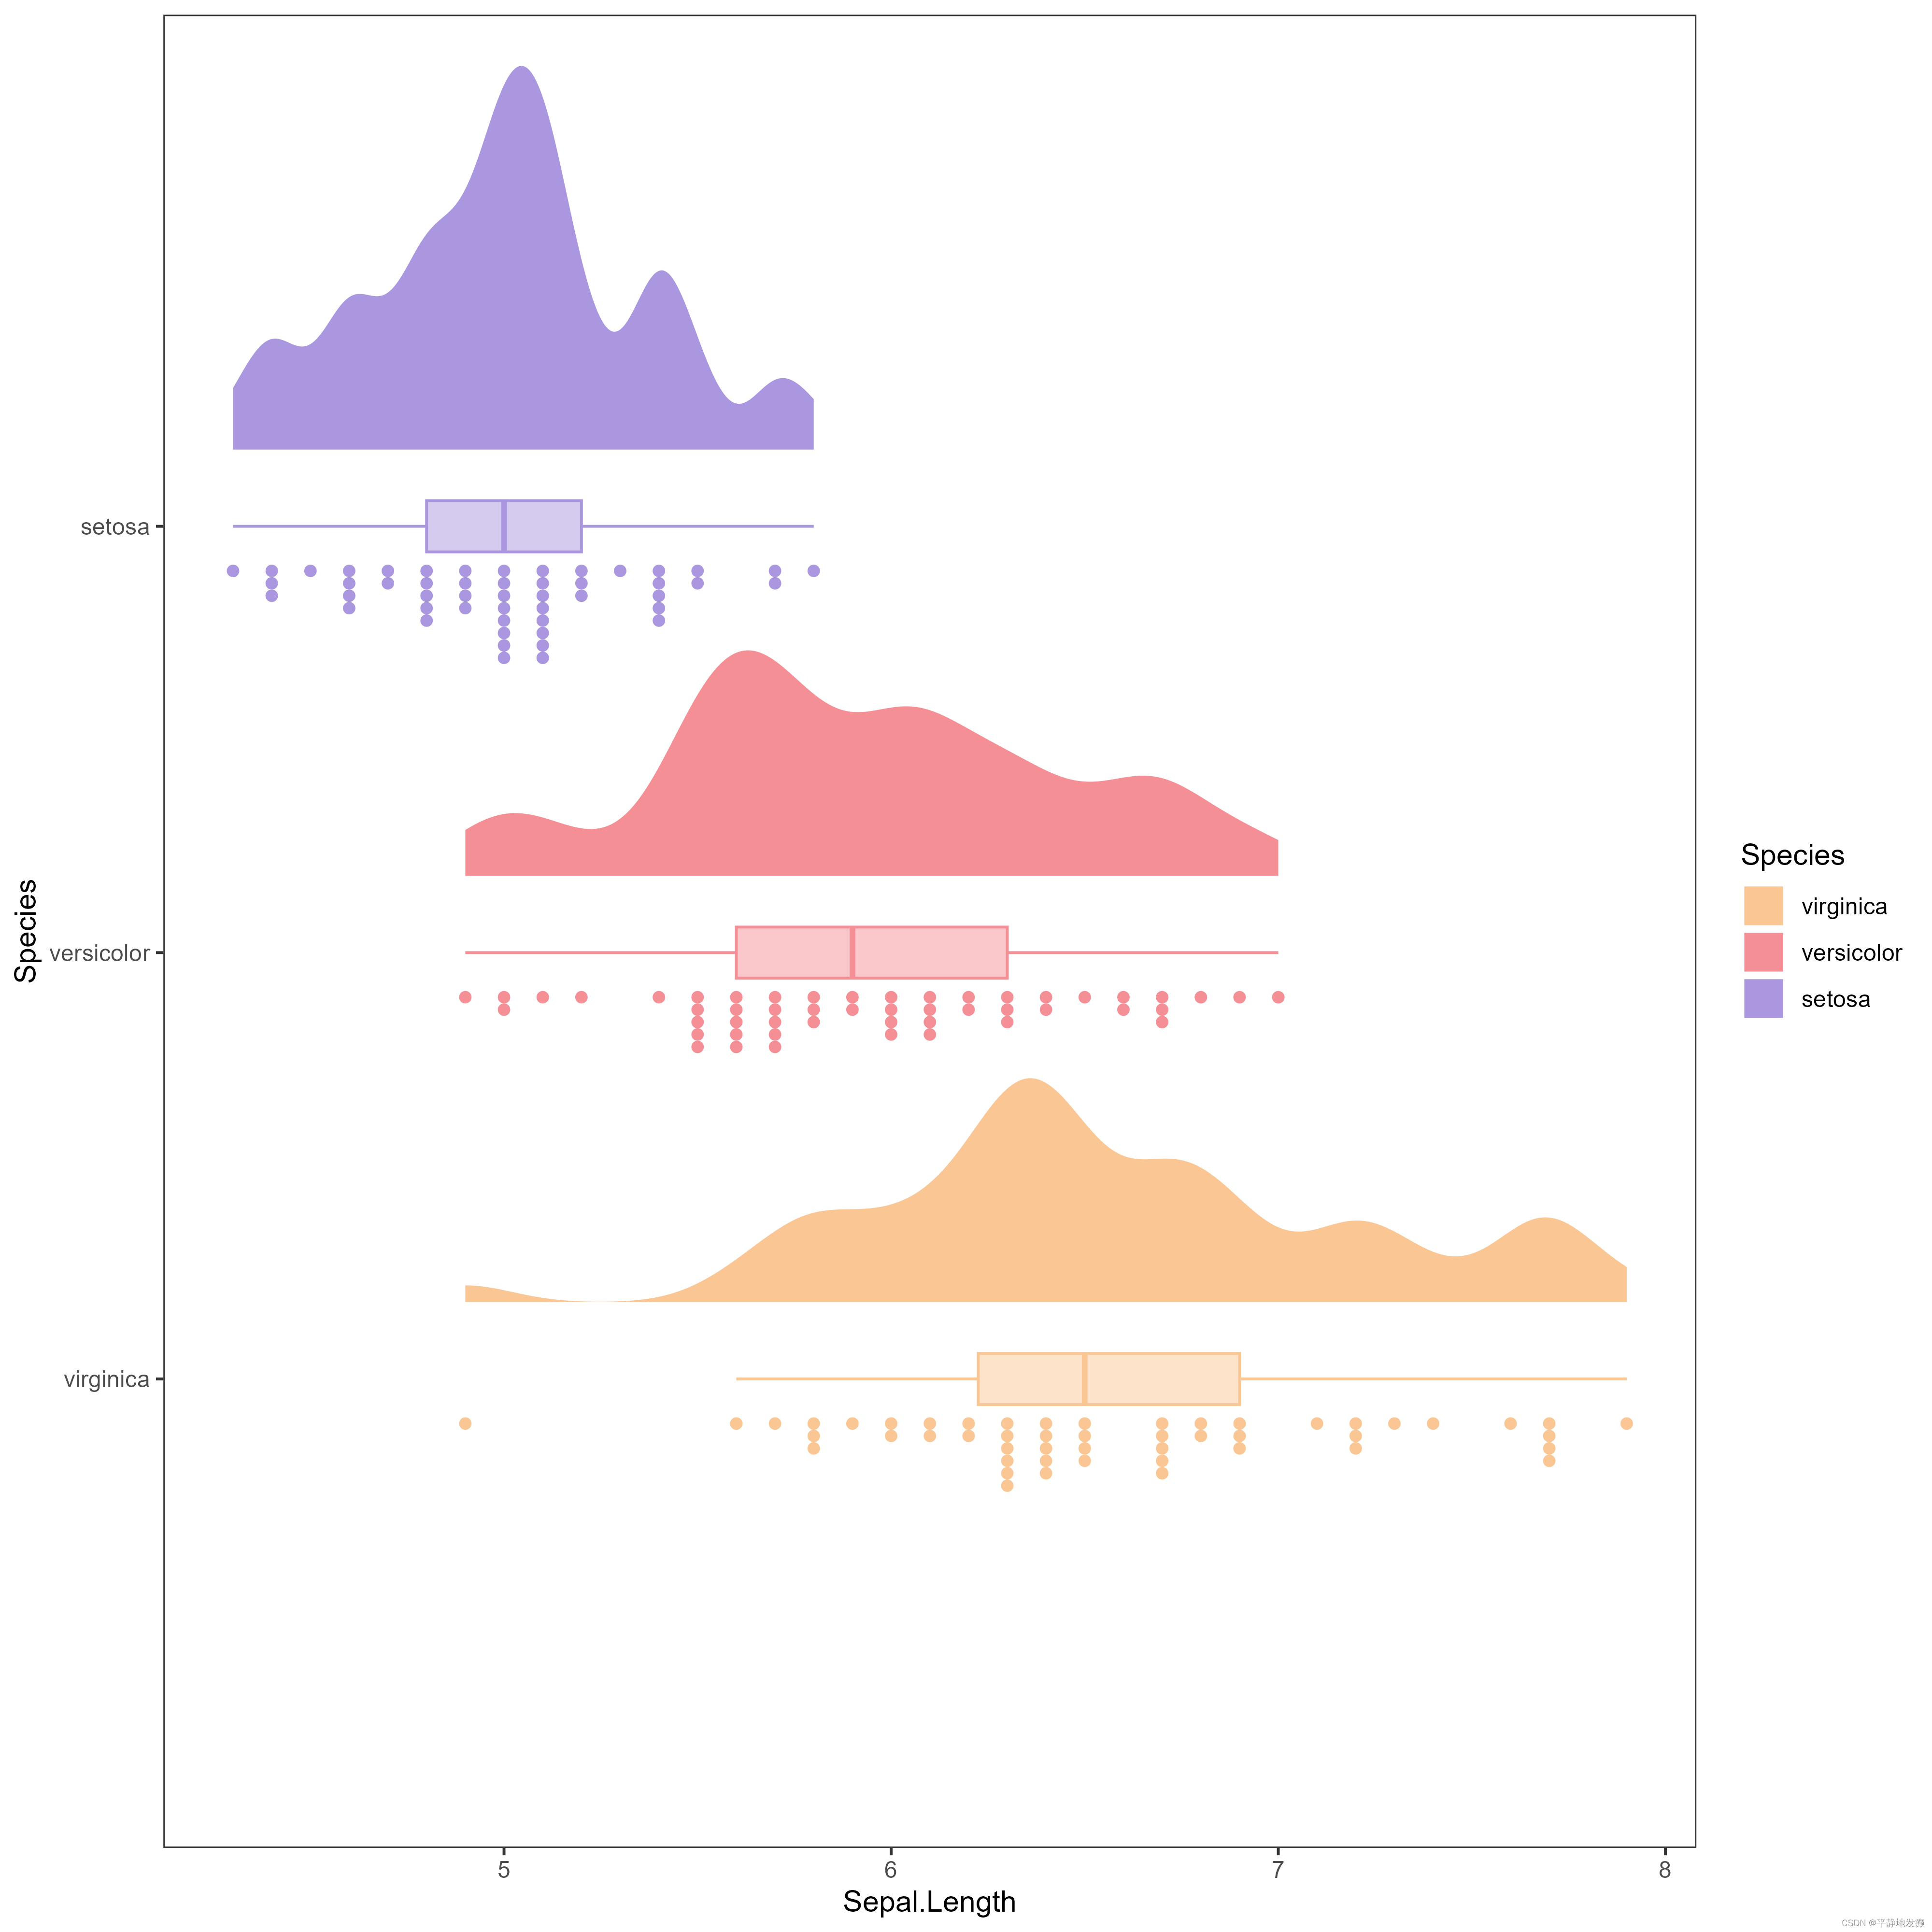
方法1
library(ggplot2)
library(ggdist)
library(tidyquant)
data <- iris
data$Species <- factor(data$Species, levels = c("virginica","versicolor","setosa"))
ggplot(data,aes(x=Species,
y=Sepal.Length,
fill=Species,
color=Species)) +
ggdist::stat_halfeye(
adjust = 0.5,
justification = -.2,
.width = 0,
point_colour = NA
) +
geom_boxplot(
width = .12,
outlier.color = NA,
alpha = 0.5
) +
ggdist::stat_dots(
side = "left",
justification = 1.1,
binwidth = .03
) +
scale_color_manual(values=c("#FAC794","#F58F96","#AB97E0"))+
scale_fill_manual(values=c("#FAC794","#F58F96","#AB97E0"))+
coord_flip()+
theme_bw()+
theme(panel.grid=element_blank())
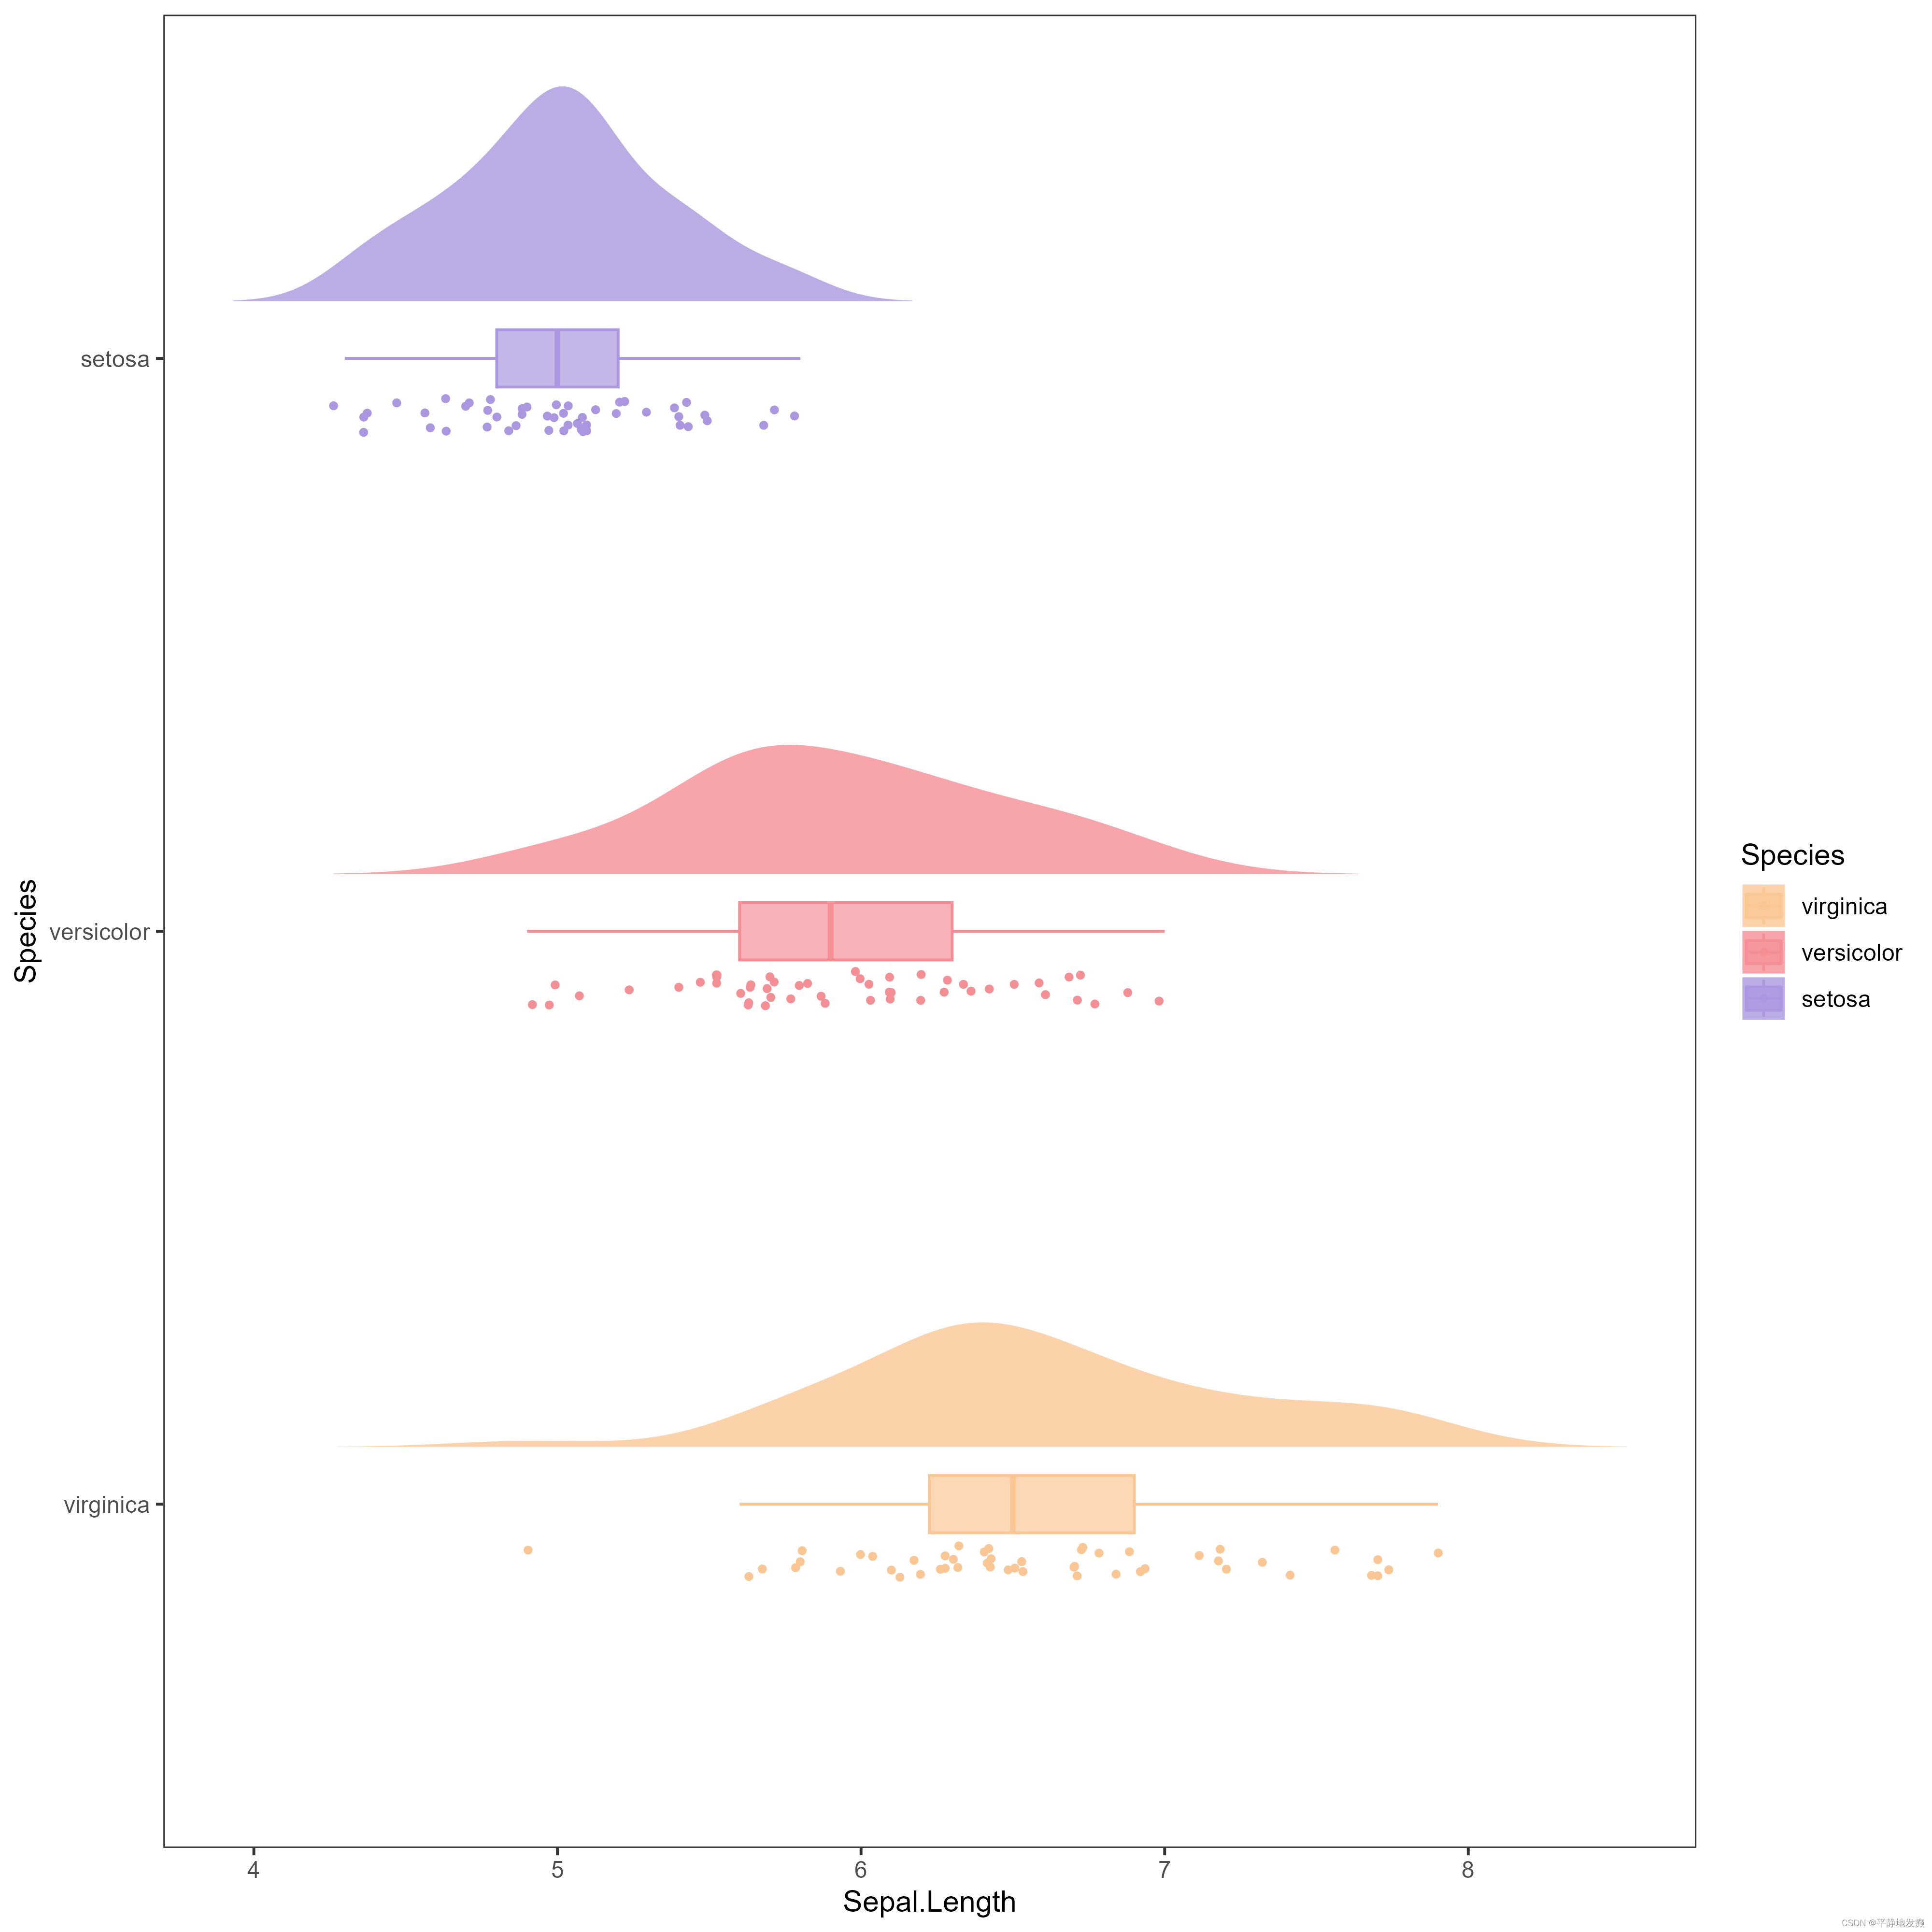
方法2
library(ggplot2)
library(gghalves)
data <- iris
data$Species <- factor(data$Species, levels = c("virginica","versicolor","setosa"))
ggplot(data,aes(x=Species,
y=Sepal.Length,
fill=Species,
color=Species))+
geom_half_violin(position=position_nudge(x=0.1, y=0),
side='R',
adjust=1.2,
trim=F,
color=NA,
alpha=0.8) +
geom_point(aes(x = as.numeric(Species)-0.1, y = Sepal.Length, color = Species),
position = position_jitter(width = 0.03),
size = 1.5,
shape = 20) +
geom_boxplot(outlier.shape = NA,
width = 0.1,
alpha = 0.7) +
scale_color_manual(values=c("#FAC794","#F58F96","#AB97E0"))+
scale_fill_manual(values=c("#FAC794","#F58F96","#AB97E0"))+
coord_flip()+
theme_bw()+
theme(panel.grid=element_blank())
来源参考如下,并进行一些修改
参考1
参考2


 本文展示了如何使用R语言中的ggplot2和ggdist包,结合iris数据集,创建包含半暴雨图、小提琴图、箱线图和散点图的可视化,以展示不同物种鸢尾花的Sepal.Length特征分布。


 765
765

 被折叠的 条评论
为什么被折叠?
被折叠的 条评论
为什么被折叠?
 到【灌水乐园】发言


