


利用麻雀搜索算法解决无线传感器网络布局优化的问题。
麻雀搜索算法的基本原理:下面这位博主讲的非常好,可以一看。
(2条消息) 智能优化算法:麻雀搜索算法-附代码_智能算法研学社(Jack旭)的博客-CSDN博客_麻雀搜索算法
麻雀搜索算法代码:(SSA基本框架)
function [fMin , bestX,Convergence_curve ] = SSA(pop, M,c,d,dim,fobj  )

   P_percent = 0.2;    % The population size of producers accounts for "P_percent" percent of the total population size


%%%%%%%%%%%%%%%%%%%%%%%%%%%%%%%%%%%%%%%%%%%%%%%%%%%%%%
pNum = round( pop *  P_percent );    % The population size of the producers


lb= c.*ones( 1,dim );    % Lower limit/bounds/     a vector
ub= d.*ones( 1,dim );    % Upper limit/bounds/     a vector
%Initialization
for i = 1 : pop

    x( i, : ) = lb + (ub - lb) .* rand( 1, dim );
    fit( i ) = fobj( x( i, : ) ) ;
end
pFit = fit;
pX = x;                            % The individual's best position corresponding to the pFit
[ fMin, bestI ] = min( fit );      % fMin denotes the global optimum fitness value
bestX = x( bestI, : );             % bestX denotes the global optimum position corresponding to fMin


 % Start updating the solutions.

for t = 1 : M


  [ ans, sortIndex ] = sort( pFit );% Sort.

  [fmax,B]=max( pFit );
   worse= x(B,:);

   r2=rand(1);
if(r2<0.8)

    for i = 1 : pNum                                                   % Equation (3)
         r1=rand(1);
        x( sortIndex( i ), : ) = pX( sortIndex( i ), : )*exp(-(i)/(r1*M));
        x( sortIndex( i ), : ) = Bounds( x( sortIndex( i ), : ), lb, ub );
        fit( sortIndex( i ) ) = fobj( x( sortIndex( i ), : ) );
    end
  else
  for i = 1 : pNum

  x( sortIndex( i ), : ) = pX( sortIndex( i ), : )+randn(1)*ones(1,dim);
  x( sortIndex( i ), : ) = Bounds( x( sortIndex( i ), : ), lb, ub );
  fit( sortIndex( i ) ) = fobj( x( sortIndex( i ), : ) );

  end

end


 [ fMMin, bestII ] = min( fit );
  bestXX = x( bestII, : );


   for i = ( pNum + 1 ) : pop                     % Equation (4)

         A=floor(rand(1,dim)*2)*2-1;

          if( i>(pop/2))
           x( sortIndex(i ), : )=randn(1)*exp((worse-pX( sortIndex( i ), : ))/(i)^2);
          else
        x( sortIndex( i ), : )=bestXX+(abs(( pX( sortIndex( i ), : )-bestXX)))*(A'*(A*A')^(-1))*ones(1,dim);

         end
        x( sortIndex( i ), : ) = Bounds( x( sortIndex( i ), : ), lb, ub );
        fit( sortIndex( i ) ) = fobj( x( sortIndex( i ), : ) );

   end
  c=randperm(numel(sortIndex));
   b=sortIndex(c(1:20));
    for j =  1  : length(b)      % Equation (5)

    if( pFit( sortIndex( b(j) ) )>(fMin) )

        x( sortIndex( b(j) ), : )=bestX+(randn(1,dim)).*(abs(( pX( sortIndex( b(j) ), : ) -bestX)));

        else

        x( sortIndex( b(j) ), : ) =pX( sortIndex( b(j) ), : )+(2*rand(1)-1)*(abs(pX( sortIndex( b(j) ), : )-worse))/ ( pFit( sortIndex( b(j) ) )-fmax+1e-50);

          end
        x( sortIndex(b(j) ), : ) = Bounds( x( sortIndex(b(j) ), : ), lb, ub );

       fit( sortIndex( b(j) ) ) = fobj( x( sortIndex( b(j) ), : ) );
 end
    for i = 1 : pop
        if ( fit( i ) < pFit( i ) )
            pFit( i ) = fit( i );
            pX( i, : ) = x( i, : );
        end

        if( pFit( i ) < fMin )
           fMin= pFit( i );
            bestX = pX( i, : );


        end
    end

    Convergence_curve(t)=fMin;

end


% Application of simple limits/bounds
function s = Bounds( s, Lb, Ub)
  % Apply the lower bound vector
  temp = s;
  I = temp < Lb;
  temp(I) = Lb(I);

  % Apply the upper bound vector
  J = temp > Ub;
  temp(J) = Ub(J);
  % Update this new move
  s = temp;

%---------------------------------------------------------------------------------------------------------------------------
麻雀搜索算法是一个封闭的算法,我们要怎么把它应用到我们所需要的场景中去呢?
答案就藏在第二段代码中,通过编辑Get_Functions_details(F)代码段中对x的操作,我们就可以实现对麻雀搜索算法的套用了。
麻雀搜索算法是求最小值的算法,在无线传感器网络布局优化中,我们可以将覆盖率转化为未覆盖率,再套入麻雀搜索算法中,可以求得最佳布局。
%_________________________________________________________________________%
% 基于麻雀优化的WNS覆盖优化算法,3D版 %
%_________________________________________________________________________%
clear all
clc
close all
rng('default');
%% 设定WNS覆盖参数,
%% 默认输入参数都是整数,如果想定义小数,请自行乘以系数变为整数再做转换。
%% 比如范围1*1,R=0.03可以转换为100*100,R=3;
%区域范围为AreaX*AreaY*AreaZ
AreaX = 100;
AreaY = 100;
N = 20 ;%覆盖节点数
R = 15;%通信半径
%% 设定麻雀优化参数
% for i=1:N
rng('default');
%%设定麻雀优化参数
SearchAgents_no=50; % Number of search agents 种群数量
Max_iteration=150; % Maximum numbef of iterations 设定最大迭代次数
Function_name='F1'; % Name of the test function that can be from F1 to F23 (Table 1,2,3 in the paper) 设定适应度函数
fobj=Get_Functions_details(Function_name); %设定边界以及优化函数
lb=0;
ub=100;
dim=2*N;
% initialization(pop,dim,ub,lb);
input=randi([lb,ub],SearchAgents_no,dim);
input1=input(1,:);
input_data=reshape(input1,[],2);
[Best_position,Best_score,SSA_curve]=SSA(SearchAgents_no,Max_iteration,lb,ub,dim,fobj,AreaX,input); %开始优化
% end
%%
%Coordinate代表覆盖的坐标点的存放
%CoordinateNumber 代表覆盖的坐标点的个数
[output1,curve1] = fun(input_data,N,R,AreaX,AreaY); %未优化覆盖图
[output2,curve2] = fun(Best_position,N,R,AreaX,AreaY); %优化后覆盖图
figure
SSA_curve = 1 - SSA_curve;%将未覆盖率转换覆盖率。
plot(SSA_curve,'Color','r')
title('Objective space')
xlabel('迭代次数');
ylabel('覆盖率');
axis tight
grid on
box on
legend('SSA')
% img =gcf; %获取当前画图的句柄
% print(img, '-dpng', '-r600', './img.png') %即可得到对应格式和期望dpi的图像
% display(['最终得到的最优覆盖率 : ', num2str(1 - Best_score)]);
figure
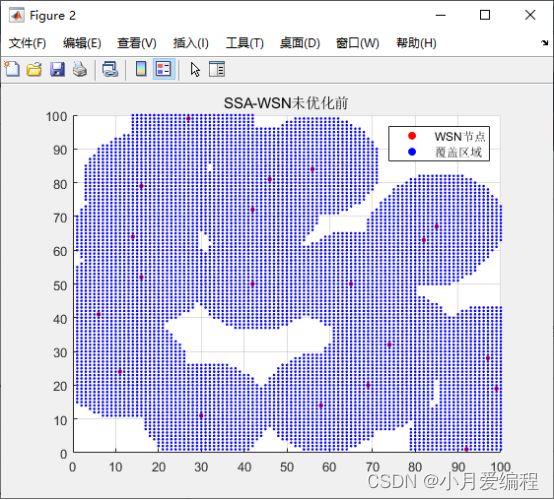
scatter(input_data(1:N),input_data(N+1:2*N),12,'r','filled');%绘制节点
hold on;
scatter(output1(:,1),output1(:,2),4,'b','filled');%绘制覆盖区域
hold off;
axis ( [0 AreaX 0 AreaY]);
title('SSA-WSN未优化前')
grid on;
legend('WSN节点','覆盖区域')
img =gcf; %获取当前画图的句柄
print(img, '-dpng', '-r600', './img1.png') %即可得到对应格式和期望dpi的图像
curve1
curve2
figure
scatter(Best_position(1:N),Best_position(N+1:2*N),12,'r','filled');%绘制节点
hold on;
scatter(output2(:,1),output2(:,2),4,'b','filled');%绘制覆盖区域
hold off;
axis ( [0 AreaX 0 AreaY]);
title('SSA-WSN最终结果')
grid on;
legend('WSN节点','覆盖区域')
img =gcf; %获取当前画图的句柄
print(img, '-dpng', '-r600', './img1.png') %即可得到对应格式和期望dpi的图像
运行结果如下:


完整的matlab代码如下:基于麻雀搜索算法(SSA)的无线传感器网络(WSN)优化问题-算法与数据结构文档类资源-CSDN文库


 9190
9190


 被折叠的 条评论
为什么被折叠?
被折叠的 条评论
为什么被折叠?
 到【灌水乐园】发言


