


目录
决策树优化与可视化
1 决策树分类
from sklearn.datasets import load_breast_cancer
from sklearn.tree import DecisionTreeClassifier
from sklearn.model_selection import train_test_split
from sklearn import datasets
import matplotlib.pyplot as plt
import numpy as np

cancer = datasets.load_breast_cancer()
X_train, X_test, y_train, y_test = train_test_split(cancer.data, cancer.target, stratify=cancer.target, random_state = 42)
tree = DecisionTreeClassifier(random_state=0)

tree.fit(X_train, y_train)
print("Accuracy on traning set:{:.3f}".format(tree.score(X_train, y_train)))
print("Accuracy on test set:{:.3f}".format(tree.score(X_test, y_test)))
print("tree max depth:{}".format(tree. tree_.max_depth))
# 报错:AttributeError: 'function' object has no attribute 'data' function对象没有data属性
# 解决之后:
#Accuracy on traning set:1.000
#Accuracy on test set:0.937
#tree max depth:7
可以得到,训练集的精度是100%,这是因为叶子结点都是纯的,树的深度为7,足以完美地记住训练数据的所有标签,测试集泛化精度只有93.7%,明显过拟合。
不限制决策树的深度,它的深度和复杂度都可以变得特别大。故未剪枝的树容易过拟合,对新数据的泛化性能不佳。
现在将预剪枝应用在决策树上,可以阻止树的完全生长。
设置max_depth=4,这表明构造的决策树只有4层,限制树的深度可以减少过拟合,这会降低训练集的精度,但可以提高测试集的精度。
from sklearn.datasets import load_breast_cancer
from sklearn.tree import DecisionTreeClassifier
from sklearn.model_selection import train_test_split
from sklearn import datasets
import matplotlib.pyplot as plt
import numpy as np

cancer = datasets.load_breast_cancer()
X_train, X_test, y_train, y_test = train_test_split(cancer.data, cancer.target, stratify=cancer.target, random_state = 42)
tree = DecisionTreeClassifier(max_depth=4, random_state=0)
tree.fit(X_train, y_train)
print("Accuracy on traning set:{:.3f}".format(tree.score(X_train, y_train)))
print("Accuracy on test set:{:.3f}".format(tree.score(X_test, y_test)))
Accuracy on traning set:0.988
Accuracy on test set:0.951训练精度为98.8%,测试精度为95.1%,树的最大深度只有4层,降低了训练精度,但提高了泛化(测试)精度,改善了过拟合的状况。
2 决策树可视化
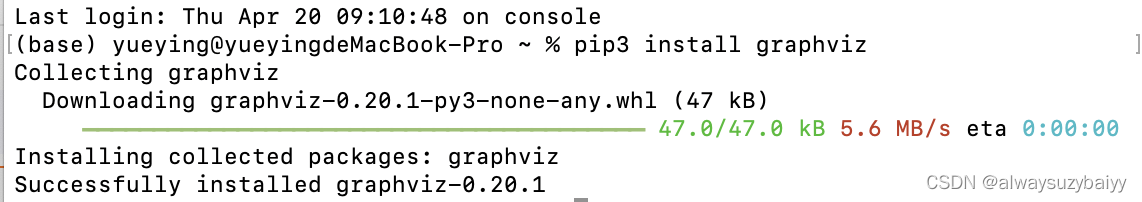
使用 pip3 install graphviz 后, import graphviz 仍然报错:
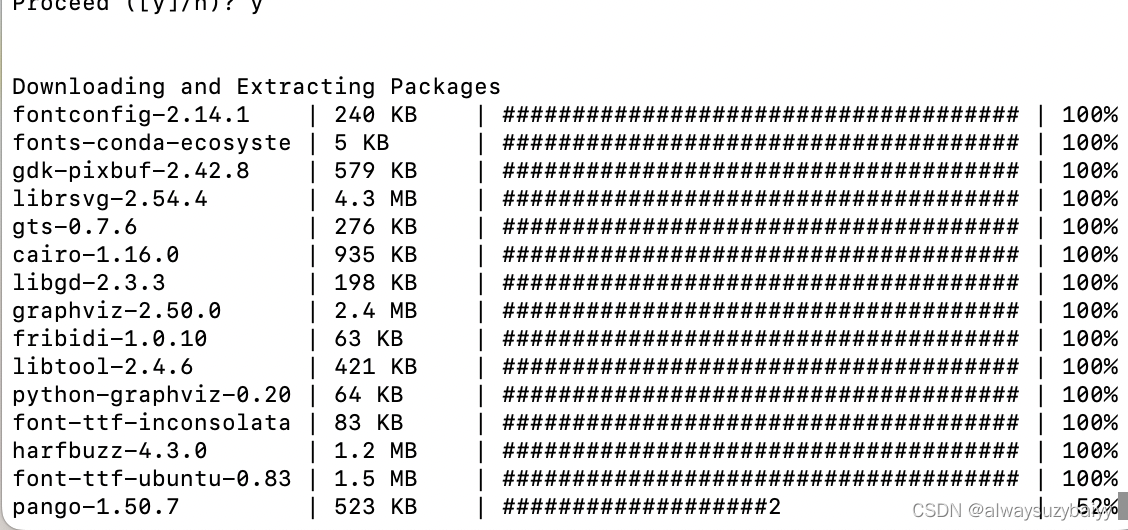
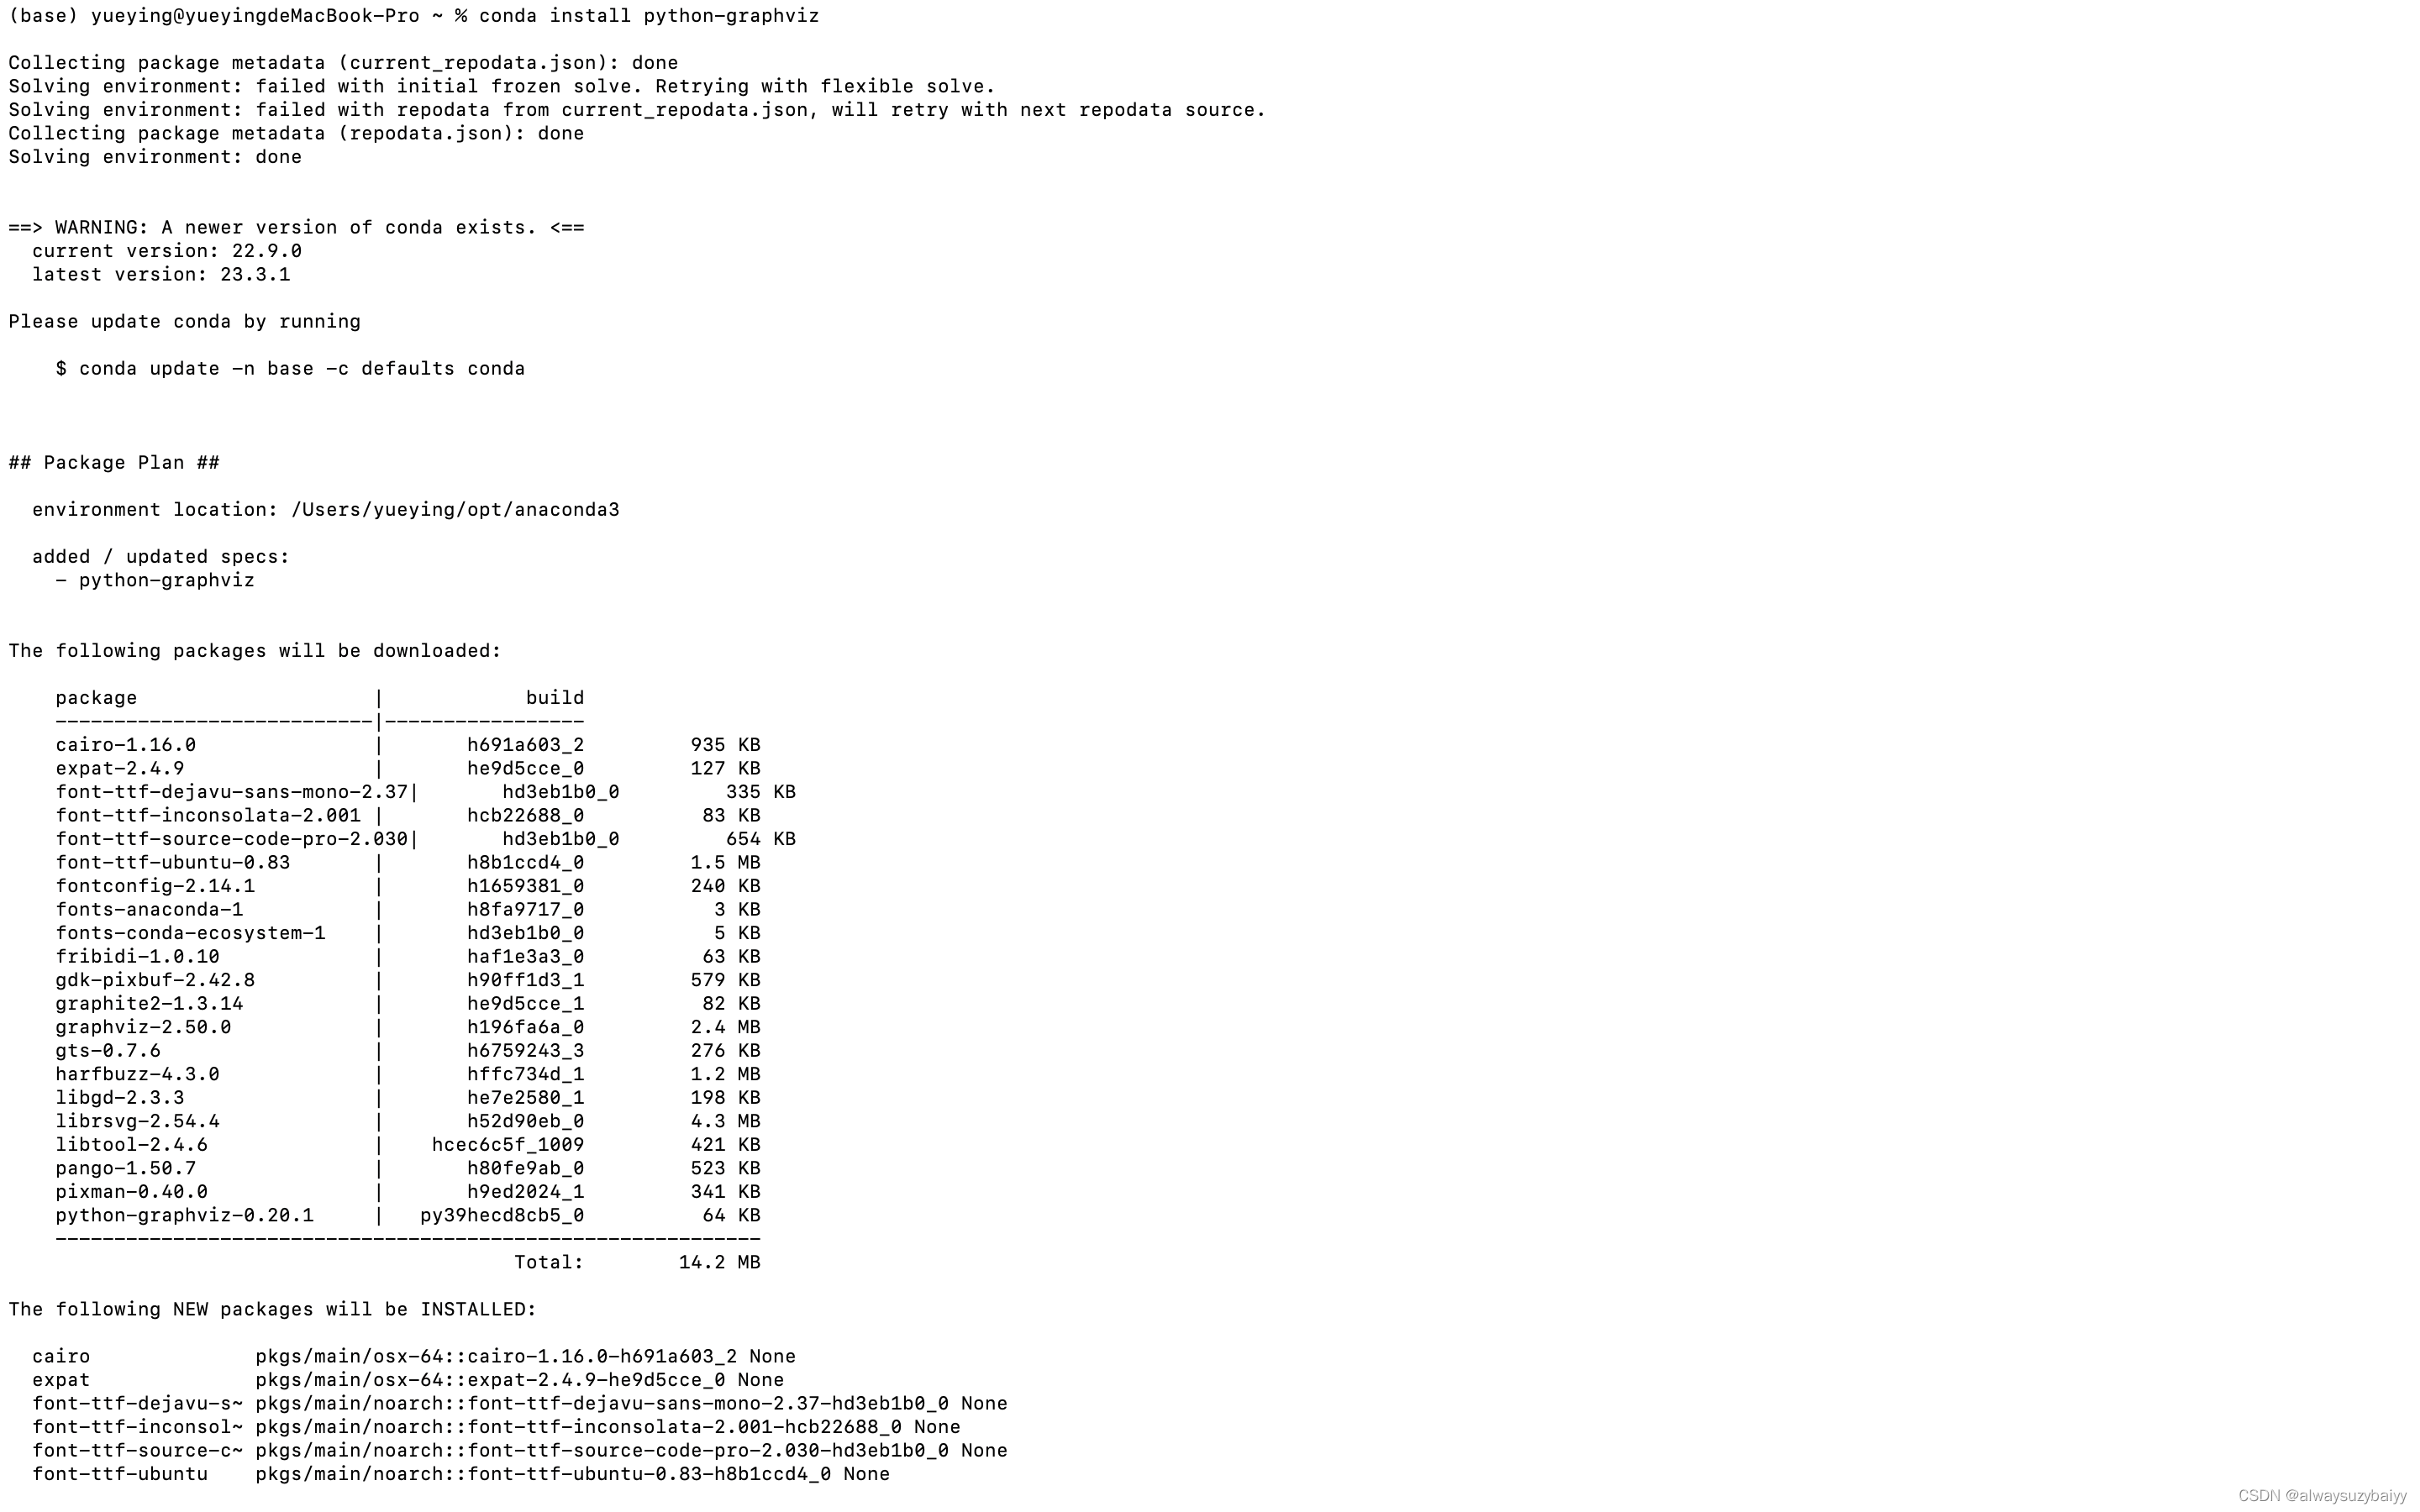
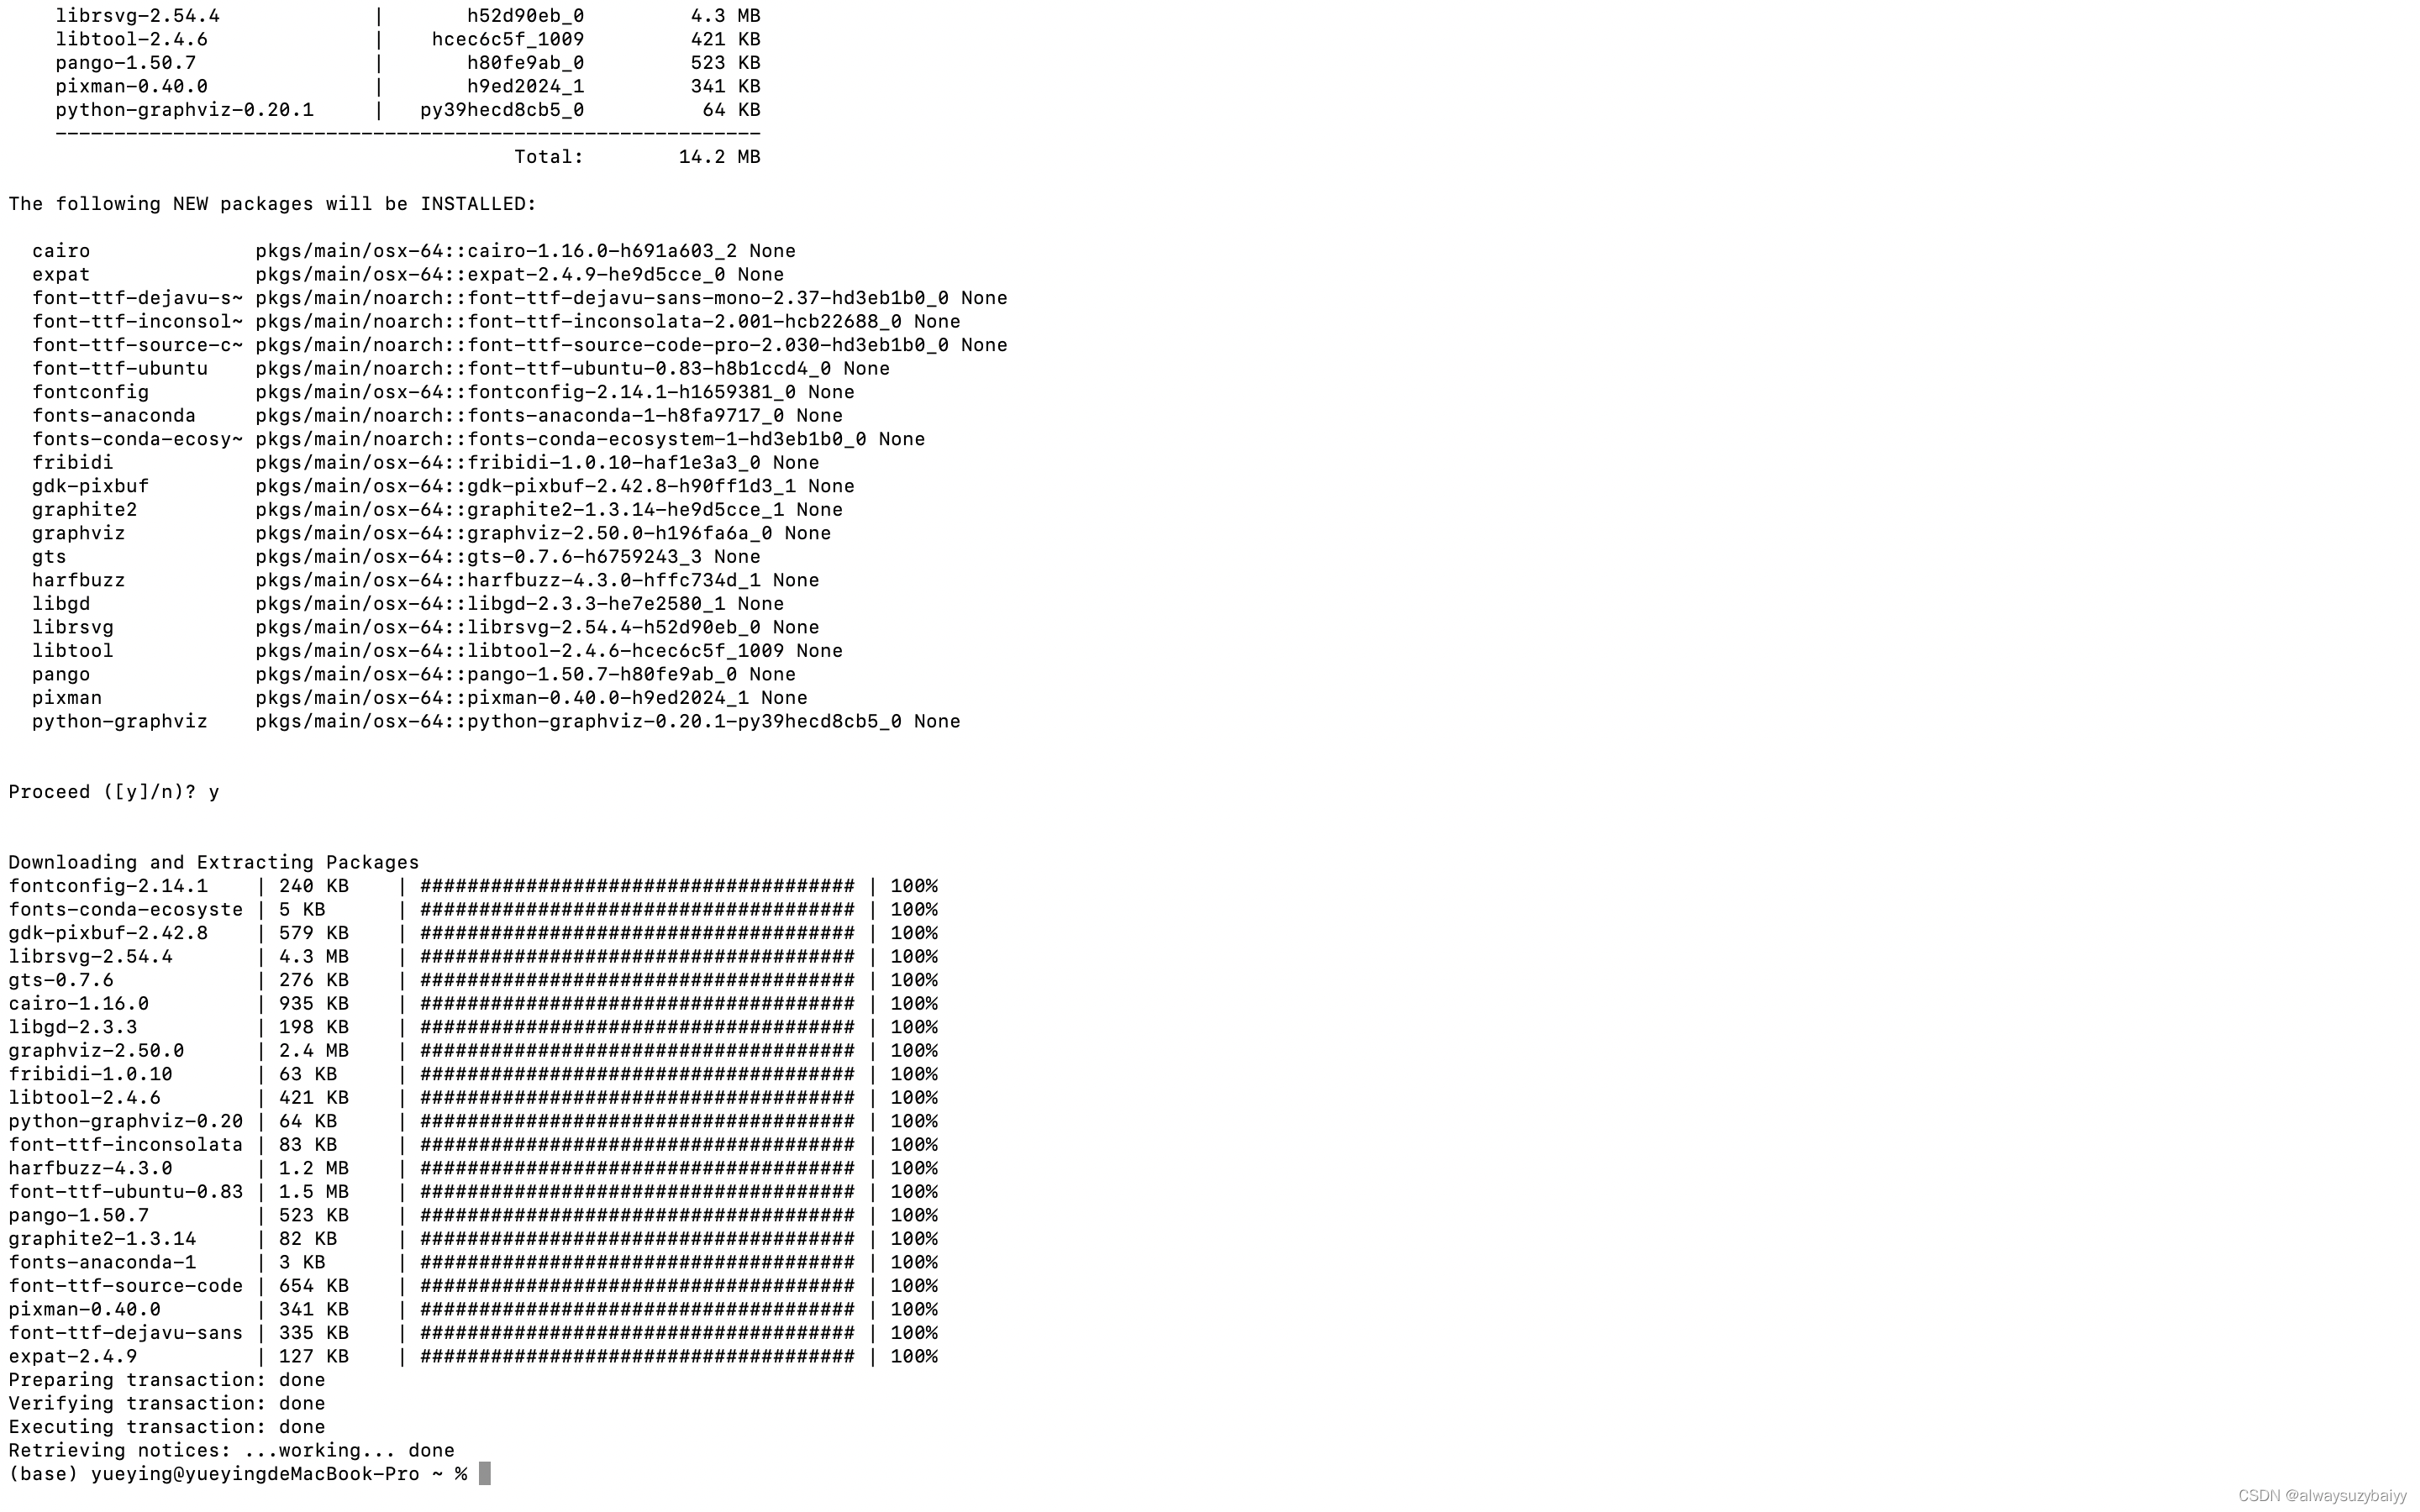
ModuleNotFoundError: No module named 'graphviz'使用命令:conda install python-graphviz;
from sklearn.datasets import load_breast_cancer
from sklearn.tree import DecisionTreeClassifier
from sklearn.model_selection import train_test_split
from sklearn import datasets
import matplotlib.pyplot as plt
import numpy as np
import graphviz
from sklearn.tree import export_graphviz
cancer = datasets.load_breast_cancer()
X_train, X_test, y_train, y_test = train_test_split(cancer.data, cancer.target, stratify=cancer.target, random_state = 42)
tree = DecisionTreeClassifier(max_depth=4, random_state=0)
tree.fit(X_train, y_train)
export_graphviz(tree,out_file="tree.dot",class_names=["malignat","benign"],
                feature_names=cancer.feature_names,impurity=False
                ,filled=True)


with open("tree.dot") as f:
    dot_graph = f.read()
graphviz.Source(dot_graph)

# out:ModuleNotFoundError: No module named 'graphviz'
尝试了很多种方法并没有解决问题‼️
http://t.csdn.cn/wAVEK ⬅️可用此方法再次验证
3 显示树的特征重要性
其中最常用的是特征重要性(Feature Importance),每个特征对树决策的重要性进行排序, 其中0表示“根本没用到”,1表示“完美预测目标值”,特征重要性的求和始终为1。
from sklearn.datasets import load_breast_cancer
from sklearn.tree import DecisionTreeClassifier
from sklearn.model_selection import train_test_split
from sklearn import datasets
import matplotlib.pyplot as plt
import numpy as np

cancer = datasets.load_breast_cancer()
X_train, X_test, y_train, y_test = train_test_split(cancer.data, cancer.target, stratify=cancer.target, random_state = 42)
tree = DecisionTreeClassifier(max_depth=4, random_state=0)
tree.fit(X_train, y_train)
print("Feature imprtance:\n{}".format(tree.feature_importances_))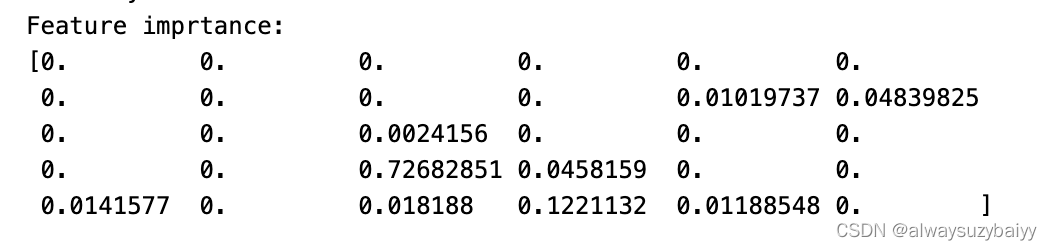
Feature imprtance:
[0.         0.         0.         0.         0.         0.
 0.         0.         0.         0.         0.01019737 0.04839825
 0.         0.         0.0024156  0.         0.         0.
 0.         0.         0.72682851 0.0458159  0.         0.
 0.0141577  0.         0.018188   0.1221132  0.01188548 0.        ]
特征重要性可视化
from sklearn.datasets import load_breast_cancer
from sklearn.tree import DecisionTreeClassifier
from sklearn.model_selection import train_test_split
from sklearn import datasets
import matplotlib.pyplot as plt
import numpy as np

cancer = datasets.load_breast_cancer()
X_train, X_test, y_train, y_test = train_test_split(cancer.data, cancer.target, stratify=cancer.target, random_state = 42)
tree = DecisionTreeClassifier(max_depth=4, random_state=0)
tree.fit(X_train, y_train)
print("Feature imprtance:\n{}".format(tree.feature_importances_))

def plot_feature_importances_cancer(model):
    n_features = cancer.data.shape[1]
    plt.barh(range(n_features),model.feature_importances_,align='center')
    plt.yticks(np.arange(n_features),cancer.feature_names)
    plt.xlabel("Feature importance")
    plt.ylabel("Feature")

plot_feature_importances_cancer(tree)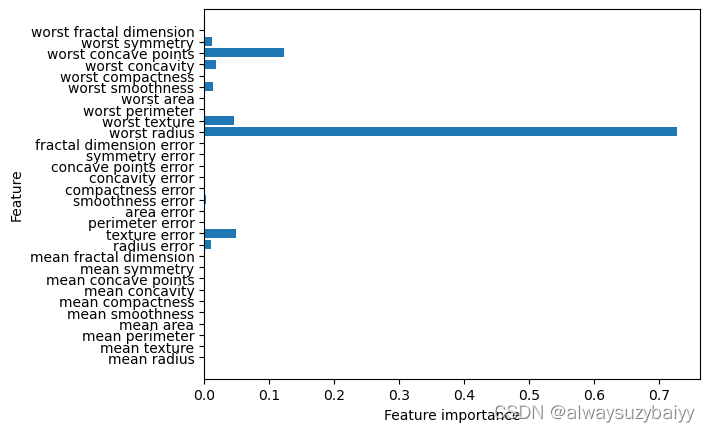
决策树回归
1 决策树回归
#决策树回归
import numpy as np
import matplotlib.pyplot as plt
from sklearn import datasets
boston = datasets.load_boston()

X = boston.data
y = boston.target
from sklearn.model_selection import train_test_split
X_train, X_test, y_train, y_test = train_test_split(X,y, random_state=666)

# DecisionTreeRegressor决策树的回归器
from sklearn.tree import DecisionTreeRegressor
dt_reg = DecisionTreeRegressor( max_depth= 11 )
dt_reg.fit(X_train, y_train)
print(dt_reg.score(X_test,y_test))
print(dt_reg.score(X_train,y_train))
# 0.6005800948958887
# 1.0

# 此时决策树在训练数据集上预测准确率是百分百的,但是在测试数据集上只有60%的准确率
# 很显然出现了过拟合,可通过设置树深来改善过拟合
# 0.6908496704356424
# 0.9918292293652428
此时决策树在训练数据集上预测准确率是百分百的,但是在测试数据集上只有60%的准确率,很显然出现了过拟合,可通过设置树深来改善过拟合。


 1456
1456


 被折叠的 条评论
为什么被折叠?
被折叠的 条评论
为什么被折叠?
 到【灌水乐园】发言


