


 超级会员免费看
博客已同步微信公众号:GIS茄子;若博客出现纰漏或有更多问题交流欢迎关注GIS茄子,或者邮箱联系(推荐-见主页).

最近痛感自己的阅读论文的能力下降,于是打算开一个专栏,专门解析一些觉得不错的论文并尝试进行复现,这个过程相当长,当然每篇博客都会在持续更新当然也可能会弃坑,由于技术的原因或者论文实际无法复现等等诸多因素。
01 论文介绍
论文地址:https://link.springer.com/10.1007/s11269-022-03419-3
这篇论文是想要基于时间序列分解和CNN-LSTM两种方法的混合进行NDVI的预测,需要注意的是此处的CNN和LSTM你可以拆分看,他们并不是一个完整的概念,只是二者的简单叠加即CNN的输出作为LSTM的输入。
我就不讲这些算法到底好亦或者差,仅仅从实现原理上进行解析。(仅个人解读)
1.1 时间序列分解
时间序列分解使用ARIMA模型(应该是其变种可能,暂未过多了解)得到,例如某一站点的1年12个月份的温度值(12行1列的数据)。该站点每个时期的温度值都分解成三个分量即趋势分量、季节分量以及残差分量(T、S、R),三者相加会等于该时期的温度值,趋势分量表示在很多个站点或者一个站点的不同年份中,这个趋势分量都是如此的规律例如上升?下降?稳定?总之它指向一种长远趋势的量值,而季节分量反应着时间序列中的季节性波动,可以理解为一年中每个月份的周期变化。而残差分量则是从原始时间序列中移除趋势和季节性后剩余的部分。它包含了数据中无法由趋势和季节性解释的波动,通常被视为“噪声”。
处理之后得到的数据应当是一个12行3列的数据集。在论文中的行数是33,表示时间上的滑动窗口是33,这个滑动窗口的数值通常是时间序列分解中的R/S分析得到(这个暂时未做了解)。同时它也决定了cnn-lstm的单个输入样本的shape为(时间步数,特征数),在论文中各个模型的特征数都是3即RST三个分量。时间步数则各个模型有所不同。
1.2 CNN-LSTM
这里我认为需要从头开始好好说明一下整个数据的流程,当然也为了方便我后续的复现。
首先,假定我拥有2010-2012年的NDVI数据,时间分辨率为月,研究区域为四川,分辨率为1000m,假定行数234列数456,影像数应该为36景(三年36月)。
那么理论上我可以使用该数据实现论文中N-N模型,即通过历史的NDVI数据预测未来时间段的NDVI数据。首先,对于每一个像元上的数据(不同时期的NDVI),我们都可以视为一个时间序列并进行时间序列分解得到每一个像元上不同时期的RST。
R:Residual Component(残差分量);
S:Seasonal Component(季节分量);
T:Trend Component(趋势分量);
做到这一步,你实际上做完了时间上的分解,预处理工作就已经完成。
接下来就是cnn-lstm模型的输入和输出已经建立,在此之前其实还有一个步骤就是样本的创建使得处理好的数据集可以满足模型的输入条件。理论上就是要(一般)整理成(None,时间步,特征数)的形式,None表示样本的个数,时间步即论文中的时间窗口大小,依据R/S分析得到(即前面对于每个像素都又36个时间段的NDVI值,而R/S分析<ARIMA应该>可以得到该时间序列的平均周期例如12?等)。特征数即前面时间序列分解得到的三个分量RST。
例如在N-N模型中,论文提及:
provides that the input size of T-T model is a 333 matrix, while that of the P-P model, the T-N model, the P-N model, the TP-N model and the N–N model is a 483 matrix, 333 matrix, 483 matrix, 486 matrix and 163 matrix, respectively.
即N-N模型中,输入的单个样本其shape为16*3,即时间步为16,特征数为3。
在论文中各个模型的架构等信息如下:
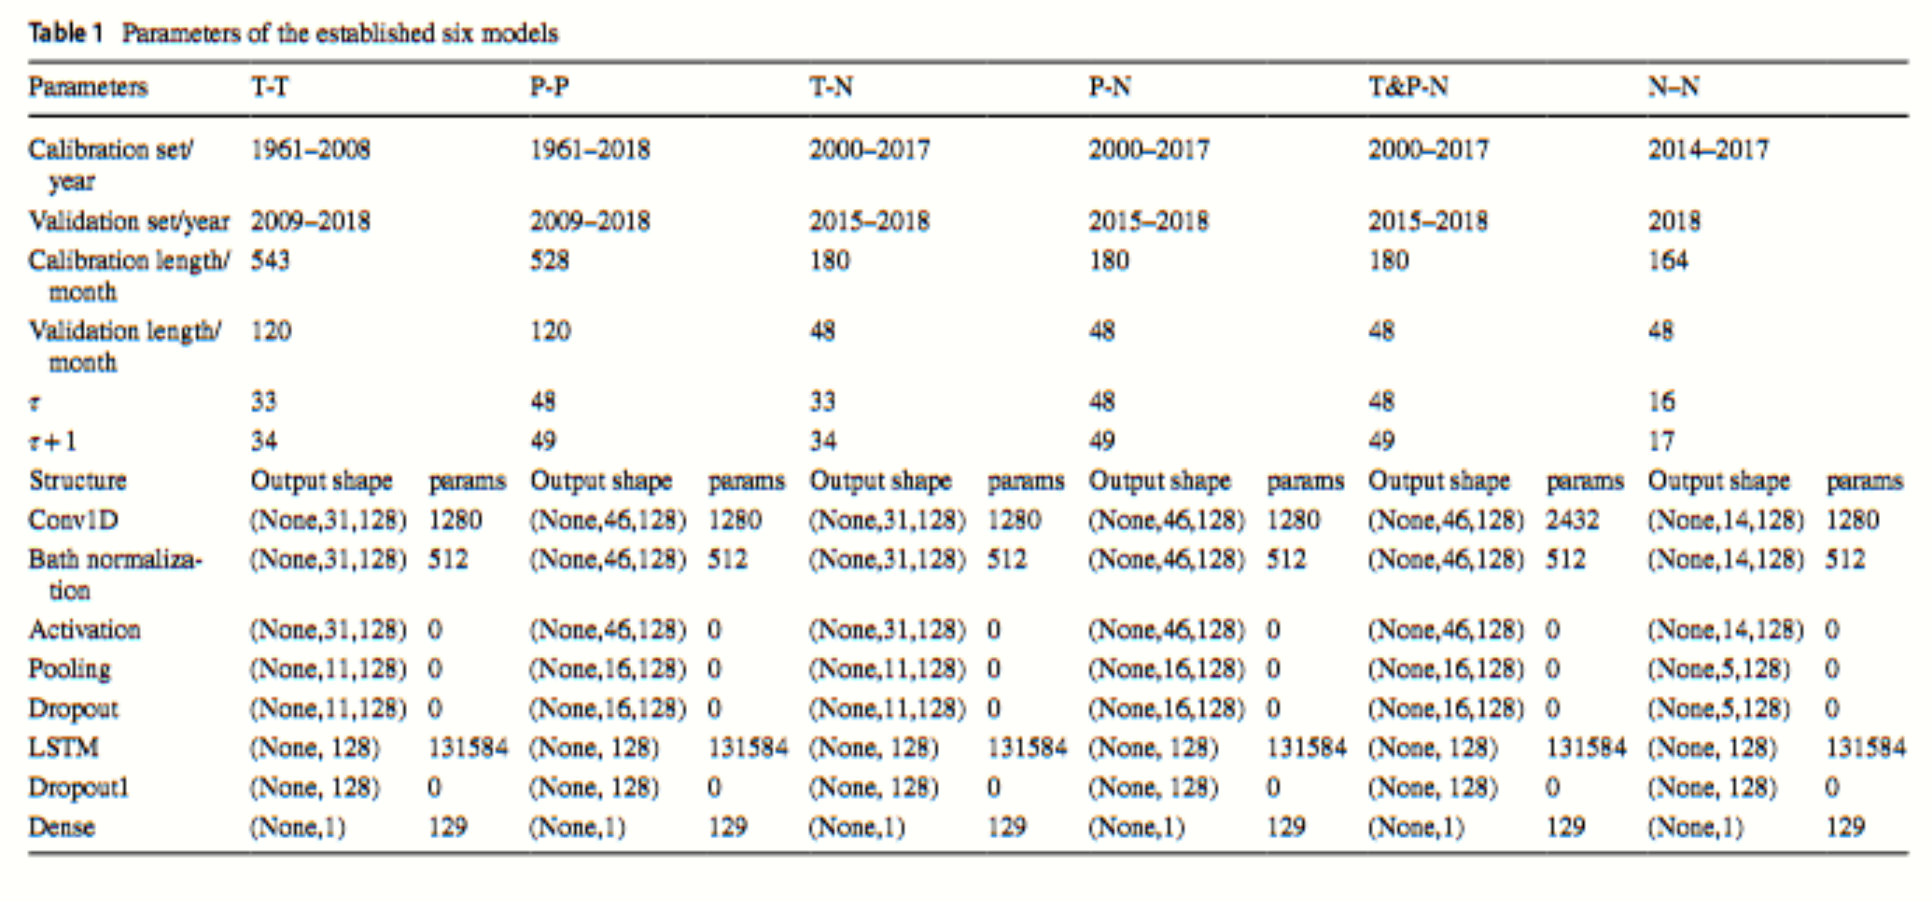
可以发现,所有模型的输出均为(None,1),这说明每一个样本的输出值为一个一维数值,也即只往后预测一期NDVI。
中间的卷积、池化啥的就是按顺序按部就班来,没啥变化,大概写了一下核心部分的代码,用的tensorflow:
def create_model(n_steps, n_features):
    model = Sequential()

    # 一维卷积层
    model.add(Conv1D(filters=128, kernel_size=3, input_shape=(n_steps, n_features)))
    # 批量归一化
    model.add(BatchNormalization())
    # relu激活
    model.add(Activation('relu'))
    # 池化层
    model.add(AveragePooling1D(pool_size=3, strides=3, padding='same'))
    model.add(Dropout(0.5))

    # LSTM layer
    model.add(LSTM(128))
    model.add(Dropout(0.5))
    model.add(Dense(1))

    # 编译模型
    model.compile(optimizer=Adam(), loss='mse')

    return model


# T-T模型
model = create_model(33, 3)
model.summary()

# T&P-N
model = create_model(48, 6)
model.summary()

# N-N模型
model = create_model(16, 3)
model.summary()
N-N模型的网络结构运行结果如下:
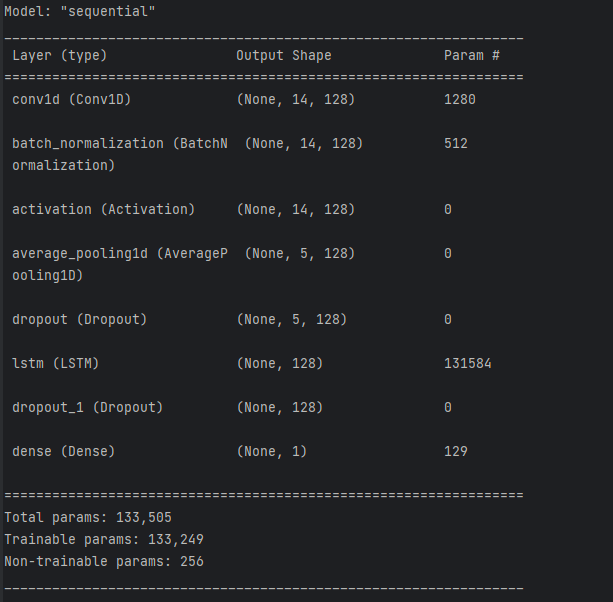
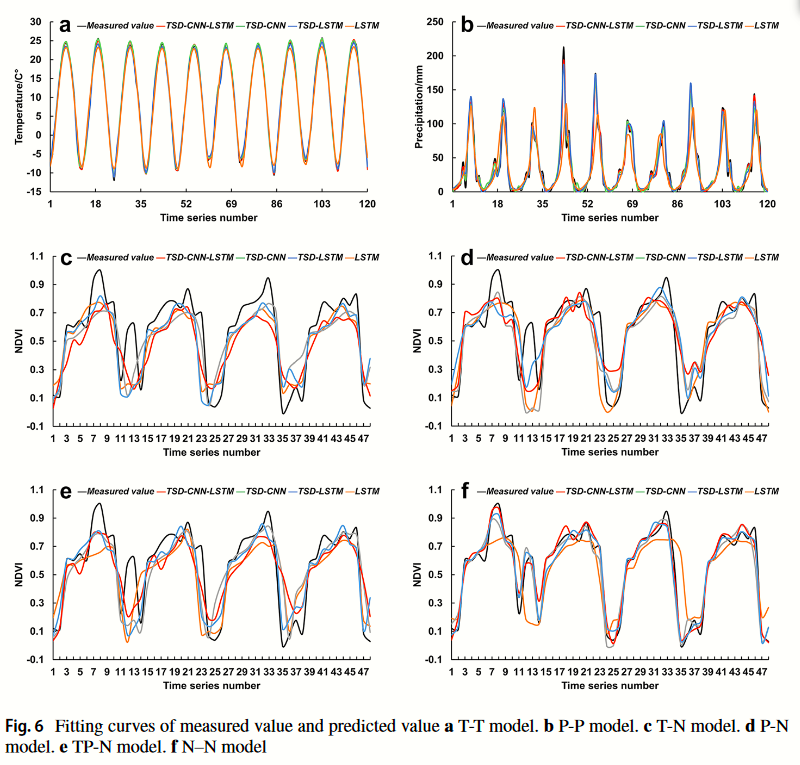
应该说基本上一致,需要注意模型中的池化是平均池化,这个在论文的架构图没有提及但是在文字上说明了。其实模型各个命名整篇论文都没有说明,仅仅只是说明了一下全称例如N-N模型是NDVI-NDVI模型,但是并没有过多解释。我的理解是输入和输出,即输入的数据仅仅包含NDVI,那么就是N开始,打算预测或者模型输出的数据集是NDVI,那么就以NDVI结尾。这里纠结了我有一大会,因为论文题目是NDVI的预测,那么照此T-T模型就应该是输入温度数据然后预测温度数据,似乎和论文不符合,好在后面的图说明了确实是预测的温度:
至于论文还提及了很多其它东西例如趋势指数Hurst、皮尔逊系数、除TCL: TSD-CNN-LSTM外的TC: TSD-CNN; TL: TSD-LSTM等模型······
好了时间不多了,有时间再更新


 2636
2636


 被折叠的 条评论
为什么被折叠?
被折叠的 条评论
为什么被折叠?
 到【灌水乐园】发言


