


✅作者简介:热爱科研的Matlab仿真开发者,修心和技术同步精进,matlab项目合作可私信。
🍎个人主页:Matlab科研工作室
🍊个人信条:格物致知。
更多Matlab仿真内容点击👇
⛄ 内容介绍
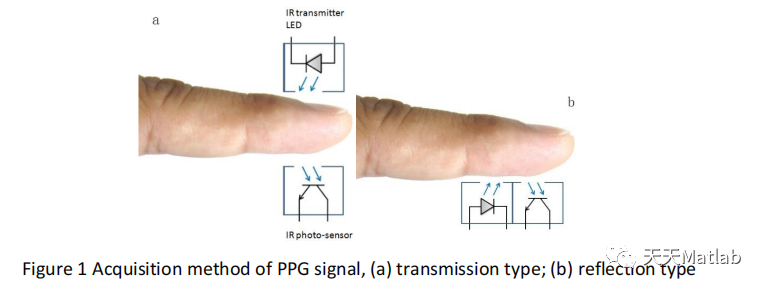
PPG是一种新兴的光学技术,用于检测心脏引起的血容量变化,在身体周边部位的微血管床,如手指、前额、耳垂和脚趾。这项技术是基于使用一个光学传感器,向皮肤发射光,然后接收透射或反射的光、接收透射或反射的光。
因此,PPG检测由心血管系统产生的活动,这些活动是通过自律神经系统介导的。通过自律神经系统。PPG信号是前向传播的和反射的血容量波的总和。
根据朗伯-比尔定律,PPG信号与血液的光吸收率和 与血液对光的吸收率相关,并代表血容量的变化。PPG信号的交流成分 PPG信号的交流成分与动脉内的血量变化有关,并与心跳同步。
在这方面,PPG信号融合了关于心脏周期和血液传输的宝贵信息。因此,这种技术代表了一种有前途的、低成本的技术,可以 应用于心血管监测的各个方面,如检测血氧饱和度、心率、血压、心输出量、呼吸、血管评估、动脉顺应性、动脉老化、内皮功能、静脉评估、微血管血流、自律神经等功能。
⛄ 部分代码
%%%%%%%%%%%%%%%%%%%%%%%%%%%%%%%%%%%%%%%%%%%
% PPG Feature Extraction
% Function Name:
% Last update date:
%%%%%%%%%%%%%%%%%%%%%%%%%%%%%%%%%%%%%%%%%%%
%PPG Feature Point Name
%PPG : O S N D
%VPG : w y z
%APG : a b c d e
%% Turotial 2 : Start Here
%set the search path for the subfunction
addpath(genpath(pwd));
pwd;
clc;
close all;
%% flag
flag_plot_figure = 1;
%% initialization variable
error_code = 0;
sample_time = 0.001; %sencond
%% %%%%%%%%%%%%%%%%%%%%%%%% Code Area %%%%%%%%%%%%%%%%%%%%%%%%%%%%%%%
% Signal Data Index----change as your data path
path.data = '.\DATA\';
path.output = '.\OUTPUT\';
path.T3_data = '..\T3_Classification\DATA\';
path.subject_info = '.\DATA\subject_info\';
D = dir('.\DATA\*.txt');
disp(length(D));
delete([path.output 'BP_PPG_Feature_dataset.csv']);
delete([path.output 'BP_PPG_discard_record.csv']);
for subject_index = 1:1:length(D)
disp(subject_index);
error_code = 0;
filename = D(subject_index).name;
[subject.num,wavedata] = load_wave(path.data,filename);
subject_data = load([path.subject_info 'PPG_BP.txt']);
[error_code,subject.info] = read_subject_info(error_code,subject.num,subject_data);
wave.ppg_raw = zscore(wavedata);
%% Filtering PPG signal
[wave.ppg,filter_SOS] = filter_home_bandpass(wave.ppg_raw,1,2,1000,0.5,10);
%% Calculate SQI
S_SQI_ppg = ppg_sqi(wave.ppg);
[SQI_max_ppg,SQI_window_ppg] = ppg_window_sqi(wave.ppg);
[SQI_max_ppg,Index_ppg] = max(SQI_window_ppg);
%% vpg, apg, 3rd, 4th
[wave.vpg,wave.apg,wave.third,wave.fourth] = multi_derivative(wave.ppg);
wave.vpg = zscore(wave.vpg);
wave.apg = zscore(wave.apg);
wave.third = zscore(wave.third);
wave.fourth = zscore(wave.fourth);
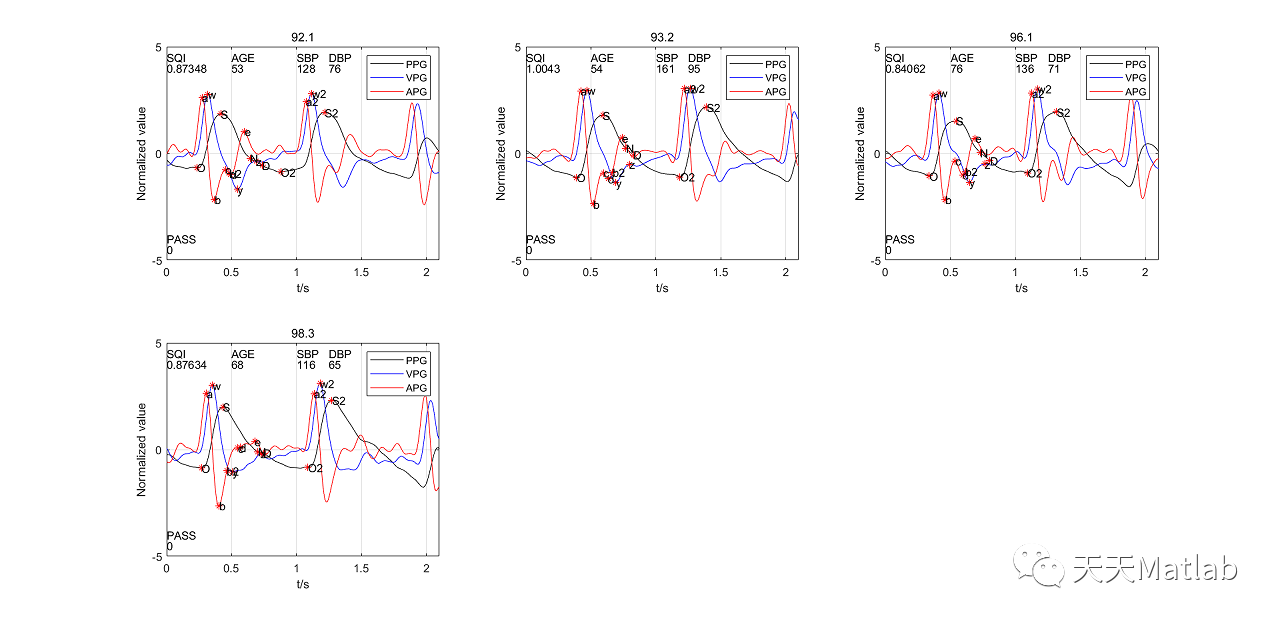
%% PPG Feature point extraction
[error_code,Loc.PPG,Loc.VPG,Loc.APG] = ppg_point_extraction(error_code,wave.ppg,wave.vpg,wave.apg,wave.third);
%If you have done this step, you can establish your model to classification or prediction next step.
%Please put the dataset file to the 'T3_Classification\DATA' folder.
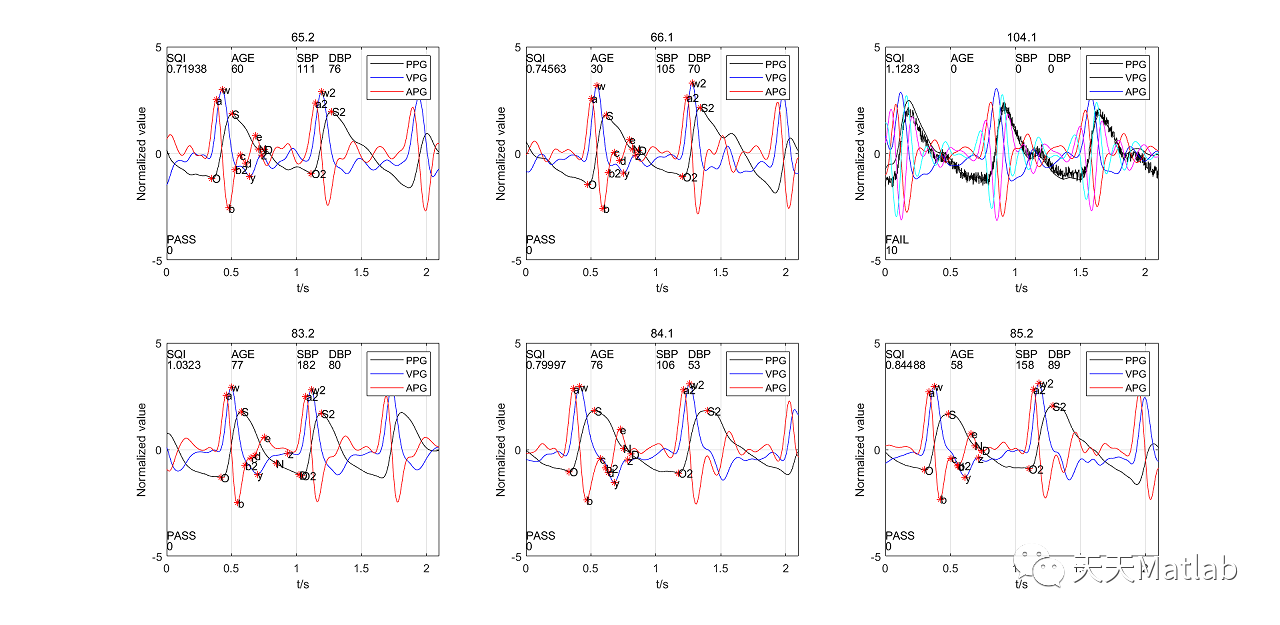
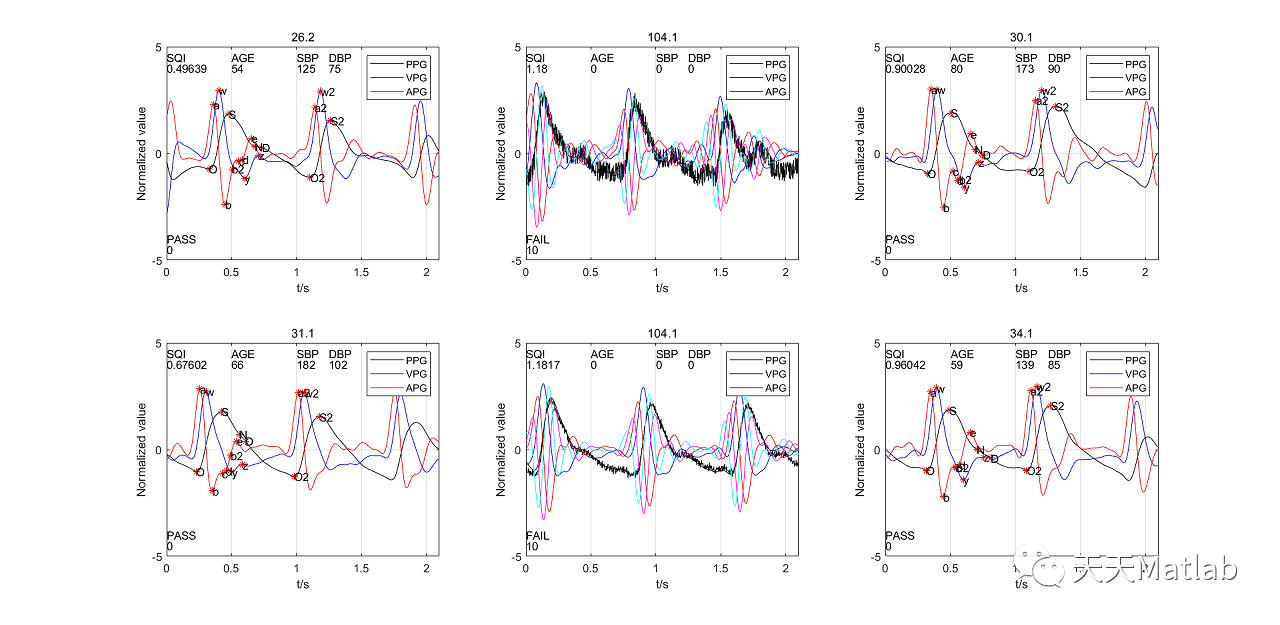
%If you want to watch or check the extracted PPG point, you can set 'flag_plot_figure' to be 1 in the start of code.
%% watch the waveform and SQI value
if flag_plot_figure == 1
if error_code == 0
plot_multi(subject_index,2,3);
n = 1:1:length(wave.ppg);
plot(n*sample_time,wave.ppg,'k',n*sample_time,wave.vpg,'b',n*sample_time,wave.apg,'r',...
...%n*sample_time,wave.third,'m',...
...%n*sample_time,wave.fourth,'c',...
Loc.PPG*sample_time,wave.ppg(Loc.PPG),'*r',...
Loc.VPG*sample_time,wave.vpg(Loc.VPG),'*r',...
Loc.APG*sample_time,wave.apg(Loc.APG),'*r');
legend('PPG','VPG','APG');
axis([0 length(wave.ppg)*sample_time -5 5]);
title(subject.num);
text(0,4.5,'SQI');
text(0,4,num2str(SQI_max_ppg));
text(0.5,4.5,'AGE');
text(0.5,4,num2str(subject.info(3))); %age
text(1,4.5,'SBP');
text(1,4,num2str(subject.info(6))); %SBP
text(1.25,4.5,'DBP');
text(1.25,4,num2str(subject.info(7))); %SBP
text(0,-4,'PASS');
text(0,-4.5,num2str(error_code));
%%show the PPG points
text(Loc.PPG(1)*sample_time,wave.ppg(Loc.PPG(1)),'O');
text(Loc.PPG(2)*sample_time,wave.ppg(Loc.PPG(2)),'S');
text(Loc.PPG(3)*sample_time,wave.ppg(Loc.PPG(3)),'N');
text(Loc.PPG(4)*sample_time,wave.ppg(Loc.PPG(4)),'D');
text(Loc.PPG(5)*sample_time,wave.ppg(Loc.PPG(5)),'O2');
text(Loc.PPG(6)*sample_time,wave.ppg(Loc.PPG(6)),'S2');
text(Loc.VPG(1)*sample_time,wave.vpg(Loc.VPG(1)),'w');
text(Loc.VPG(2)*sample_time,wave.vpg(Loc.VPG(2)),'y');
text(Loc.VPG(3)*sample_time,wave.vpg(Loc.VPG(3)),'z');
text(Loc.VPG(4)*sample_time,wave.vpg(Loc.VPG(4)),'w2');
text(Loc.APG(1)*sample_time,wave.apg(Loc.APG(1)),'a');
text(Loc.APG(2)*sample_time,wave.apg(Loc.APG(2)),'b');
text(Loc.APG(3)*sample_time,wave.apg(Loc.APG(3)),'c');
text(Loc.APG(4)*sample_time,wave.apg(Loc.APG(4)),'d');
text(Loc.APG(5)*sample_time,wave.apg(Loc.APG(5)),'e');
text(Loc.APG(6)*sample_time,wave.apg(Loc.APG(6)),'a2');
text(Loc.APG(7)*sample_time,wave.apg(Loc.APG(7)),'b2');
xlabel('t/s');
ylabel('Normalized value');
grid on;
hold on;
else
plot_multi(subject_index,2,3);
n = 1:1:length(wave.ppg);
plot(n*sample_time,wave.ppg_raw,'k',n*sample_time,wave.ppg,'k',...
n*sample_time,wave.vpg,'b',n*sample_time,wave.apg,'r',...
n*sample_time,wave.third,'m',n*sample_time,wave.fourth,'c');
legend('PPG','VPG','APG');
axis([0 length(wave.ppg)*sample_time -5 5]);
title(subject_num);
text(0,4.5,'SQI');
text(0,4,num2str(SQI_max_ppg));
text(0.5,4.5,'AGE');
text(0.5,4,num2str(subject.info(3))); %age
text(1,4.5,'SBP');
text(1,4,num2str(subject.info(6))); %SBP
text(1.25,4.5,'DBP');
text(1.25,4,num2str(subject.info(7))); %SBP
text(0,-4,'FAIL');
text(0,-4.5,num2str(error_code));
xlabel('t/s');
ylabel('Normalized value');
grid on;
hold on;
end
end
end
% Finish to extract ppg feature
%%%%%%%%%%%%%%%%%%%%%%%%%%%%%%%%%%%%%%%%%%
%% Turotials 2 : Stop Here
⛄ 运行结果
⛄ 参考文献
1 Elgendi, M. On the analysis of fingertip photoplethysmogram signals. Current cardiology reviews 8, 14-25 (2012).
2 Alian, A. A. & Shelley, K. H. Photoplethysmography: Analysis of the Pulse Oximeter Waveform.
165-178, doi:10.1007/978-1-4614-8557-5_19 (2014).
3 Shelley, K. H. Photoplethysmography: beyond the calculation of arterial oxygen saturation and
heart rate. Anesthesia and analgesia 105, S31-36, tables of contents,
doi:10.1213/01.ane.0000269512.82836.c9 (2007).
4 Alian, A. A. & Shelley, K. H. Photoplethysmography. Best practice & research. Clinical
anaesthesiology 28, 395-406, doi:10.1016/j.bpa.2014.08.006 (2014).
5 Allen, J. & Murray, A. Age-related changes in peripheral pulse timing characteristics at the ears,
fingers and toes. Journal of human hypertension 16, 711-717, doi:10.1038/sj.jhh.1001478
(2002).
6 Murray, J. A. a. A. Age-related changes in the characteristics of the photoplethysmographic
pulse shape at various body sites. Physiological measurement, 24, 297-307 (2003).
⛳️ 完整代码
❤️部分理论引用网络文献,若有侵权联系博主删除
❤️ 关注我领取海量matlab电子书和数学建模资料


 2075
2075

 被折叠的 条评论
为什么被折叠?
被折叠的 条评论
为什么被折叠?
 到【灌水乐园】发言


