


这篇帖子的前身可以追溯到:玩转单细胞(2):Seurat批量做图修饰。当时有人问了一个问题,可以添加显著性吗?我们的回答是你需要提取相关组的表达量,进行检验后再用ggplot函数添加即可;或者直接提取数据用ggplot作图那么显著添加也就不成问题了。时隔3月,我们这里提供 了一种函数,可以进行基因在两组之间的显著性分析。同时可进行批量的基因分析。并输出dataframe结果。同时直接在Vlnplot下循环添加显著性。但缺点是只能进行两组比较分析。完整代码已上传群文件! 一般的seurat小提琴图绘制:
library(Seurat)
library(ggplot2)
library(ggpubr)
library(dplyr)

VlnPlot(mouse_data, features = 'S100a8', group.by = 'orig.ident')+
  theme_classic() +
  theme(axis.text.x = element_text(size = 10,color="black"),
        axis.text.y = element_text(size = 10,color="black"),
        axis.title.y= element_text(size=12,color="black"),
        axis.title.x = element_blank(),
        legend.position='none')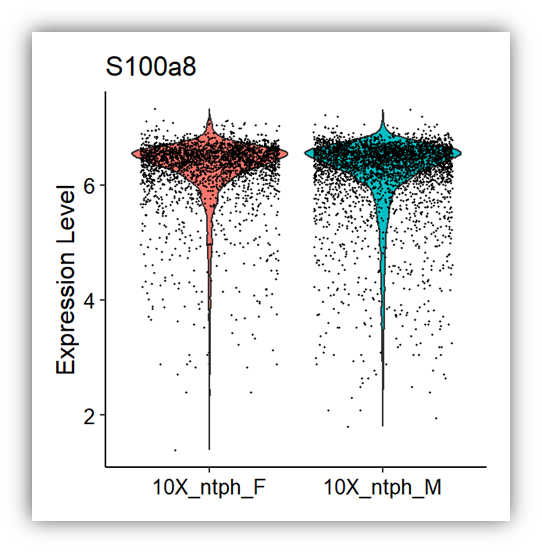
显著性检验函数,有点长,可自行保存成R文件,然后每次使用的时候source一下就可以了。
singlecell_gene_test <- function(SerautObj,
                           genes.use,
                           group.by=NULL,
                           assay = "RNA",
                           comp = NULL,
                           alpha_start = .05,
                           Bonferroni = T,
                           only_postive =F) {
  p_val.out <- c()
  stat.out <- c()
  condition.out <- c()
  gene.out <- c()
  if (only_postive == F){
    for (gene in genes.use){
      group1_cellname = rownames(SerautObj@meta.data[SerautObj@meta.data[[group.by]] == comp[1],])
      group1_exp = SerautObj@assays[[assay]]@data[gene, group1_cellname]

      group2_cellname = rownames(SerautObj@meta.data[SerautObj@meta.data[[group.by]] == comp[2],])
      group2_exp = SerautObj@assays[[assay]]@data[gene, group2_cellname]
      t_out = t.test(group1_exp, group2_exp)
      cond = paste(comp[1], comp[2], sep = "_")
      condition.out <- c(condition.out, cond)
      stat.out <- c(stat.out, t_out[["statistic"]])
      p_val.out <- c(p_val.out, t_out[["p.value"]])
      gene.out <- c(gene.out, gene)
    }
  }
    else{
      for (gene in genes.use){
        group1_cellname = rownames(SerautObj@meta.data[SerautObj@meta.data[[group.by]] == comp[1],])
        group1_exp = SerautObj@assays[[assay]]@data[gene, group1_cellname]
        group1_exp <- group1_exp[which(group1_exp>0)]


        group2_cellname = rownames(SerautObj@meta.data[SerautObj@meta.data[[group.by]] == comp[2],])
        group2_exp = SerautObj@assays[[assay]]@data[gene, group2_cellname]
        group2_exp <- group2_exp[which(group2_exp>0)]

        t_out = t.test(group1_exp, group2_exp)
        cond = paste(comp[1], comp[2], sep = "_")
        condition.out <- c(condition.out, cond)
        stat.out <- c(stat.out, t_out[["statistic"]])
        p_val.out <- c(p_val.out, t_out[["p.value"]])
        gene.out <- c(gene.out, gene)
      }

  }

  if (Bonferroni == T){
    new_alpha = alpha_start/(2*length(genes.use))
    cat(paste("\n", "P-value for significance: p <", new_alpha, "\n"))
    sig_out = p_val.out < new_alpha
    dfOUT<- data.frame(gene=gene.out, condition = condition.out, p_val = p_val.out, statistic = stat.out, significant = sig_out)

    dfOUT$sig = ifelse(dfOUT$p_val > 0.05, "ns",
                       ifelse(dfOUT$p_val > 0.01, '*',
                              ifelse(dfOUT$p_val > 0.001, "**", "****")))

    }

  else{
    dfOUT<- data.frame(gene=gene.out, condition = condition.out, p_val = p_val.out, statistic = stat.out)
    dfOUT$sig = ifelse(dfOUT$p_val > 0.05, "ns",
                       ifelse(dfOUT$p_val > 0.01, '*',
                              ifelse(dfOUT$p_val > 0.001, "**", "****")))
  }

  return(dfOUT)
}
显著性检验:
A <- singlecell_gene_test(mouse_data,
                    genes.use = c('S100a8','Ltf','Ncf1','Ly6g','Anxa1','Il1b'),
                    group.by = 'orig.ident',
                    comp = c("10X_ntph_F", "10X_ntph_M"))

A1 <- singlecell_gene_test(mouse_data,
                          genes.use = c('S100a8','Ltf','Ncf1','Ly6g','Anxa1','Il1b'),
                          group.by = 'orig.ident',
                          comp = c("10X_ntph_F", "10X_ntph_M"),
                          only_postive = T)
作图即可:
anno_pvalue <- format(A$p_val, scientific = T,digits = 3)
anno_sig <- A$sig

plots_violins <- VlnPlot(mouse_data,
                         cols = c("limegreen", "navy"),
                         pt.size = 0,
                         group.by = "orig.ident",
                         features = c('S100a8','Ltf','Ncf1','Ly6g','Anxa1','Il1b'),
                         ncol = 3,
                         log = FALSE,
                         combine = FALSE)

for(i in 1:length(plots_violins)) {
  data <- plots_violins[[i]]$data
  colnames(data)[1] <- 'gene'
  plots_violins[[i]] <- plots_violins[[i]] +
    theme_classic() +
    theme(axis.text.x = element_text(size = 10,color="black"),
          axis.text.y = element_text(size = 10,color="black"),
          axis.title.y= element_text(size=12,color="black"),
          axis.title.x = element_blank(),
          legend.position='none')+
    scale_y_continuous(expand = expansion(mult = c(0.05, 0.1)))+
    scale_x_discrete(labels = c("Female","Male"))+
    geom_signif(annotations = anno_sig[i],
                y_position = max(data$gene)+0.5,
                xmin = 1,
                xmax = 2,
                tip_length = 0)
}

CombinePlots(plots_violins)
或者添加p值:
plots_violins <- VlnPlot(mouse_data,
                         cols = c("limegreen", "navy"),
                         pt.size = 0,
                         group.by = "orig.ident",
                         features = c('S100a8','Ltf','Ncf1','Ly6g','Anxa1','Il1b'),
                         ncol = 3,
                         log = FALSE,
                         combine = FALSE)
for(i in 1:length(plots_violins)) {
  data <- plots_violins[[i]]$data
  colnames(data)[1] <- 'gene'
  plots_violins[[i]] <- plots_violins[[i]] +
    theme_classic() +
    theme(axis.text.x = element_text(size = 10,color="black"),
          axis.text.y = element_text(size = 10,color="black"),
          axis.title.y= element_text(size=12,color="black"),
          axis.title.x = element_blank(),
          legend.position='none')+
    scale_y_continuous(expand = expansion(mult = c(0.05, 0.1)))+
    scale_x_discrete(labels = c("Female","Male"))+
    geom_signif(annotations = anno_sig[i],
                y_position = max(data$gene)+0.5,
                xmin = 1,
                xmax = 2,
                tip_length = 0)
}

CombinePlots(plots_violins)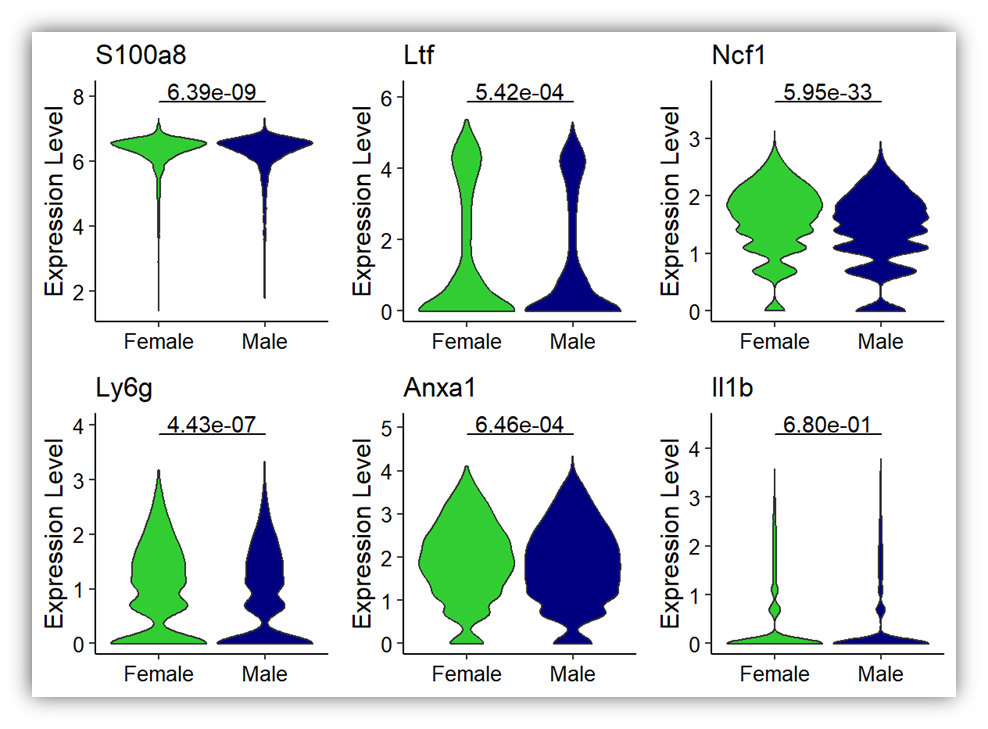
好了。这就是所有内容了,其实这样检验你用不用得到倒是其次,主要是这里面包含一些小的细节知识点,学会了就能和其他内容融汇贯通了,自己感悟吧!更多精彩内容请至KS科研分享与服务公众号


 1100
1100


 被折叠的 条评论
为什么被折叠?
被折叠的 条评论
为什么被折叠?
 到【灌水乐园】发言


