


 本文介绍了RANSAC算法的基本概念,步骤,以及如何在Python中实现直线拟合,特别关注了如何使用RANSAC算法减少ORB特征点的误匹配。通过实例展示了如何利用RANSAC剔除匹配中的噪声点,提高特征匹配的准确性。
02 RANSAC算法 及 Python 实现
2.1 简介
RANSAC (Random Sample Consensus,随机抽样一致)算法的 基本假设 是样本中包含正确数据(inliers即内点,可以被模型描述的数据),也包含异常数据(outliers 即外点,偏离正常范围很远、无法适应数学模型的数据),也就是说数据集中含有噪声。
我们的目的就是找出 使内点最多的模型参数(类似最小二乘法,最小二乘法试图找到满足所有点的参数,而 RANSAC 是为了消除误匹配,尽量找到更多内点,去除外点)。
2.2 算法流程
RANSAC 是通过反复选择数据集去估计出模型参数,一直迭代到估计出认为比较好的模型。
具体的实现步骤可以分为以下几步:
(1)选择出可以估计出模型的最小数据集;(对于直线拟合来说就是两个点,对于计算单应矩阵就是 4 个点);
(2)使用这个最小数据集计算出模型参数;
(3)将所有数据带入这个模型,计算并记录“内点”的数目(在误差允许范围内的点的数目);
(4)与之前记录的最好模型的“内点”数量进行比较,若表现更好,则将此模型更新为最优模型;
(5)重复以上步骤,直至达到最大迭代次数或“内点”数量满足要求。
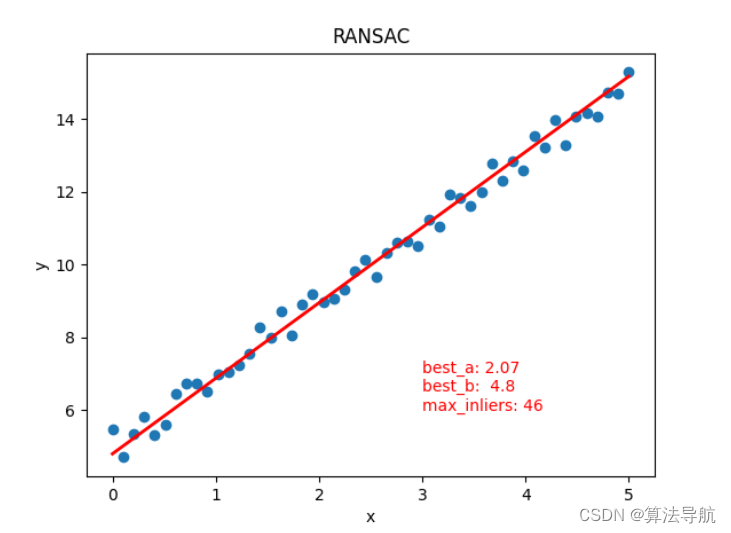
2.3 RANSAC 算法实现直线拟合
# @Time : 2022/11/7 20:11
# @Author : xiao cong
# @Function : RANSAC 算法实现直线拟合

import numpy as np
import matplotlib.pyplot as plt
import random


ITERS = 1000            # 最大迭代次数
SIZE = 50               # 样本数量
RATIO = 0.6             # 期望为内点的比例
INLIERS = SIZE * RATIO  # 内点

# 生成样本数据
X = np.linspace(0, 5, SIZE)
Y = 2 * X + 5
for index in range(SIZE):
    sigma = np.random.uniform(-0.5, 0.5)  # 生成高斯噪声
    Y[index] += sigma


# 绘散点图
plt.figure()
plt.scatter(X, Y)
plt.xlabel("x")
plt.ylabel("y")

# 使用 RANSAC 算法估算模型
iter = 0  # 迭代次数
max_inliers = 0  # 先前最多内点数量
best_a = 0  # 最优参数
best_b = 0
error = 0.5  # 允许最小误差

while iter <= ITERS and max_inliers < INLIERS:

    # 随机选取两个点,计算模型参数
    random_index = random.sample(range(0, SIZE), 2)  # 返回索引列表
    x1 = X[random_index[0]]
    y1 = Y[random_index[0]]
    x2 = X[random_index[1]]
    y2 = Y[random_index[1]]

    a = (y2 - y1) / (x2 - x1)  # 斜率
    b = y1 - a * x1  # 截距
    inliers = 0  # 本次内点数量

    # 代入模型,计算内点数量
    for index in range(SIZE):
        y_estimate = a * X[index] + b
        if abs(Y[index] - y_estimate) <= error:
            inliers += 1

    if inliers >= max_inliers:
        best_a = a
        best_b = b
        max_inliers = inliers

    iter += 1


# 画出拟合直线
Y_estimate = best_a * X + best_b
plt.plot(X, Y_estimate, linewidth=2.0, color="r")
text = "best_a: " + str(round(best_a, 2)) + "\nbest_b:  " + str(round(best_b, 2)) + \
       "\nmax_inliers: " + str(int(max_inliers))
plt.text(3, 6, text, fontdict={'size': 10, 'color': 'r'})
plt.title("RANSAC")
plt.show()
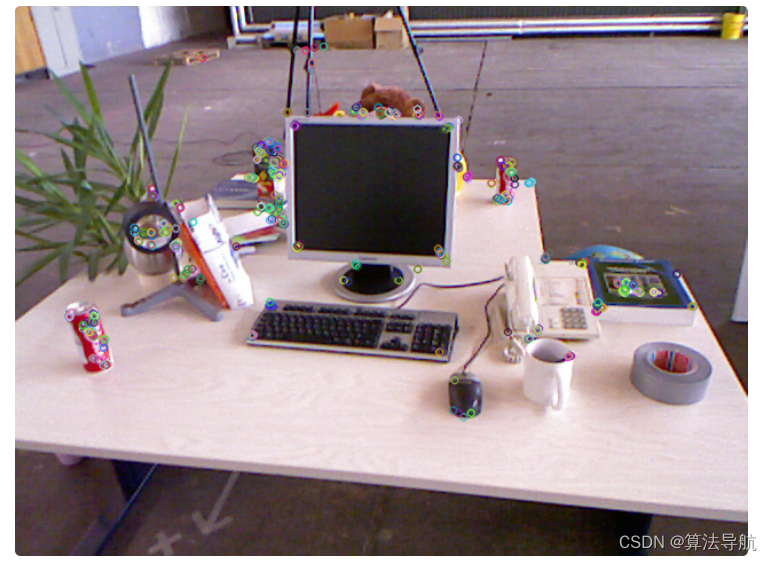
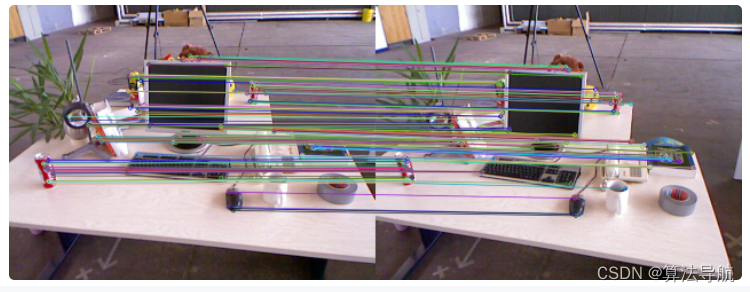
2.4 利用 RANSAC 算法减少 ORB 特征点误匹配
特征点匹配会有很多误匹配的点,所以求出基础矩阵 F \boldsymbol{F} F,用它来做更精准的匹配。这里以 ORB 为例,FAST 特征点就是 RANSAC 算法的数据样本。
由 对极约束,得到
p 2 T F p 1 = 0 \boldsymbol{p_2^{\mathrm{T}}}\boldsymbol{F}\boldsymbol{p_1}=0 p2TFp1=0
其中, p 1 \boldsymbol{p_1} p1、 p 2 \boldsymbol{p_2} p2 为匹配点的像素坐标 。
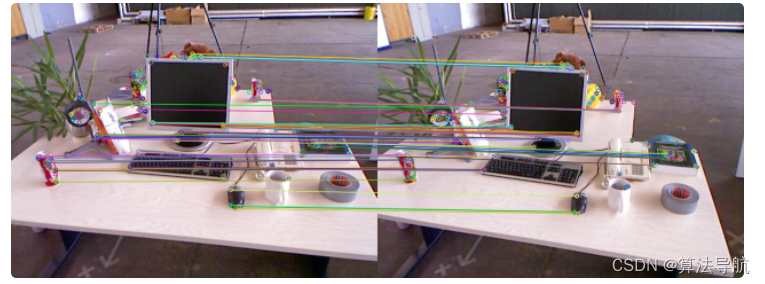
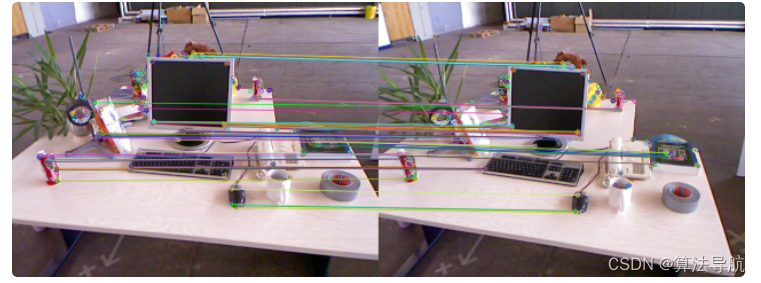
分别为 ORB_features.png*、all_matches.png、goodmatches.png、*after_RANSAC.png.
#include <iostream>
#include <opencv2/features2d.hpp>
#include <opencv2/opencv.hpp>


using namespace std;
using namespace cv;

int main()
{
    // 读取图像
    Mat img_01 = imread("/home/cong/slambook_code/test/img_01.png");
    Mat img_02 = imread("/home/cong/slambook_code/test/img_02.png");

    // 提取 ORB 特征点
    vector<KeyPoint> keypoints_01, keypoints_02;         // FAST 特征点
    Mat descriptors_01, descriptors_02;                  // BRIEF 描述子
    Ptr<FeatureDetector> detector = ORB::create();       // 初始化
    Ptr<DescriptorExtractor> descriptor = ORB::create();
    Ptr<DescriptorMatcher> matcher = DescriptorMatcher::create("BruteForce-Hamming");

    //-- 第一步:检测 Oriented FAST 角点位置
    detector->detect(img_01, keypoints_01);
    detector->detect(img_02, keypoints_02);

    //-- 第二步:根据角点位置计算 BRIEF 描述子
    descriptor->compute(img_01, keypoints_01, descriptors_01);
    descriptor->compute(img_02, keypoints_02, descriptors_02);

    Mat outimg_01;
    drawKeypoints(img_01, keypoints_01, outimg_01, Scalar::all(-1), DrawMatchesFlags::DEFAULT);
    imwrite("ORB_features.png", outimg_01);
    imshow("ORB features", outimg_01);


    //-- 第三步:对两幅图像中的BRIEF描述子进行匹配,计算 Hamming 距离
    // matches 用来存储匹配点对的信息,包括
    //queryIdx:测试图像的特征点描述符的下标
    //trainIdx:样本图像的特征点描述符下标
    //distance:特征点描述子的欧式距离
    vector<DMatch> matches;
    matcher->match(descriptors_01, descriptors_02, matches);


    //-- 第四步:匹配点对筛选(距离过大的一对点将被认为误匹配)
    // 找出所有匹配之间的最小距离和最大距离, 即最相似的和最不相似的两组点之间的距离
    auto min_max = minmax_element(matches.begin(), matches.end(),
                                  [] (const DMatch &m1, const DMatch &m2) {return m1.distance < m2.distance;});

    double min_dist = min_max.first->distance;
    double max_dist = min_max.second->distance;

    //当描述子之间的距离大于两倍的最小距离时,即认为匹配有误.
    // 但有时候最小距离会非常小,设置一个经验值30作为下限.
    vector<DMatch> good_matches;
    for(int i = 0; i < descriptors_01.rows; i++)
    {
        if(matches[i].distance <= max(2*min_dist, 30.0))
            good_matches.push_back(matches[i]);
    }

    //-- 第五步:绘制匹配结果
    Mat img_match;
    Mat img_goodmatch;
    drawMatches(img_01, keypoints_01, img_02, keypoints_02, matches, img_match);
    drawMatches(img_01, keypoints_01, img_02, keypoints_02, good_matches, img_goodmatch);
    imwrite("all_matches.png", img_match);
    imwrite("good_matches.png", img_goodmatch);
    imshow("all matches", img_match);
    imshow("good matches", img_goodmatch);


    /*******************************************************************/
    // 下面用 RANSAC 算法去除误匹配
    // 主要分为三个部分:
    // 1)根据matches将特征点对齐,将坐标转换为float类型
    // 2)使用求基础矩阵方法 findFundamentalMat,得到RansacStatus
    // 3)根据RansacStatus来将误匹配的点也即RansacStatus[i]=0的点删除


    // 1)根据 matches 将特征点对齐(也就是 使对应的一对特征点的下标相同)
    vector<KeyPoint> R_keypoint_01, R_keypoint_02;        // 存储对应的特征点
    for(size_t i = 0; i < matches.size(); i++)
    {
        R_keypoint_01.push_back(keypoints_01[matches[i].queryIdx]);     // 存储img01中能与img02匹配的特征点的索引值
        R_keypoint_02.push_back(keypoints_02[matches[i].trainIdx]);
    }

    // 像素坐标转换成 float
    vector<Point2f> p01, p02;
    for(size_t i = 0; i < matches.size(); i++)
    {
        p01.push_back(R_keypoint_01[i].pt);          // 坐标
        p02.push_back(R_keypoint_02[i].pt);
    }

    // 利用基础矩阵剔除误匹配点
    vector<uchar> RansacStatus;
    Mat Fundamental = findFundamentalMat(p01, p02, RansacStatus, FM_RANSAC);

    vector<KeyPoint> RR_keypoint_01, RR_keypoint_02;
    vector<DMatch> RR_matches;                         // 筛选后的匹配点
    int index = 0;
    for(size_t i = 0; i < matches.size(); i++)
    {
        if(RansacStatus[i] != 0)
        {
            RR_keypoint_01.push_back(R_keypoint_01[i]);
            RR_keypoint_02.push_back(R_keypoint_02[i]);
            matches[i].queryIdx = index;
            matches[i].trainIdx = index;
            RR_matches.push_back(matches[i]);
            index++;
        }
    }

    Mat img_RR_matches;
    drawMatches(img_01, RR_keypoint_01, img_02, RR_keypoint_02, RR_matches, img_RR_matches);
    imwrite("after_RANSAC.png", img_RR_matches);
    imshow("after RANSAC", img_RR_matches);
    waitKey(0);


    return 0;
}


 884
884

 被折叠的 条评论
为什么被折叠?
被折叠的 条评论
为什么被折叠?
 到【灌水乐园】发言


