


课程学习来源:b站up:【蚂蚁学python】
【课程链接:【【数据可视化】Python数据图表可视化入门到实战】】
【课程资料链接:【链接】】
python:3.12.3
所有库都使用最新版。
直接使用视频课程的代码可能无法正常运行显示出图片,本专栏的学习对代码进行了一定程度的补充以满足当前最新的环境。
Python绘制热力图查看两个分类变量之间的强度分布
热力图(heat map)
热力图(或者色块),由小色块组成的二维图表,其中:
- x、y轴可以是分类变量,对应的小方块由连续数值表示颜色强度
- 即,用两个分类字段确定数值的位置,用于展示数据的分布情况
import pandas as pd
import numpy as np
import matplotlib.pyplot as plt
import seaborn as sns

sns.set() # 设置默认样式
sns.set_style("whitegrid", {"font.sans_serif":["simhei", "Arial"]}) # 白色单线格,且展示中文
sns.set(font="simhei")#遇到标签需要汉字的可以在绘图前加上这句
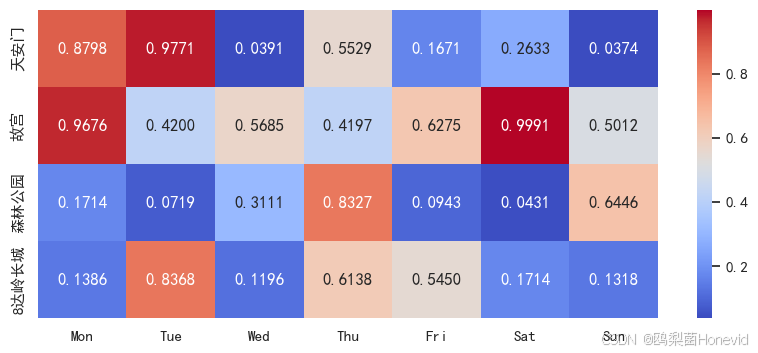
实例1:绘制北京景区热度图
df = pd.DataFrame(
    np.random.rand(4,7),
    index = ["天安门","故宫","森林公园","8达岭长城"],
    columns = ["Mon","Tue","Wed","Thu","Fri","Sat","Sun"]
)

df
| Mon | Tue | Wed | Thu | Fri | Sat | Sun | |
|---|---|---|---|---|---|---|---|
| 天安门 | 0.879782 | 0.977070 | 0.039145 | 0.552947 | 0.167143 | 0.263271 | 0.037447 |
| 故宫 | 0.967603 | 0.419968 | 0.568461 | 0.419740 | 0.627485 | 0.999079 | 0.501211 |
| 森林公园 | 0.171358 | 0.071910 | 0.311129 | 0.832736 | 0.094337 | 0.043086 | 0.644590 |
| 8达岭长城 | 0.138646 | 0.836821 | 0.119627 | 0.613812 | 0.545048 | 0.171446 | 0.131791 |
plt.figure(figsize=(10,4))
sns.heatmap(df, annot=True, fmt=".4f", cmap = "coolwarm")
<Axes: >
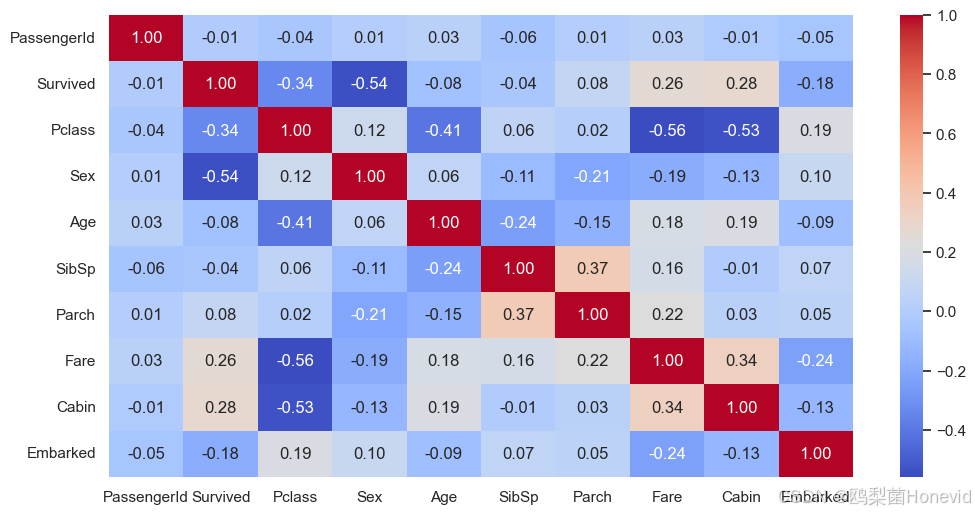
实例2:绘制泰坦尼克事件与存亡变量的关系
# 读取并合并泰坦尼克数据
df = pd.concat(# concat实现按行合并
    [
        pd.read_csv("../DATA_POOL/PY_DATA/ant-learn-visualization-master/datas/titanic/titanic_train.csv"),
        pd.read_csv("../DATA_POOL/PY_DATA/ant-learn-visualization-master/datas/titanic/titanic_test.csv")
    ]
)
df.head()
| PassengerId | Survived | Pclass | Name | Sex | Age | SibSp | Parch | Ticket | Fare | Cabin | Embarked | |
|---|---|---|---|---|---|---|---|---|---|---|---|---|
| 0 | 1 | 0.0 | 3 | Braund, Mr. Owen Harris | male | 22.0 | 1 | 0 | A/5 21171 | 7.2500 | NaN | S |
| 1 | 2 | 1.0 | 1 | Cumings, Mrs. John Bradley (Florence Briggs Th... | female | 38.0 | 1 | 0 | PC 17599 | 71.2833 | C85 | C |
| 2 | 3 | 1.0 | 3 | Heikkinen, Miss. Laina | female | 26.0 | 0 | 0 | STON/O2. 3101282 | 7.9250 | NaN | S |
| 3 | 4 | 1.0 | 1 | Futrelle, Mrs. Jacques Heath (Lily May Peel) | female | 35.0 | 1 | 0 | 113803 | 53.1000 | C123 | S |
| 4 | 5 | 0.0 | 3 | Allen, Mr. William Henry | male | 35.0 | 0 | 0 | 373450 | 8.0500 | NaN | S |
df.info()
<class 'pandas.core.frame.DataFrame'>
Index: 1309 entries, 0 to 417
Data columns (total 12 columns):
 #   Column       Non-Null Count  Dtype
---  ------       --------------  -----
 0   PassengerId  1309 non-null   int64
 1   Survived     891 non-null    float64
 2   Pclass       1309 non-null   int64
 3   Name         1309 non-null   object
 4   Sex          1309 non-null   object
 5   Age          1046 non-null   float64
 6   SibSp        1309 non-null   int64
 7   Parch        1309 non-null   int64
 8   Ticket       1309 non-null   object
 9   Fare         1308 non-null   float64
 10  Cabin        295 non-null    object
 11  Embarked     1307 non-null   object
dtypes: float64(3), int64(4), object(5)
memory usage: 132.9+ KB
# pandas 把字符串类型的列,变成分类数字编码
for field in ["Sex", "Cabin", "Embarked"]:
    df[field] = df[field].astype("category").cat.codes
df.info()
<class 'pandas.core.frame.DataFrame'>
Index: 1309 entries, 0 to 417
Data columns (total 12 columns):
 #   Column       Non-Null Count  Dtype
---  ------       --------------  -----
 0   PassengerId  1309 non-null   int64
 1   Survived     891 non-null    float64
 2   Pclass       1309 non-null   int64
 3   Name         1309 non-null   object
 4   Sex          1309 non-null   int8
 5   Age          1046 non-null   float64
 6   SibSp        1309 non-null   int64
 7   Parch        1309 non-null   int64
 8   Ticket       1309 non-null   object
 9   Fare         1308 non-null   float64
 10  Cabin        1309 non-null   int16
 11  Embarked     1309 non-null   int8
dtypes: float64(3), int16(1), int64(4), int8(2), object(2)
memory usage: 107.4+ KB
df.head(3)
| PassengerId | Survived | Pclass | Name | Sex | Age | SibSp | Parch | Ticket | Fare | Cabin | Embarked | |
|---|---|---|---|---|---|---|---|---|---|---|---|---|
| 0 | 1 | 0.0 | 3 | Braund, Mr. Owen Harris | 1 | 22.0 | 1 | 0 | A/5 21171 | 7.2500 | -1 | 2 |
| 1 | 2 | 1.0 | 1 | Cumings, Mrs. John Bradley (Florence Briggs Th... | 0 | 38.0 | 1 | 0 | PC 17599 | 71.2833 | 106 | 0 |
| 2 | 3 | 1.0 | 3 | Heikkinen, Miss. Laina | 0 | 26.0 | 0 | 0 | STON/O2. 3101282 | 7.9250 | -1 | 2 |
# 计算不同变量之间两两的相关系数
num_cols = df.select_dtypes(include=[np.number]).columns
# num_cols选中数字类型的数据列进行计算

df[num_cols].corr()
| PassengerId | Survived | Pclass | Sex | Age | SibSp | Parch | Fare | Cabin | Embarked | |
|---|---|---|---|---|---|---|---|---|---|---|
| PassengerId | 1.000000 | -0.005007 | -0.038354 | 0.013406 | 0.028814 | -0.055224 | 0.008942 | 0.031428 | -0.012096 | -0.048530 |
| Survived | -0.005007 | 1.000000 | -0.338481 | -0.543351 | -0.077221 | -0.035322 | 0.081629 | 0.257307 | 0.277885 | -0.176509 |
| Pclass | -0.038354 | -0.338481 | 1.000000 | 0.124617 | -0.408106 | 0.060832 | 0.018322 | -0.558629 | -0.534483 | 0.192867 |
| Sex | 0.013406 | -0.543351 | 0.124617 | 1.000000 | 0.063645 | -0.109609 | -0.213125 | -0.185523 | -0.126367 | 0.104818 |
| Age | 0.028814 | -0.077221 | -0.408106 | 0.063645 | 1.000000 | -0.243699 | -0.150917 | 0.178740 | 0.190984 | -0.089292 |
| SibSp | -0.055224 | -0.035322 | 0.060832 | -0.109609 | -0.243699 | 1.000000 | 0.373587 | 0.160238 | -0.005685 | 0.067802 |
| Parch | 0.008942 | 0.081629 | 0.018322 | -0.213125 | -0.150917 | 0.373587 | 1.000000 | 0.221539 | 0.029582 | 0.046957 |
| Fare | 0.031428 | 0.257307 | -0.558629 | -0.185523 | 0.178740 | 0.160238 | 0.221539 | 1.000000 | 0.340217 | -0.241442 |
| Cabin | -0.012096 | 0.277885 | -0.534483 | -0.126367 | 0.190984 | -0.005685 | 0.029582 | 0.340217 | 1.000000 | -0.126482 |
| Embarked | -0.048530 | -0.176509 | 0.192867 | 0.104818 | -0.089292 | 0.067802 | 0.046957 | -0.241442 | -0.126482 | 1.000000 |
plt.figure(figsize = (12,6))
plt.rcParams['font.family'] = 'Arial' # 确保'-'号正常显示
sns.heatmap(df[num_cols].corr(), annot=True, fmt=".2f", cmap="coolwarm")
<Axes: >


 2339
2339

 被折叠的 条评论
为什么被折叠?
被折叠的 条评论
为什么被折叠?
 到【灌水乐园】发言


