


1.树模型
决策树:从根节点开始一步步走到叶子节点(决策)
所有的数据最终都会落到叶子节点,既可以做分类也可以做回归
2.树的组成
根节点:第一个选择点
非叶子节点与分支:中间过程
叶子节点:最终的决策结果
3.决策树的训练与测试
训练阶段:从给定的训练集构造出来一棵树(从跟节点开始选择特征, 如何进行特征切分)
测试阶段:根据构造出来的树模型从根节点一直走到叶子节点
如何切分特征(选择节点)
目标:通过一种衡量标准,来计算通过不同特征进行分支选择后的分类情况,找出来最好的那个当成根节点
衡量标准-熵
熵:熵是表示随机变量不确定性的度量 (解释:物体内部的混乱程度,比如杂货市场里面什么都有那肯定混乱呀,专卖店里面只卖一个牌子的那就稳定多啦)
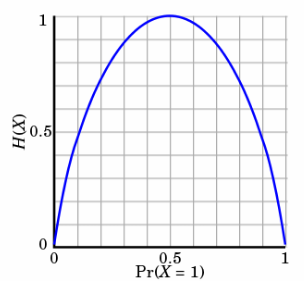
公式:H(X)=- ∑ pi * logpi, i=1,2, ... , n
比如:
A集合[1,1,1,1,1,1,1,1,2,2] 、B集合[1,2,3,4,5,6,7,8,9,1]
显然A集合的熵值要低,因为A里面只有两种类别,相对稳定一些而B中类别太多了,熵值就会大很多
熵:不确定性越大,得到的熵值也就越大,当p=0或p=1时,H(p)=0,随机变量完全没有不确定性,当p=0.5时,H(p)=1,此时随机变量的不确定性最大
如何决策一个节点的选择呢?
信息增益:表示特征X使得类Y的不确定性减少的程度。(分类后的专一性,希望分类后的结果是同类在一起)
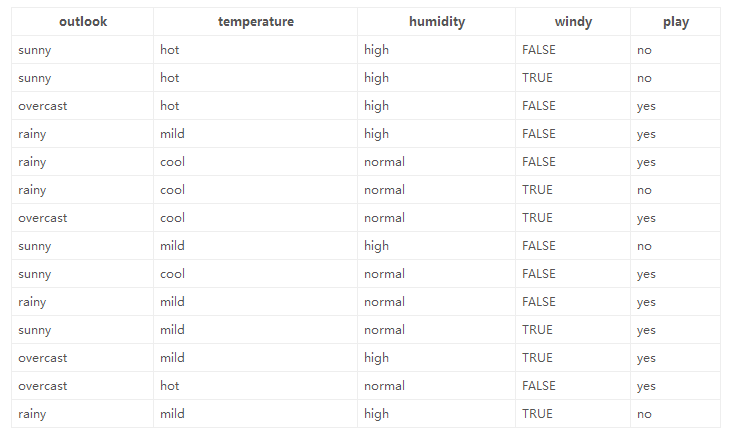
决策树构造实例
数据:14天打球情况
特征:4种环境变化
目标:构造决策树
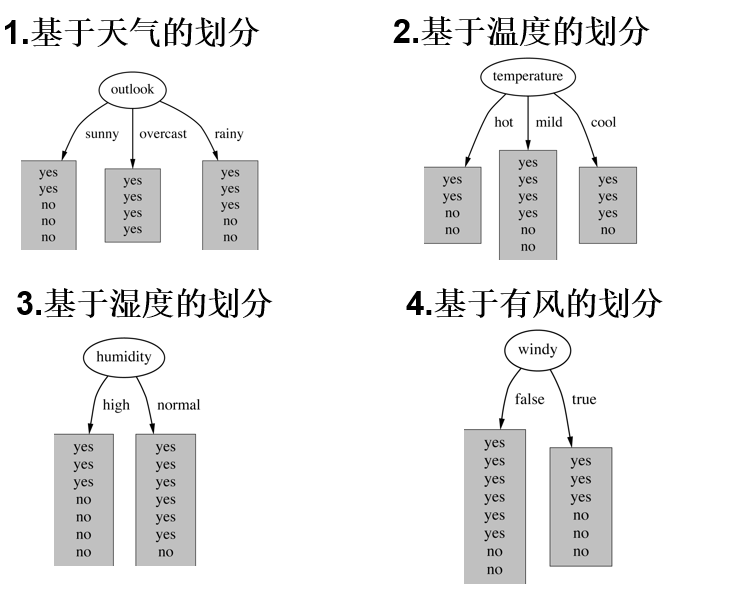
划分方式:4种
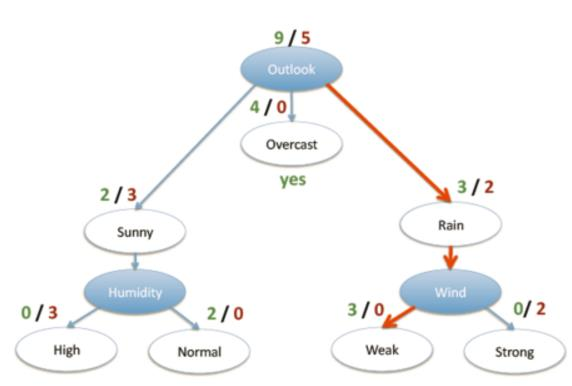
在历史数据中(14天)有9天打球,5天不打球,所以此时的熵应为: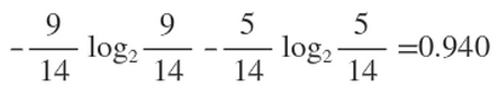
4个特征逐一分析,先从outlook特征开始:
Outlook = sunny时,熵值为0.971
Outlook = overcast时,熵值为0
Outlook = rainy时,熵值为0.971
决策树算法
ID3:信息增益
问题:当数据存在一个ID特征,那么,决策树在id特征的熵为0,就会根据ID进行分支,但是ID特征毫无意义。决策树无法处理矩阵稀疏,种类比较多的id特征
(和熵的衡量标准类似,计算方式不相同)
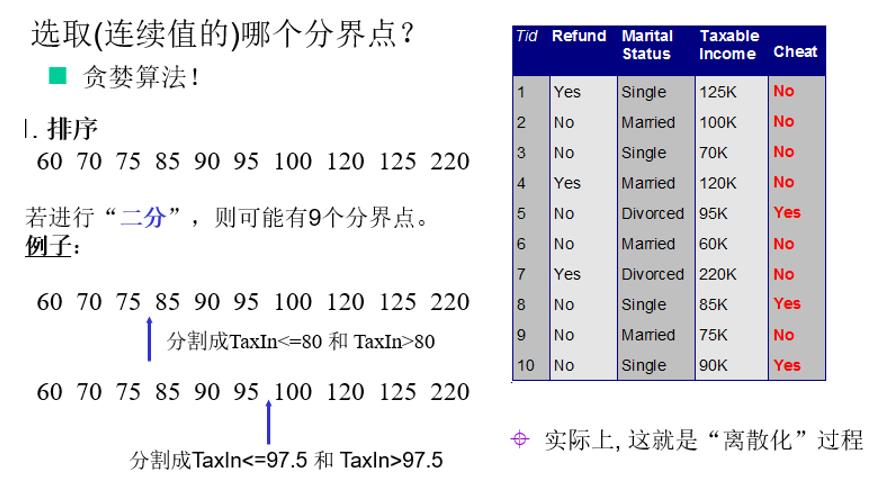
连续值怎么办?
决策树剪枝策略
为什么要剪枝:决策树过拟合风险很大,理论上可以完全分得开数据
4.决策树代码实现
import matplotlib.pyplot as plt
from math import log
import operator


def createDataSet():
    dataSet = [[0, 0, 0, 0, 'no'],
               [0, 0, 0, 1, 'no'],
               [0, 1, 0, 1, 'yes'],
               [0, 1, 1, 0, 'yes'],
               [0, 0, 0, 0, 'no'],
               [1, 0, 0, 0, 'no'],
               [1, 0, 0, 1, 'no'],
               [1, 1, 1, 1, 'yes'],
               [1, 0, 1, 2, 'yes'],
               [1, 0, 1, 2, 'yes'],
               [2, 0, 1, 2, 'yes'],
               [2, 0, 1, 1, 'yes'],
               [2, 1, 0, 1, 'yes'],
               [2, 1, 0, 2, 'yes'],
               [2, 0, 0, 0, 'no']]
    labels = ['F1-AGE', 'F2-WORK', 'F3-HOME', 'F4-LOAN']
    return dataSet, labels


def createTree(dataset, labels, featLabels):
    classList = [example[-1] for example in dataset]
    if classList.count(classList[0]) == len(classList):
        return classList
    if len(dataset[0]) == 1:
        # 返回最多的类
        return majorityCnt(classList)
    # 选择最好的分裂节点
    bestFeat = chooseBestFeatureToSplit(dataset)
    # 最好的标签
    bestLabels = labels[bestFeat]
    featLabels.append(bestLabels)
    myTree = {bestLabels: {}}
    del labels[bestFeat]
    featValue = [example[bestFeat] for example in dataset]
    featUniqual = set(featValue)
    for value in featUniqual:
        sublabels = labels[:]
        myTree[bestLabels][value] = createTree(splitDataSet(dataset, bestFeat, value), sublabels, featLabels)
    return myTree


def majorityCnt(classList):
    classCont = {}
    for vot in classList:
        if vot not in classCont.keys():
            classCont[vot] = 0
        classCont[vot] += 1
    classCont = sorted(classCont, key=operator.itemgetter(1), reverse=True)
    return classCont[0][0]


def chooseBestFeatureToSplit(dataset):
    num_features = len(dataset[0]) - 1
    baseEntropy = calcShannonEnt(dataset)
    bestInfoGain = 0
    bestFeature = -1
    for i in range(num_features):
        featList = [example[i] for example in dataset]
        uniqueVals = set(featList)
        newEntropy = 0
        for val in uniqueVals:
            subDataSet = splitDataSet(dataset, i, val)
            prop = len(subDataSet) / len(dataset)
            newEntropy += prop * calcShannonEnt(subDataSet)

        infogain = baseEntropy - newEntropy
        if infogain > bestInfoGain:
            bestInfoGain = infogain
            bestFeature = i
    return bestFeature


def splitDataSet(dataset, axis, val):
    retDataset = []
    for feature in dataset:
        if feature[axis] == val:
            reducedFeatVec = feature[:axis]
            reducedFeatVec.extend(feature[axis + 1:])
            retDataset.append(reducedFeatVec)
    return retDataset


def calcShannonEnt(dataset):
    num_examples = len(dataset)
    labelsCont = {}
    for featVec in dataset:
        if featVec[-1] not in labelsCont.keys():
            labelsCont[featVec[-1]] = 0
        labelsCont[featVec[-1]] += 1

    ShannonEnt = 0
    for key in labelsCont:
        prop = labelsCont[key] / num_examples
        ShannonEnt -= prop * log(prop, 2)
    return ShannonEnt


def getNumLeafs(myTree):
    numLeafs = 0
    firstStr = next(iter(myTree))
    secondDict = myTree[firstStr]
    for key in secondDict.keys():
        if type(secondDict[key]).__name__ == 'dict':
            numLeafs += getNumLeafs(secondDict[key])
        else:
            numLeafs += 1
    return numLeafs


def getTreeDepth(myTree):
    maxDepth = 0
    firstStr = next(iter(myTree))
    secondDict = myTree[firstStr]
    for key in secondDict.keys():
        if type(secondDict[key]).__name__ == 'dict':
            thisDepth = 1 + getTreeDepth(secondDict[key])
        else:
            thisDepth = 1
        if thisDepth > maxDepth: maxDepth = thisDepth
    return maxDepth


def plotNode(nodeTxt, centerPt, parentPt, nodeType):
    arrow_args = dict(arrowstyle="<-")

    createPlot.ax1.annotate(nodeTxt, xy=parentPt, xycoords='axes fraction',
                            xytext=centerPt, textcoords='axes fraction',
                            va="center", ha="center", bbox=nodeType, arrowprops=arrow_args)


def plotMidText(cntrPt, parentPt, txtString):
    xMid = (parentPt[0] - cntrPt[0]) / 2.0 + cntrPt[0]
    yMid = (parentPt[1] - cntrPt[1]) / 2.0 + cntrPt[1]
    createPlot.ax1.text(xMid, yMid, txtString, va="center", ha="center", rotation=30)


def plotTree(myTree, parentPt, nodeTxt):
    decisionNode = dict(boxstyle="sawtooth", fc="0.8")
    leafNode = dict(boxstyle="round4", fc="0.8")
    numLeafs = getNumLeafs(myTree)
    depth = getTreeDepth(myTree)
    firstStr = next(iter(myTree))
    cntrPt = (plotTree.xOff + (1.0 + float(numLeafs)) / 2.0 / plotTree.totalW, plotTree.yOff)
    plotMidText(cntrPt, parentPt, nodeTxt)
    plotNode(firstStr, cntrPt, parentPt, decisionNode)
    secondDict = myTree[firstStr]
    plotTree.yOff = plotTree.yOff - 1.0 / plotTree.totalD
    for key in secondDict.keys():
        if type(secondDict[key]).__name__ == 'dict':
            plotTree(secondDict[key], cntrPt, str(key))
        else:
            plotTree.xOff = plotTree.xOff + 1.0 / plotTree.totalW
            plotNode(secondDict[key], (plotTree.xOff, plotTree.yOff), cntrPt, leafNode)
            plotMidText((plotTree.xOff, plotTree.yOff), cntrPt, str(key))
    plotTree.yOff = plotTree.yOff + 1.0 / plotTree.totalD


def createPlot(inTree):
    fig = plt.figure(1, facecolor='white')  # 创建fig
    fig.clf()  # 清空fig
    axprops = dict(xticks=[], yticks=[])
    createPlot.ax1 = plt.subplot(111, frameon=False, **axprops)  # 去掉x、y轴
    plotTree.totalW = float(getNumLeafs(inTree))  # 获取决策树叶结点数目
    plotTree.totalD = float(getTreeDepth(inTree))  # 获取决策树层数
    plotTree.xOff = -0.5 / plotTree.totalW;
    plotTree.yOff = 1.0;  # x偏移
    plotTree(inTree, (0.5, 1.0), '')  # 绘制决策树
    plt.show()


if __name__ == '__main__':
    dataset, labels = createDataSet()
    featLabels = []
    myTree = createTree(dataset, labels, featLabels)
    createPlot(myTree)
5.测试效果


 1159
1159


 被折叠的 条评论
为什么被折叠?
被折叠的 条评论
为什么被折叠?
 到【灌水乐园】发言


