


 这篇博客介绍了如何利用MATLAB中的色彩分割器,特别是HSV色彩模型,来进行图像处理。通过调整HSV的色调、饱和度和明度阈值,可以对图像进行色彩分割。作者展示了原始图像和经过HSV阈值处理后的图像,并提供了自动生成的MATLAB函数代码,该函数将RGB图像转换为HSV空间并应用阈值进行色彩选择。最后,博主分享了使用`imread`和`imshow`函数显示处理结果的方法。
今天学习如何使用matlab当中的可视化颜色阈值,来自B站up我想当你的验证码
主要是学会使用matlab当中的色彩分割器
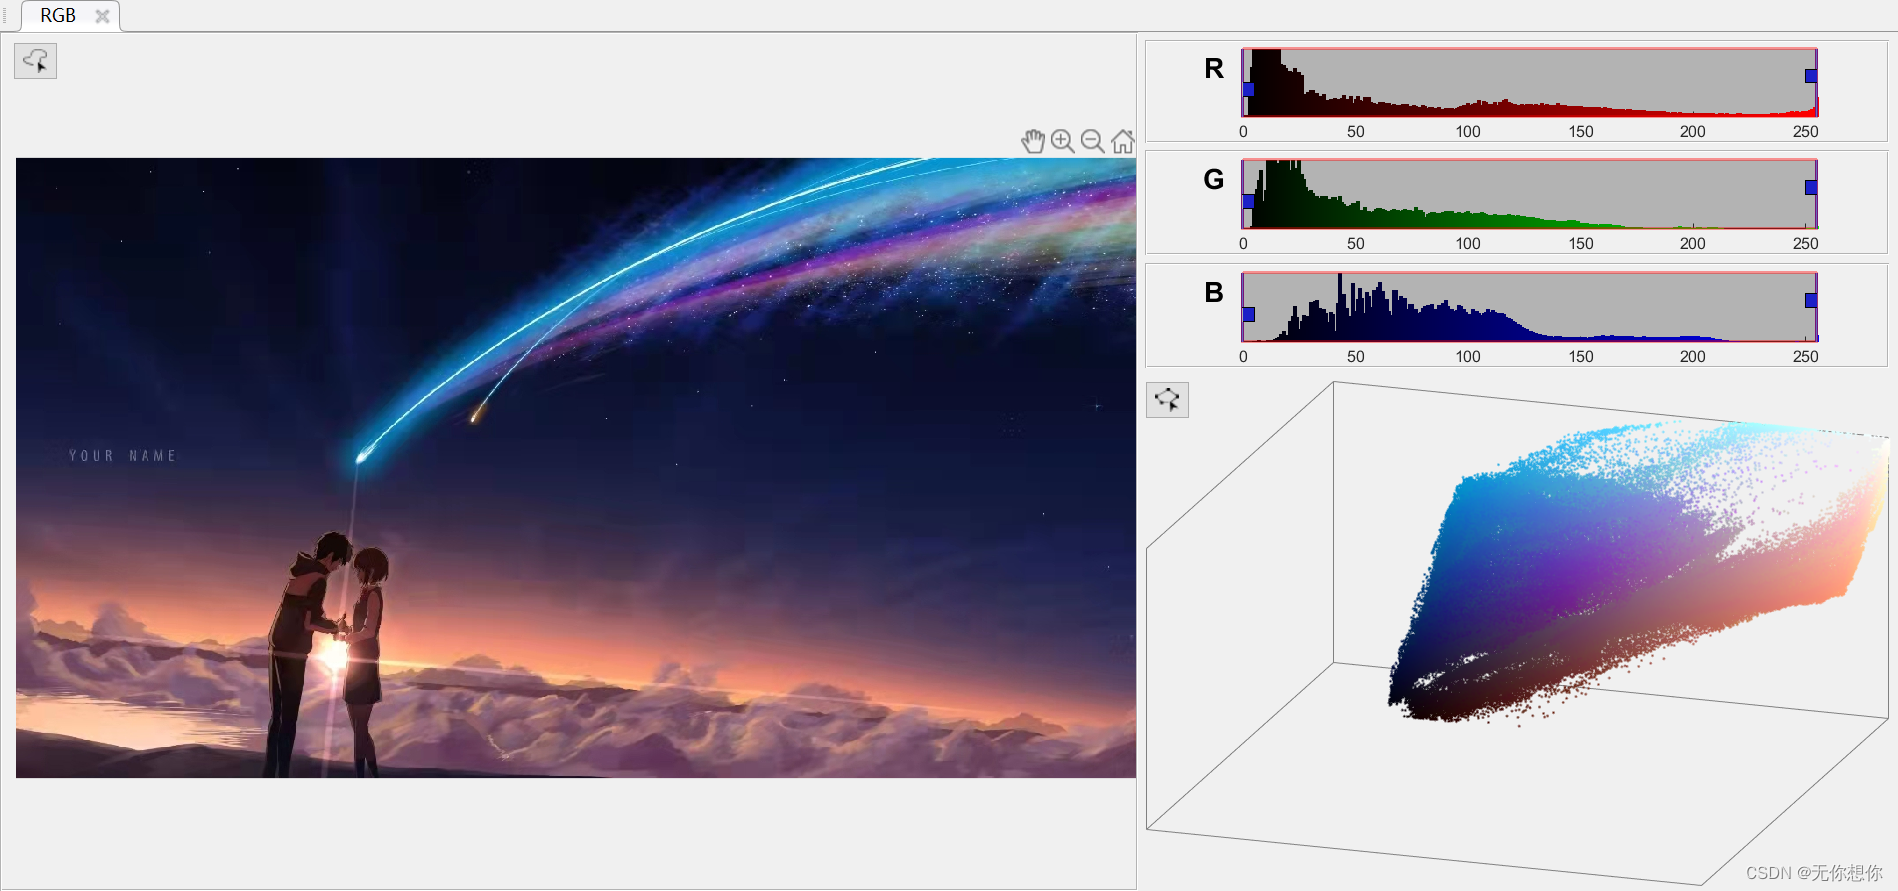
色彩分割器当中有一个被称为是HSV的色彩调度,根据百度搜索我们了解到
HSV(Hue, Saturation, Value) ,其对应的含义是
色调(H)、饱和度(S)和明度(V)。
由于HSV是一种比较直观的颜色模型,所以在许多图像编辑工具中应用比较广泛,如Photoshop(在Photoshop中叫HSB)等等,但这也决定了它不适合使用在光照模型中,许多光线混合运算、光强运算等都无法直接使用HSV来实现。
(以上来自百度搜索)
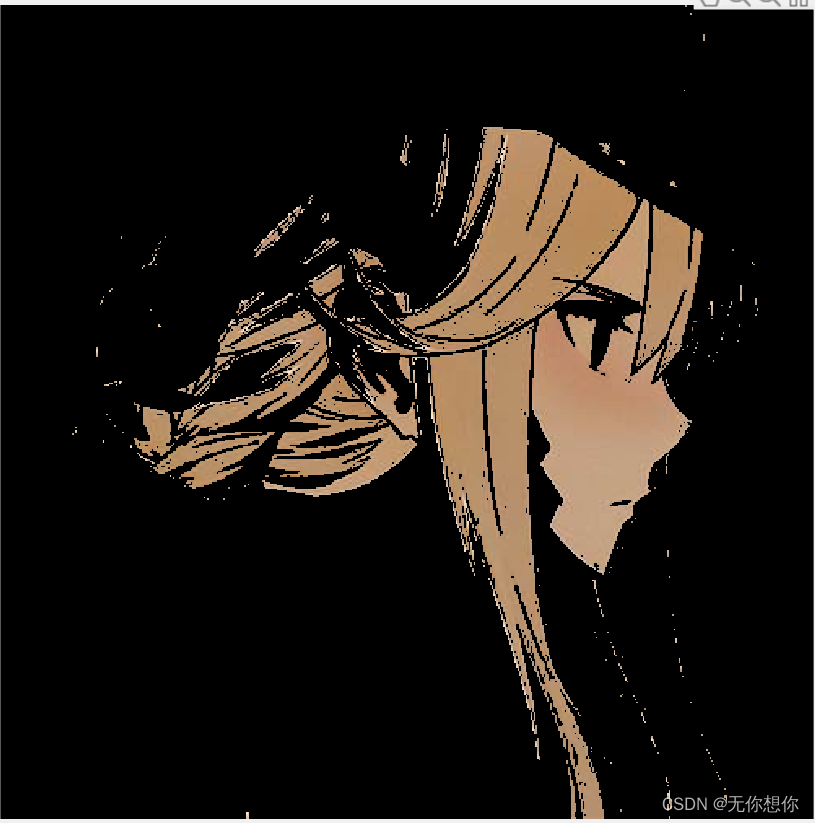
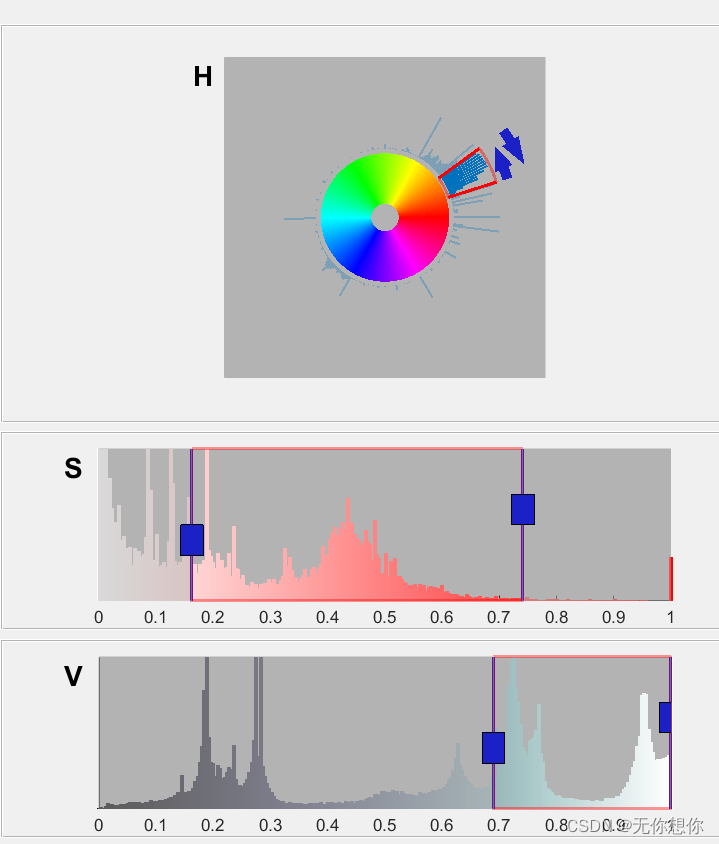
阈值:直观的理解就是对留下的区域颜色显示,超出区域的颜色不显示
具体使用
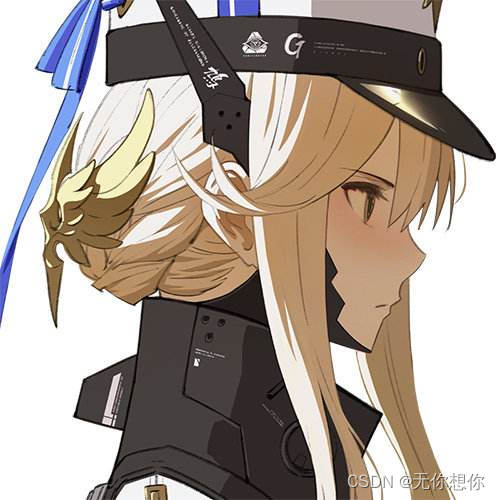
这个是原始的图像(选自网络游戏;战双)
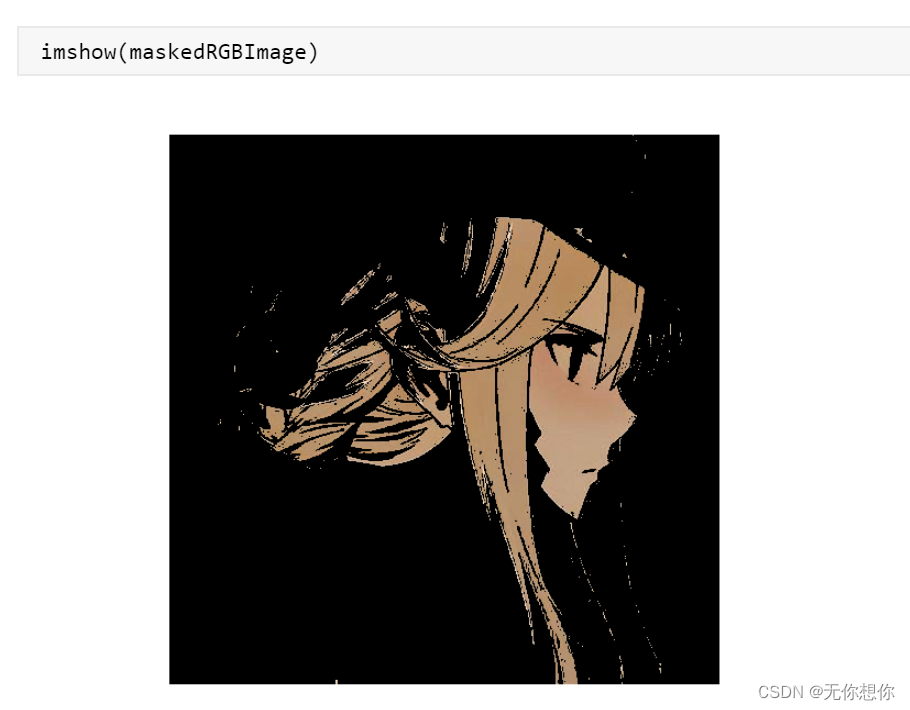
通过HSV的调整以后变成
函数的调用
 此处可以进行图像或者函数的导出
选择导出函数
导出的函数如下:
function [BW,maskedRGBImage] = createMask(RGB)
%createMask  Threshold RGB image using auto-generated code from colorThresholder app.
%  [BW,MASKEDRGBIMAGE] = createMask(RGB) thresholds image RGB using
%  auto-generated code from the colorThresholder app. The colorspace and
%  range for each channel of the colorspace were set within the app. The
%  segmentation mask is returned in BW, and a composite of the mask and
%  original RGB images is returned in maskedRGBImage.

% Auto-generated by colorThresholder app on 28-Apr-2022
%------------------------------------------------------


% Convert RGB image to chosen color space
I = rgb2hsv(RGB);

% Define thresholds for channel 1 based on histogram settings
channel1Min = 0.049;
channel1Max = 0.101;

% Define thresholds for channel 2 based on histogram settings
channel2Min = 0.163;
channel2Max = 0.741;

% Define thresholds for channel 3 based on histogram settings
channel3Min = 0.690;
channel3Max = 1.000;

% Create mask based on chosen histogram thresholds
sliderBW = (I(:,:,1) >= channel1Min ) & (I(:,:,1) <= channel1Max) & ...
    (I(:,:,2) >= channel2Min ) & (I(:,:,2) <= channel2Max) & ...
    (I(:,:,3) >= channel3Min ) & (I(:,:,3) <= channel3Max);
BW = sliderBW;

% Initialize output masked image based on input image.
maskedRGBImage = RGB;

% Set background pixels where BW is false to zero.
maskedRGBImage(repmat(~BW,[1 1 3])) = 0;

end
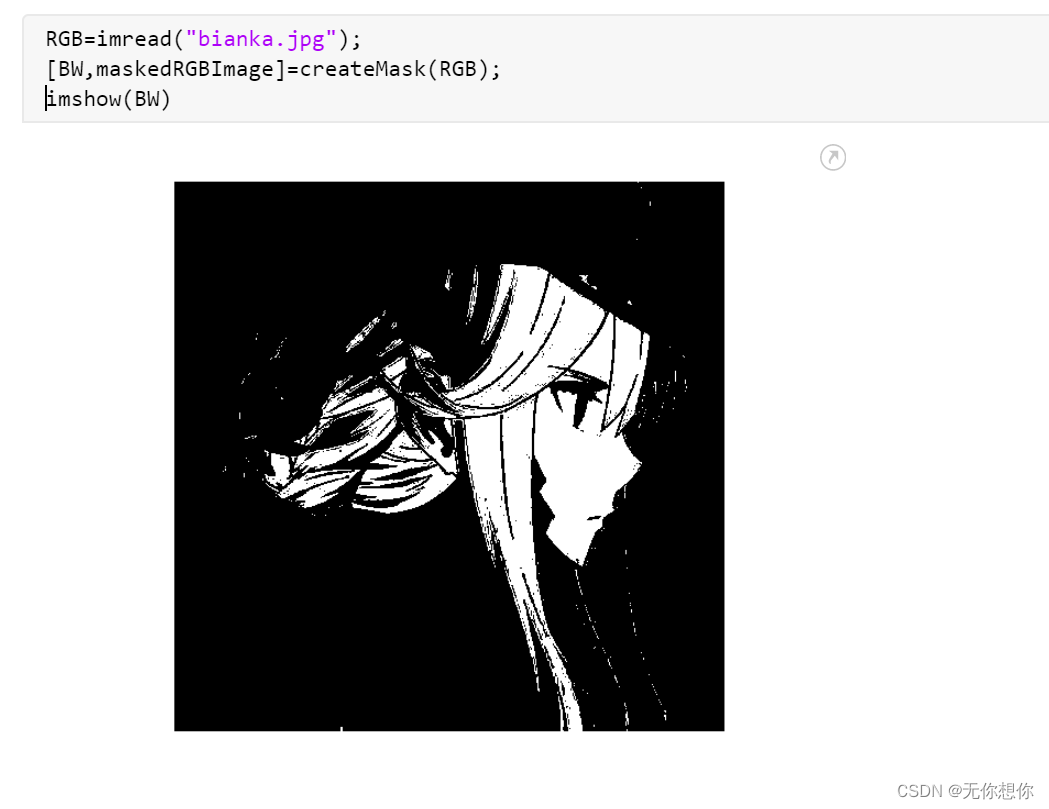
imread:在图形文字中提取图像
imshow:显示图像
最终形式如下:


 4909
4909

 被折叠的 条评论
为什么被折叠?
被折叠的 条评论
为什么被折叠?
 到【灌水乐园】发言


