


在本教程中,我将带你使用Python来开发一个利用机器学习技术的车牌识别系统(License Plate Recognition)。
我们要做什么?
车牌识别系统使用光学字符识别(OCR)技术来读取车牌上的字符。 换句话说,车牌识别系统以车辆图像作为输入并输出车牌中的字符。 如果你是一个卧底或侦探,就能想象这会对你的工作有多宝贵了: 你可以利用车辆拍照来提取一辆汽车的几乎所有必要信息。
机器学习和车牌识别有什么关系?
实际上,开发车牌识别系统不一定要使用机器学习技术。 例如,你也可以使用模板匹配、特征提取等非机器学习专有的技术。 但是,机器学习使我们可以通过训练来提高识别系统的准确性。 我们将使用机器学习来进行字符识别,即将字符的图像映射到其实际字符,例如A、B等。
这个教程适合我吗?
如果你想用电影里摩根·弗里曼的声音来构建你自己的JARVIS,那就适合你。 好的,这太夸张了。 实际上,这个教程只是向你展示如何将图像处理和机器学习应用于解决现实生活中的问题。 你将会了解到Python、图像处理、机器学习的一些概念。 我会尽可能地解释这些概念,你也可以进一步研究以更好地理解它们。 如果想马上练习,我推荐你使用汇智网的python机器学习在线运行环境。
现在开始吧
LPR有时也被称为自动车牌识别(ALPR),主要包括三个处理阶段:
- 牌照检测:这是第一个、可能也是最重要的阶段。 这个阶段的任务是确定车牌的位置,输入是车辆图像,输出是车牌区域的图像。
- 字符分割:这个阶段的任务是将车牌区域图像上的字符分割成单独的图像。
- 字符识别:这个阶段的任务是将之前分割的字符图像识别为具体的字符。 在这个阶段我们将使用机器学习。
理论够多了,现在可以开始编码了吗?
当然,让我们先准备下工作环境。 首先需要创建一个虚拟工作环境。 这可以简化项目依赖和包的管理。 你可以使用virtualenv包创建一个虚拟环境:
# install virtualenv if you don’t have the package already
pip install virtualenv
mkdir license-plate-recognition
cd license-plate-recognition
virtualenv lpr
source lpr/bin/activate现在,在你的项目目录下,应该有一个名为lpr的文件夹了。
然后我们来安装第一个软件包scikit-image 。 这是一个用于图像处理的Python包。 要安装它,只需运行如下命令:
pip install scikit-image这个软件包的关键依赖项包括:scipy (科学计算), numpy (多维数组操作)和matplotlib (绘制图形和显示图像)。 另一个重要的软件包是Pillow, 一个python图像库。
车牌检测(牌照定位)
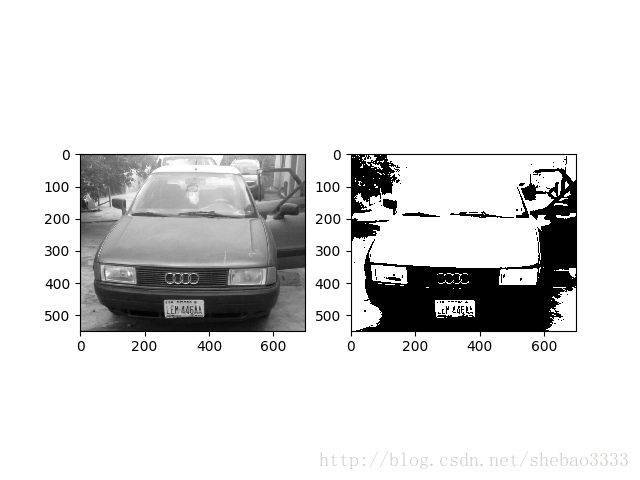
这是第一阶段,目标是确定车辆图像中的车牌位置。 为了做到这一点,首先需要读取图像文件并将其转换为灰度图像。 在灰度图像中,每个像素的值都在0和255之间。然后,我们需要将其转换为二值图像,即像素值要么黑要么白,只有两种可能的值。
运行下面的代码,将显示两个图像:一个灰度、一个黑白:
from skimage.io import imread
from skimage.filters import threshold_otsu
import matplotlib.pyplot as plt

car_image = imread("car.jpg", as_grey=True)
# it should be a 2 dimensional array
print(car_image.shape)

# the next line is not compulsory however, a grey scale pixel
# in skimage ranges between 0 & 1. multiplying it with 255
# will make it range between 0 & 255 (something we can relate better with

gray_car_image = car_image * 255
fig, (ax1, ax2) = plt.subplots(1, 2)
ax1.imshow(gray_car_image, cmap="gray")
threshold_value = threshold_otsu(gray_car_image)
binary_car_image = gray_car_image > threshold_value
ax2.imshow(binary_car_image, cmap="gray")
plt.show()
运行结果:
我们使用连通分量分析 (Connected Component Analysis)算法来识别图像中的所有连通区域。 你也可以尝试其他方法如边缘检测和形态学处理。 CCA帮助我们对前景中的连通区域进行分组和标注。 如果两个像素具有相同的值并且彼此相邻,则认为它们是连通的:
from skimage import measure
from skimage.measure import regionprops
import matplotlib.pyplot as plt
import matplotlib.patches as patches
import localization

# this gets all the connected regions and groups them together
label_image = measure.label(localization.binary_car_image)
fig, (ax1) = plt.subplots(1)
ax1.imshow(localization.gray_car_image, cmap="gray");

# regionprops creates a list of properties of all the labelled regions
for region in regionprops(label_image):
    if region.area < 50:
        #if the region is so small then it's likely not a license plate
        continue

    # the bounding box coordinates
    minRow, minCol, maxRow, maxCol = region.bbox
    rectBorder = patches.Rectangle((minCol, minRow), maxCol-minCol, maxRow-minRow, edgecolor="red", linewidth=2, fill=False)
    ax1.add_patch(rectBorder)
    # let's draw a red rectangle over those regions

plt.show()
我们需要导入之前的文件,以便访问其中的值。 measure.label方法用于映射并标注二值图像中所有的连通区域。 在标注好的图像上调用regionprops方法将返回所有连通区域(及其属性,如面积、边界框、标签等)的列表。我们使用patches.Rectangle方法在所有被映射的区域上绘制矩形。
从结果图像中,我们可以看到有一些不包含车牌的连通区域也被圈出来了。 为了消除这些区域,我们需要使用车牌的一些典型特征来进行过滤:
- 车牌是矩形的。
- 车牌的宽度大于高度。
- 车牌区域的宽度与整个图像的比例在15%和40%之间。
- 车牌区域的高度与整个图像的比例在8%和20%之间。
如果这些特征与你要处理的车牌不匹配,那你就调整这些特征,不要犹豫,不要手软!
代码如下:
from skimage import measure
from skimage.measure import regionprops
import matplotlib.pyplot as plt
import matplotlib.patches as patches
import localization

# this gets all the connected regions and groups them together
label_image = measure.label(localization.binary_car_image)

# getting the maximum width, height and minimum width and height that a license plate can be
plate_dimensions = (0.08*label_image.shape[0], 0.2*label_image.shape[0], 0.15*label_image.shape[1], 0.4*label_image.shape[1])
min_height, max_height, min_width, max_width = plate_dimensions
plate_objects_cordinates = []
plate_like_objects = []
fig, (ax1) = plt.subplots(1)
ax1.imshow(localization.gray_car_image, cmap="gray");

# regionprops creates a list of properties of all the labelled regions
for region in regionprops(label_image):
    if region.area < 50:
        #if the region is so small then it's likely not a license plate
        continue

    # the bounding box coordinates
    min_row, min_col, max_row, max_col = region.bbox
    region_height = max_row - min_row
    region_width = max_col - min_col
    # ensuring that the region identified satisfies the condition of a typical license plate
    if region_height >= min_height and region_height <= max_height and region_width >= min_width and region_width <= max_width and region_width > region_height:
        plate_like_objects.append(localization.binary_car_image[min_row:max_row,
                                  min_col:max_col])
        plate_objects_cordinates.append((min_row, min_col,
                                              max_row, max_col))
        rectBorder = patches.Rectangle((min_col, min_row), max_col-min_col, max_row-min_row, edgecolor="red", linewidth=2, fill=False)
        ax1.add_patch(rectBorder)
    # let's draw a red rectangle over those regions

plt.show()
在上述代码中,根据给出的车牌特征剔除了那些不大可能是牌照的区域。 但是,依然还有一些区域(例如车头灯等)的外观与车牌完全一样,也有可能被标记为车牌。 为了消除这些区域,我们需要进行垂直投影:即累加每一列的全部像素。 由于车牌区域存在着字符图像,因此我们预期在车牌区域会得到很高的列像素累加值。。
字符分割
在这个阶段,我们将提取车牌上的所有字符图像。 我们继续使用连通分量分析(CGA)。
import numpy as np
from skimage.transform import resize
from skimage import measure
from skimage.measure import regionprops
import matplotlib.patches as patches
import matplotlib.pyplot as plt
import cca2

# on the image I'm using, the headlamps were categorized as a license plate
# because their shapes were similar
# for now I'll just use the plate_like_objects[2] since I know that's the
# license plate. We'll fix this later

# The invert was done so as to convert the black pixel to white pixel and vice versa
license_plate = np.invert(cca2.plate_like_objects[2])

labelled_plate = measure.label(license_plate)

fig, ax1 = plt.subplots(1)
ax1.imshow(license_plate, cmap="gray")
# the next two lines is based on the assumptions that the width of
# a license plate should be between 5% and 15% of the license plate,
# and height should be between 35% and 60%
# this will eliminate some
character_dimensions = (0.35*license_plate.shape[0], 0.60*license_plate.shape[0], 0.05*license_plate.shape[1], 0.15*license_plate.shape[1])
min_height, max_height, min_width, max_width = character_dimensions

characters = []
counter=0
column_list = []
for regions in regionprops(labelled_plate):
    y0, x0, y1, x1 = regions.bbox
    region_height = y1 - y0
    region_width = x1 - x0

    if region_height > min_height and region_height < max_height and region_width > min_width and region_width < max_width:
        roi = license_plate[y0:y1, x0:x1]

        # draw a red bordered rectangle over the character.
        rect_border = patches.Rectangle((x0, y0), x1 - x0, y1 - y0, edgecolor="red", linewidth=2, fill=False)
        ax1.add_patch(rect_border)

        # resize the characters to 20X20 and then append each character into the characters list
        resized_char = resize(roi, (20, 20))
        characters.append(resized_char)

        # this is just to keep track of the arrangement of the characters
        column_list.append(x0)

plt.show()
列表 plate_like_objects中存有车辆图像中所有的候选车牌区域。 在我使用的示例图像中,有三个区域被选中为车牌的候选区域。 在这个教程中,为了节省时间,我手工指定了第二个区域(真正包含车牌的区域)。 在下面分享的最终代码中会包含一个牌照区域的验证功能,可以自动剔除那些实际上不包含车牌的区域。
接下来我们在牌照上做一个连通分量分析,将每个字符的大小调整为20px,20px。 这是因为字符的大小与下一个阶段的识别有关。
为了跟踪牌照中字符的顺序,引入了column_list变量来记录每个字符区域的x轴起始坐标。 这样就可以通过排序来确定多个字符间的先后顺序了。
字符识别
这是车牌识别的最后一个阶段,我们首先介绍下机器学习。 机器学习可以简单地定义为人工智能(AI)的一个发展分支,它对数据进行处理以期从数据中发现可用于预测的模式。 机器学习可以分为监督学习、无监督学习和强化学习。 监督学习使用标注过的数据集(称为训练数据集)进行预测。 我们将采用监督学习,因为我们已经知道A、B等字母的样子。 监督学习又可以分为两类: 分类和回归。 字符识别则属于分类。
我们现在需要做的:
- 获取训练数据集
- 选择监督学习分类器
- 训练模型
- 测试模型的准确率
- 使用模型进行预测。
让我们开始训练模型吧。 我有两个不同的数据集 ,一个是10px,20px,另一个是20px,20px。 我们将使用20px,20px的数据集,因为之前已经按这个大小调整过每个字符。 除O和I(由于它们分别与0和1相似,因此尼日利亚牌照中不使用这些字母)以外的每个字母都有10个不同的图像。
你可以尝试不同的分类器 ,每种分类器都有其优点和缺点。 在这个任务中,我们将使用支持向量分类器(SVC)。 之所以选择SVC,是因为它在这个任务中的的性能表现最好。 但是,这并不是说SVC是最好的分类器。
我们需要首先安装scikit-learn软件包:
pip install scikit-learn这部分的代码如下:
import os
import numpy as np
from sklearn.svm import SVC
from sklearn.model_selection import cross_val_score
from sklearn.externals import joblib
from skimage.io import imread
from skimage.filters import threshold_otsu

letters = [
            '0', '1', '2', '3', '4', '5', '6', '7', '8', '9', 'A', 'B', 'C', 'D',
            'E', 'F', 'G', 'H', 'J', 'K', 'L', 'M', 'N', 'P', 'Q', 'R', 'S', 'T',
            'U', 'V', 'W', 'X', 'Y', 'Z'
        ]

def read_training_data(training_directory):
    image_data = []
    target_data = []
    for each_letter in letters:
        for each in range(10):
            image_path = os.path.join(training_directory, each_letter, each_letter + '_' + str(each) + '.jpg')
            # read each image of each character
            img_details = imread(image_path, as_grey=True)
            # converts each character image to binary image
            binary_image = img_details < threshold_otsu(img_details)
            # the 2D array of each image is flattened because the machine learning
            # classifier requires that each sample is a 1D array
            # therefore the 20*20 image becomes 1*400
            # in machine learning terms that's 400 features with each pixel
            # representing a feature
            flat_bin_image = binary_image.reshape(-1)
            image_data.append(flat_bin_image)
            target_data.append(each_letter)

    return (np.array(image_data), np.array(target_data))

def cross_validation(model, num_of_fold, train_data, train_label):
    # this uses the concept of cross validation to measure the accuracy
    # of a model, the num_of_fold determines the type of validation
    # e.g if num_of_fold is 4, then we are performing a 4-fold cross validation
    # it will divide the dataset into 4 and use 1/4 of it for testing
    # and the remaining 3/4 for the training
    accuracy_result = cross_val_score(model, train_data, train_label,
                                      cv=num_of_fold)
    print("Cross Validation Result for ", str(num_of_fold), " -fold")

    print(accuracy_result * 100)


current_dir = os.path.dirname(os.path.realpath(__file__))

training_dataset_dir = os.path.join(current_dir, 'train')

image_data, target_data = read_training_data(training_dataset_dir)

# the kernel can be 'linear', 'poly' or 'rbf'
# the probability was set to True so as to show
# how sure the model is of it's prediction
svc_model = SVC(kernel='linear', probability=True)

cross_validation(svc_model, 4, image_data, target_data)

# let's train the model with all the input data
svc_model.fit(image_data, target_data)

# we will use the joblib module to persist the model
# into files. This means that the next time we need to
# predict, we don't need to train the model again
save_directory = os.path.join(current_dir, 'models/svc/')
if not os.path.exists(save_directory):
    os.makedirs(save_directory)
joblib.dump(svc_model, save_directory+'/svc.pkl')在上面的代码中,使用训练数据集中的每个字符来训练svc模型。 我们通过4折交叉验证来确定模型的精确度,然后将模型保存到模型文件中,以便后续进行预测。
现在我们有了一个训练好的模型,可以试着来预测一下我们之前分割出的字符图像:
import os
import segmentation
from sklearn.externals import joblib

# load the model
current_dir = os.path.dirname(os.path.realpath(__file__))
model_dir = os.path.join(current_dir, 'models/svc/svc.pkl')
model = joblib.load(model_dir)

classification_result = []
for each_character in segmentation.characters:
    # converts it to a 1D array
    each_character = each_character.reshape(1, -1);
    result = model.predict(each_character)
    classification_result.append(result)

print(classification_result)

plate_string = ''
for eachPredict in classification_result:
    plate_string += eachPredict[0]

print(plate_string)

# it's possible the characters are wrongly arranged
# since that's a possibility, the column_list will be
# used to sort the letters in the right order

column_list_copy = segmentation.column_list[:]
segmentation.column_list.sort()
rightplate_string = ''
for each in segmentation.column_list:
    rightplate_string += plate_string[column_list_copy.index(each)]

print(rightplate_string)
注意
让这个系统正常工作最重要的一点,是尽量保证输入的车辆图像清晰。 此外,图像不要太大,600px宽就够了。
如果你喜欢这篇文章,记得关注我:新缸中之脑!
完整的代码请访问这里。
原文:Developing a License Plate Recognition System with Machine Learning in Python


 255
255

 被折叠的 条评论
为什么被折叠?
被折叠的 条评论
为什么被折叠?
 到【灌水乐园】发言


