


import numpy as np
import matplotlib.pyplot as plt
import numpy as np
from matplotlib import style
from mpl_toolkits.mplot3d import axes3d
import matplotlib.pyplot as plt
import numpy as np
from matplotlib import style
color24 = np.array([[115, 82, 69], [204, 161, 141], [101, 134, 179], [89, 109, 61], [141,137,194],[132,228,208],
[249,118,35], [80,91,182], [222,91,125], [91,63,123], [173,232,91],[255,164,26],
[44,56,142], [74,148,81], [179,42,50], [250,226,21], [191,81,160],[6,142,172],
[252,252,252], [230,230,230], [200,200,200], [143,143,142], [100,100,100], [50,50,50]])
def bar1(z):
x = np.arange(len(z))
y = z #y值
plt.figure()
plt.bar(x,y,color=color24/255) #绘制柱状图
plt.show() #显示柱状图
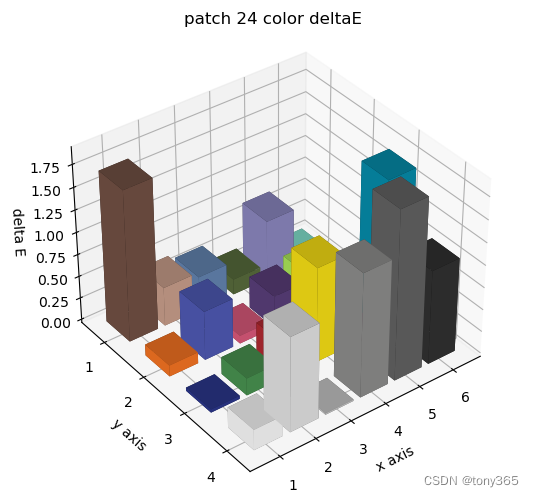
def bar_24_deltaE(dz):
fig = plt.figure()
ax1 = fig.add_subplot(111, projection='3d')
x3 = [1, 2, 3, 4, 5, 6] * 4
y3 = [4, 4, 4, 4, 4, 4] + [3, 3, 3, 3, 3, 3] + [2, 2, 2, 2, 2, 2] + [1, 1, 1, 1, 1, 1]
z3 = np.zeros(24)
x3 = np.array(x3)
y3 = np.array(y3)
x_r = 0.4
y_r = 0.3
x3 = x3 - 0.4
y3 = y3 - 0.27
dx = np.ones(24) * 2 * x_r
dy = np.ones(24) * 2 * y_r
#dz = np.random.randn(24)
#dz = abs(dz)
print(x3, y3, z3,dx,dy,dz)
ax1.bar3d(x3, y3, z3, dx, dy, dz,color=color24/255)
ax1.set_xlabel('x axis')
ax1.set_ylabel('y axis')
ax1.set_zlabel('delta E')
plt.title("patch 24 color deltaE")
x = np.arange(6) + 1
x_index = ['1', '2', '3', '4', '5', '6']
y = [4, 3, 2, 1]
y_index = ['1', '2', '3', '4']
plt.xticks(x, x_index)
plt.yticks(y, y_index)
plt.axis("auto")
plt.show()
if __name__ == "__main__":
deltaE = np.random.randn(24)
deltaE = abs(deltaE)
bar1(deltaE)
bar_24_deltaE(deltaE)


 4552
4552


 被折叠的 条评论
为什么被折叠?
被折叠的 条评论
为什么被折叠?
 到【灌水乐园】发言


