


1. a basic example - [exponentialDegradationModel]
– (illustrating RUL prediction with a degradation model)
Update RUL Prediction as Data Arrives.
load UpdateRULExampleData #Data
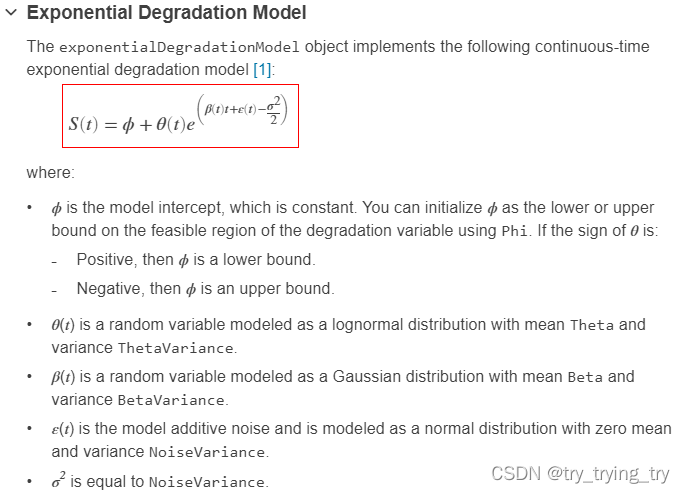
exponentialDegradationModel
语法:
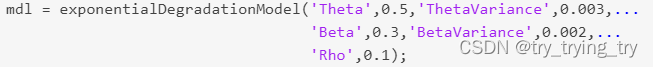
m d l = e x p o n e n t i a l D e g r a d a t i o n M o d e l \textcolor{blue}{mdl = exponentialDegradationModel } mdl=exponentialDegradationModel all properities default
m d l = e x p o n e n t i a l D e g r a d a t i o n M o d e l ( N a m e , V a l u e ) \textcolor{blue}{mdl = exponentialDegradationModel(Name,Value)} mdl=exponentialDegradationModel(Name,Value)specify properities
共5 parameters
通用function command
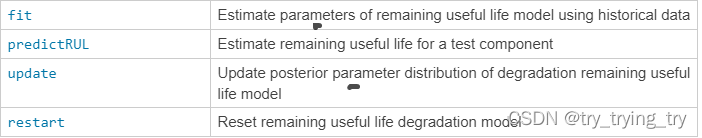
语法:
u p d a t e ( m d l , d a t a ) \textcolor{blue}{update(mdl,data)} update(mdl,data)
h e a d ( d a t a x , 5 ) \textcolor{blue}{head(datax, 5)} head(datax,5) %datax是table才可
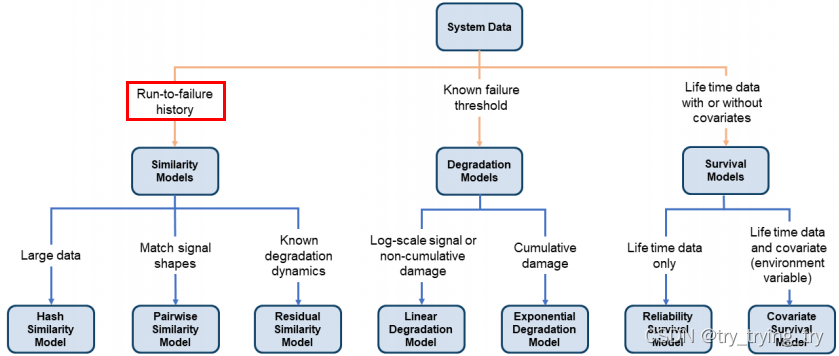
2. Similarity-Based RUL估计
workflow:
- preprocessing,
- selecting trendable features, 趋势特征
- constructing a health indicator by sensor fusion, 构建健康指标
- training similarity RUL estimators,
- validating prognostics performance. 验证预测性能
- data准备:
训练数据包含218组从运行到故障的模拟。每一组/ensemble,有26列,为ID, 时间戳记录、3种operating conditions设置,21个传感器测量的数据。
i) 将data进行划分: 训练集 验证集
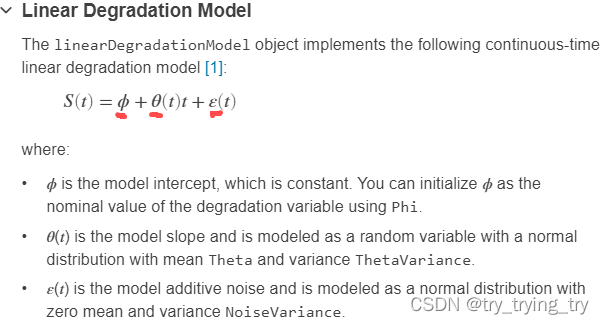
linearDegradationModel
语法:
m d l = l i n e a r D e g r a d a t i o n M o d e l \textcolor{blue}{mdl = linearDegradationModel} mdl=linearDegradationModel all properities default
m d l = l i n e a r D e g r a d a t i o n M o d e l ( N a m e , V a l u e ) \textcolor{blue}{mdl = linearDegradationModel(Name,Value)} mdl=linearDegradationModel(Name,Value) specify
residualSimilarityModel
语法:
m d l = r e s i d u a l S i m i l a r i t y M o d e l \textcolor{blue}{mdl = residualSimilarityModel } mdl=residualSimilarityModel all properities default
m d l = r e s i d u a l S i m i l a r i t y M o d e l ( i n i t M o d e l ) \textcolor{blue}{mdl = residualSimilarityModel(initModel) } mdl=residualSimilarityModel(initModel)
m d l = r e s i d u a l S i m i l a r i t y M o d e l ( , N a m e , V a l u e ) \textcolor{blue}{mdl = residualSimilarityModel(_,Name,Value) } mdl=residualSimilarityModel(,Name,Value)

%e.g:
load('residualTrainTables.mat')
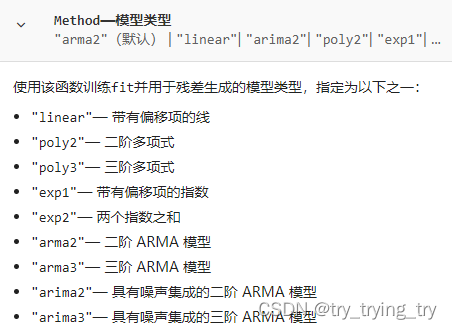
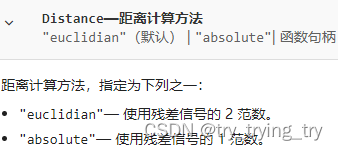
mdl = residualSimilarityModel('Method',"arma3",'Distance',"absolute");
fit(mdl,residualTrainTables,"Time","Condition")
语法:
C = v e r t c a t ( A , B ) \textcolor{blue}{C = vertcat(A,B)} C=vertcat(A,B) %垂直串联
Y = s p l i t a p p l y ( f u n c , X , G ) \textcolor{blue}{Y = splitapply(func,X,G)} Y=splitapply(func,X,G) %将 X 划分为 G 指定的组,并向每个组应用函数 e.g:splitapply(@mean,Height,G)
A = c e l l f u n ( f u n c , C ) \textcolor{blue}{A = cellfun(func,C)} A=cellfun(func,C) %对元胞数组中的每个元胞应用函数
A = cellfun(___,Name,Value )
centerstats.SD.(char(v)) = splitapply(@std, trainDataUnwrap.(char(v)), clusterIndex);
C = {1:10, [2; 4; 6], []}
A = cellfun(@mean,C)

C = {'Monday','Tuesday','Wednesday','Thursday','Friday'}
A = cellfun(@(x) x(1:3),C,'UniformOutput',false)  %@(x):func作用对象  x(1:3):function/作用对象的范围圈定  C:具体对象   'UniformOutput',false:A形式为cell

A = cellfun(@mean,data)
A = cellfun(@(x),mean(x),data) %x形参,data实参
语法:
B = r o w f u n ( f u n c , A ) \textcolor{blue}{B = rowfun(func,A)} B=rowfun(func,A) %将函数应用于table或timetable行
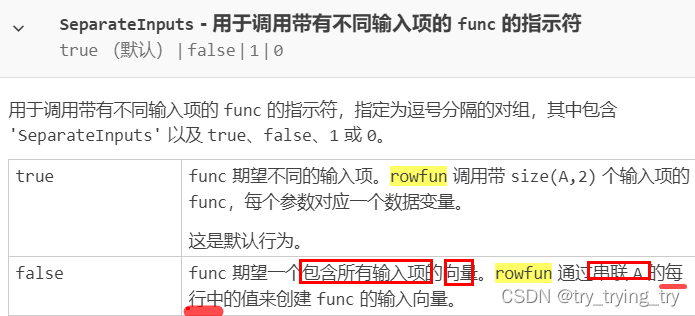
B = rowfun(@hypot,A,'OutputVariableNames','z') % function:hypot, to each row of A.
语法:
C = c e l l s t r ( A ) \textcolor{blue}{C = cellstr(A)} C=cellstr(A) A:string 转cell
M = m o v m e a n ( A , k ) \textcolor{blue}{M = movmean(A,k)} M=movmean(A,k) % k 个数据点的均值组成的数组 Moving mean
M = m o v m e a n ( A , [ k b , k f ] ) \textcolor{blue}{M = movmean(A,[kb, kf])} M=movmean(A,[kb,kf]) %当前位置的元素、后面的 kb 个元素和前面的 kf 个元素,算均值
语法:
c o m p a r e ( m d l , d a t a ) \textcolor{blue}{compare(mdl,data)} compare(mdl,data) %data: (一条不完整线)test component degradation data &(多条全退化线) fit(mdl, 训练用的数据)中’训练用的all数据’ =>重叠画
c o m p a r e ( , N a m e , V a l u e ) \textcolor{blue}{compare(_,Name,Value)} compare(,Name,Value)
语法:
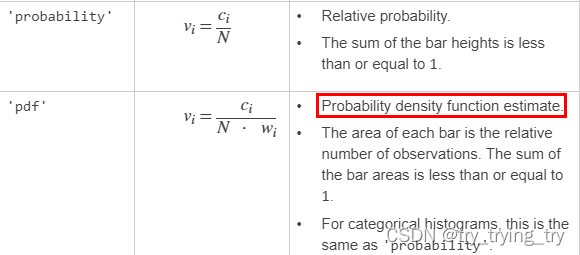
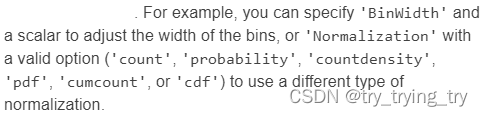
h i s t o g r a m ( , N a m e , V a l u e ) \textcolor{blue}{histogram(_,Name,Value)} histogram(,Name,Value)
e.g: x = randn(1000,1);
h = histogram(x,‘Normalization’,‘probability’)
语法:
l i n k a x e s ( a x ) \textcolor{blue}{linkaxes(ax)} linkaxes(ax) 同步all图的坐标范围,以最大的为对齐
*0.
Matlab反复提及:Degradation models estimate the RUL by predicting when a monitored signal will cross a predefined threshold.
*1. 好code
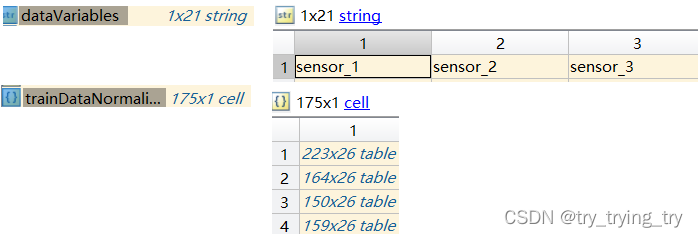
rowNormalized(isnan(rowNormalized) | isinf(rowNormalized)) = 0;
tmp = cellfun(@(tbl) tbl(:, cellstr(dataVariables(ct))), trainDataNormalized, 'UniformOutput', false);%e.g: ct=1
*2.总指导


 1211
1211


 被折叠的 条评论
为什么被折叠?
被折叠的 条评论
为什么被折叠?
 到【灌水乐园】发言


