


R|foestplot包绘制森林图forest plot
小编今天给大家分享的是foestplot包绘制组间差异比对图(森林图forest plot)相关方法。森林图(forestplot)常用于Meta分析,可用于表达统计指标的效应量和置信区间。
绘图示例
#安装包
#install.packages("forestplot")
#加载包
library(forestplot)
#输入文件
inputFile="input.txt"
#输出文件
outFile="forest.pdf"
#设置路径
setwd("G:\\RStudio\\38.forest")
#读取文件数据
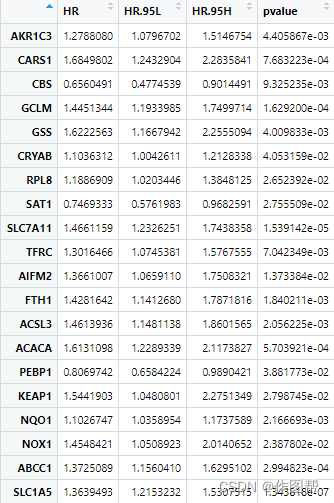
rt=read.table(inputFile,header=T,sep="\t",row.names=1,check.names=F)
#绘制森林图函数
gene=rownames(rt)#读取基因列
hr=sprintf("%.3f",rt$"HR")#获取HR列取小数点后3位
hrLow=sprintf("%.3f",rt$"HR.95L")#获取95%置信区间取HR.95L列小数点后3位
hrHigh=sprintf("%.3f",rt$"HR.95H")#获取95%置信区间HR.95H列小数点后3位
pVal=ifelse(rt$pvalue<0.001, "<0.001", sprintf("%.3f", rt$pvalue)) #获取P值
Hazard.ratio=paste0(hr,"(",hrLow,"-",hrHigh,")")#合并为一个数据集
#输出图形
#pdf(file=outFile, width = 6, height =4.5)
n=nrow(rt)
nRow=n+1
ylim=c(1,nRow)
layout(matrix(c(1,2),nc=2),width=c(3,2))
#森林图左边的基因信息
xlim = c(0,3)
par(mar 最低0.47元/天 解锁文章


 1万+
1万+


 被折叠的 条评论
为什么被折叠?
被折叠的 条评论
为什么被折叠?
 到【灌水乐园】发言


