


 本文介绍了如何使用统计软件SPSS来构建决策树,详细解释了该过程,并提供了相关资源链接。
spss 建立 决策树
A decision tree is a popular and powerful method for making predictions in data science. Decision trees also form the foundation for other popular ensemble methods such as bagging, boosting and gradient boosting. Its popularity is due to the simplicity of the technique making it easy to understand. We are going to discuss building decision trees for several classification problems. First, let’s start with a simple classification example to explain how a decision tree works.
决策树是在数据科学中进行预测的一种流行而强大的方法。 决策树还为其他流行的集成方法(例如装袋,增强和梯度增强)奠定了基础。 它之所以受欢迎,是因为该技术简单易懂。 我们将讨论为几个分类问题构建决策树。 首先,让我们从一个简单的分类示例开始,以解释决策树的工作原理。
代码 (The Code)
While this article focuses on describing the details of building and using a decision tree, the actual Python code for fitting a decision tree, predicting using a decision tree and printing a dot file for graphing a decision tree is available at my GitHub.
尽管本文着重于描述构建和使用决策树的细节,但我的GitHub上提供了用于拟合决策树,使用决策树进行预测并打印点文件以绘制决策树的实际Python代码。
一个简单的例子 (A Simple Example)
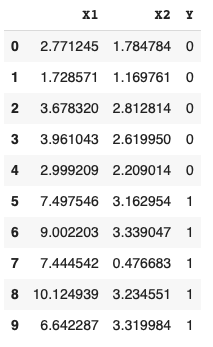
Let’s say we have 10 rectangles of various widths and heights. Five of the rectangles are purple and five are yellow. The data is shown below with X1 representing the width, X2 representing the height and Y representing the classes of 0 for purple rectangles and 1 for yellow rectangles:
假设我们有10个不同宽度和高度的矩形。 五个矩形是紫色,五个矩形是黄色。 数据显示如下,其中X1代表宽度,X2代表高度,Y代表紫色矩形的0类和黄色矩形的1类:
Graphing the rectangles we can very clearly see the separate classes.
通过绘制矩形,我们可以非常清楚地看到单独的类。

Based on the rectangle data, we can build a simple decision tree to make forecasts. Decision trees are made up of decision nodes and leaf nodes. In the decision tree below we start with the top-most box which represents the root of the tree (a decision node). The first line of text in the root depicts the optimal initial decision of splitting the tree based on the width (X1) being less than 5.3. The second line represents the initial Gini score which we will go into more detail about later. The third line represents the number of samples at this initial level — in this case 10. The fourth line represents the number of items in each class for the node — 5 for purple rectangles and 5 for yellow rectangles.
基于矩形数据&#x
 最低0.47元/天 解锁文章


 3105
3105

 被折叠的 条评论
为什么被折叠?
被折叠的 条评论
为什么被折叠?
 到【灌水乐园】发言


