


机器学习线性回归代码案例
Disclaimer: This story is just a scenario for Project Practice in Purwadhika School. All the dataset used here is fake, so there is no confidential issue.
免责声明:这个故事只是Purwadhika学校项目实践的一个场景。 这里使用的所有数据集都是伪造的,因此没有机密问题。
One day, I just got some contract work with an E-Commerce company based in New York City that sells clothing online but they also have in-store style and clothing advice sessions. Customers come into the store, have sessions/meetings with a personal stylist, then they can go home and order either on a mobile app or website for the clothes they want.
有一天,我刚与纽约一家电子商务公司签约,该公司在网上销售服装,但他们也有店内风格和服装建议会议。 客户进入商店,与个人造型师进行会谈/会议,然后他们可以回家并在移动应用程序或网站上订购所需的衣服。
The company is trying to decide whether to focus their efforts on their mobile app experience or their website. They’ve hired me on contract to help them figure it out! So, I decide to use Machine Learning modeling with the Linear Regression method to get insight into this problem.
该公司正在尝试决定是否将精力集中在他们的移动应用程序体验或网站上。 他们已经按合同聘用了我,以帮助他们解决问题! 因此,我决定将机器学习建模与线性回归方法结合使用,以深入了解此问题。
First, I need the data for this work. I got an E-Commerce CSV file from the company. It has Customer info, such as E-Mail, Address, and their color Avatar. Then it also has numerical value columns.
首先,我需要用于这项工作的数据。 我从公司获得了一个电子商务CSV文件。 它具有客户信息,例如电子邮件,地址及其颜色头像。 然后它还有数值列。
- Avg. Session Length: Average session of in-store style advice sessions. 平均 会话时长:店内风格建议会话的平均会话时间。
- Time on App: Average time spent on App in minutes 应用上时间:平均在应用上花费的时间(以分钟为单位)
- Time on Website: Average time spent on Website in minutes 网站停留时间:在网站上花费的平均时间(以分钟为单位)
- Length of Membership: How many years the customer has been a member. 会员期限:客户成为会员已有多少年。
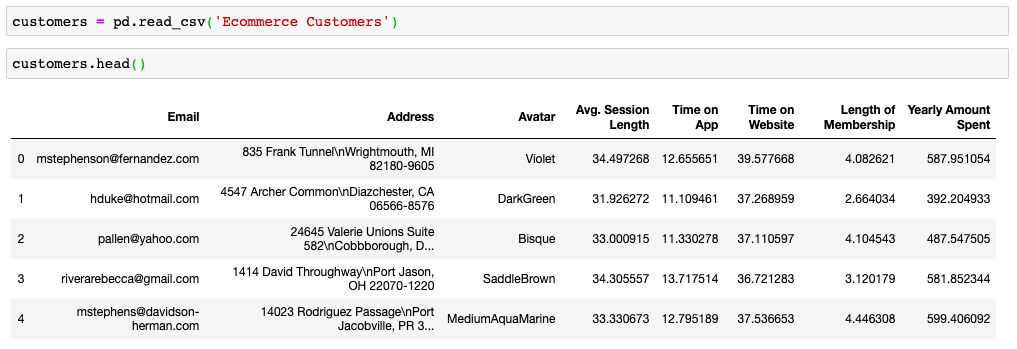
After putting the CSV data to the data frame “customers”, I checked the data cleanliness. I didn’t found any anomalies (like a null cell), so we can continue to explore and analyze the data.
将CSV数据放入“客户”数据框后,我检查了数据的清洁度。 我没有发现任何异常(如空单元格),因此我们可以继续探索和分析数据。
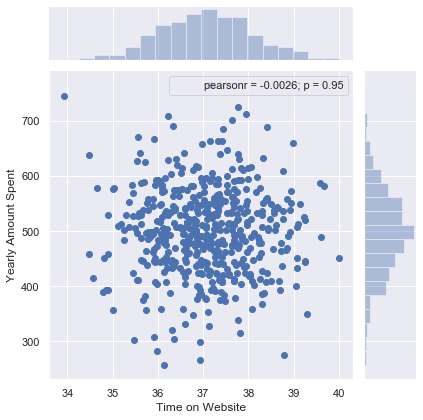
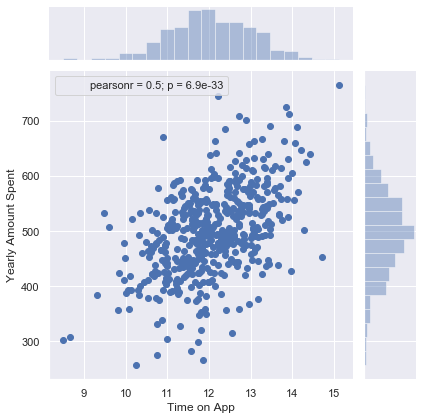
I use Seaborn to create a Jointplot to compare the Time on Website and Yearly Amount Spent columns. Then, compare the Time on App and Yearly Amount Spent columns.
我使用Seaborn创建一个Jointplot,以比较“网站时间”和“年度花费”列。 然后,比较“应用时间”和“年度花费”列。
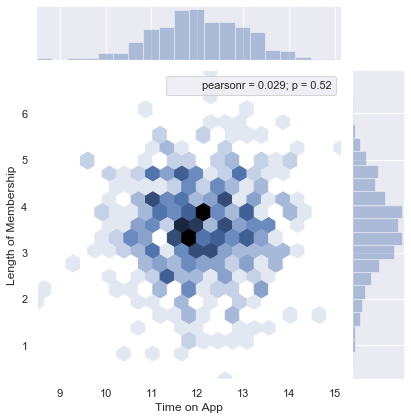
Now, I use Seaborn Jointplot to create a 2D hex bin plot comparing Time on App and Length of Membership.
现在,我使用Seaborn Jointplot来创建一个2D十六进制bin图,比较应用程序时间和成员资格长度。
Let’s explore these types of relationships across the entire data set. Use pairplot to recreate the plot below.
让我们探索整个数据集中的这些类型的关系。 使用pairplot重新创建下面的图。
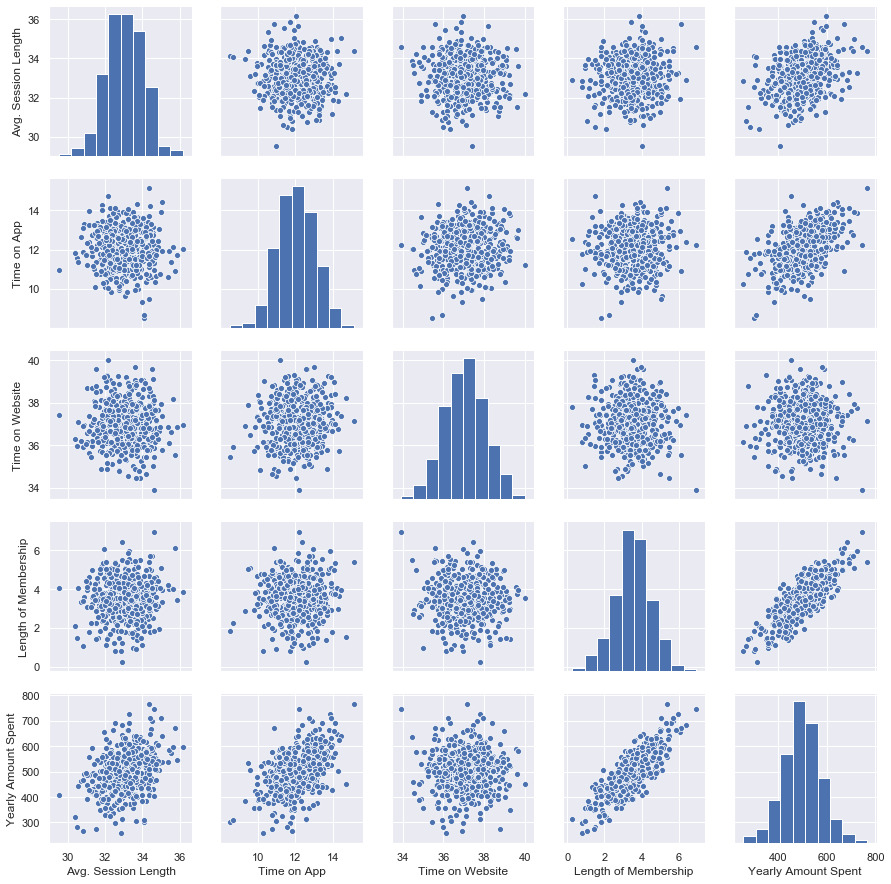
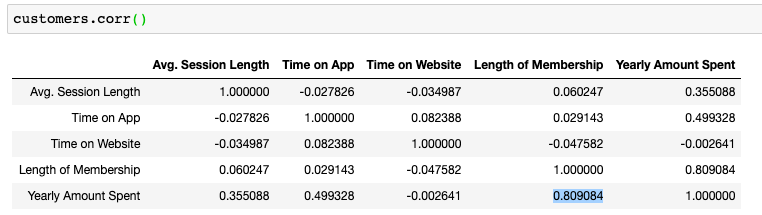
Based on this plot we can look that the Length of Membership column is the most correlated feature with Yearly Amount Spent. It makes sense because the longer you become a member the bigger your possibility to spent more money on it. We can see that on the correlation value table also.
根据此图,我们可以看到“会员长度”列是与“年度花费”最相关的功能。 这是有道理的,因为您成为会员的时间越长,花费更多金钱的可能性就越大。 我们也可以在相关值表上看到这一点。
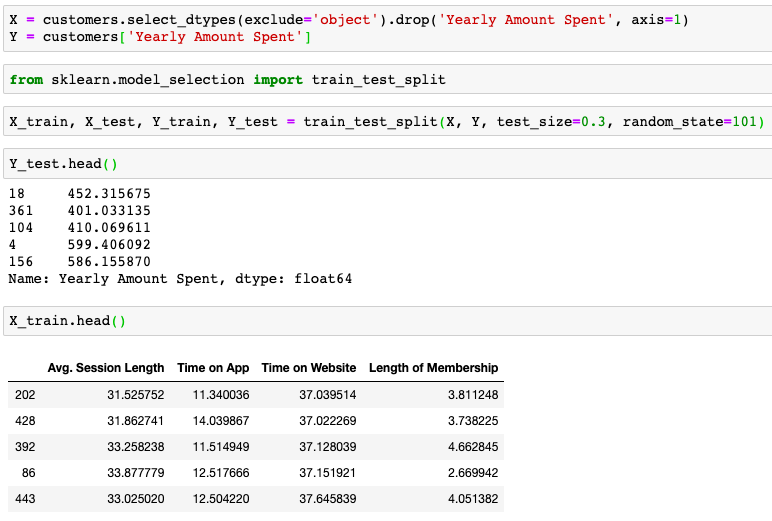
Now that I’ve explored the data a bit, let’s go ahead and split the data into training and testing sets. I set a variable “X” equal to the numerical features of the customers and a variable “Y” equal to the Yearly Amount Spent column.
现在,我已经对数据进行了一些探索,让我们继续并将数据分为训练和测试集。 我将变量“ X”设置为等于客户的数字特征,将变量“ Y”设置为等于“年度支出”列。
I use model_selection.train_test_split from SKLearn library to split the data into training and testing sets. I set test_size=0.3 and random_state=101. It means I split the existing dataset into 70% for data training, and 30% for data test.
我使用SKLearn库中的model_selection.train_test_split将数据分为训练和测试集。 我设置了test_size = 0.3和random_state = 101。 这意味着我将现有数据集分为70%用于数据训练和30%用于数据测试。
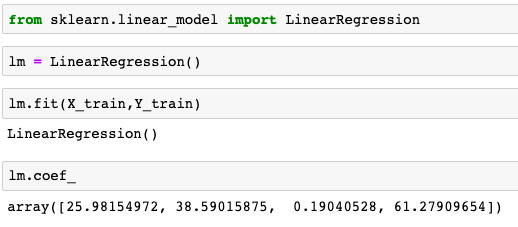
Now its time to train our model on our training data. I need to import LinearRegression from SKLearn.linear_model library. Then, create an instance of a LinearRegression() model named lm. Train/fit lm on the training data. Print out the coefficients of the model.
现在是时候根据训练数据训练模型了。 我需要从SKLearn.linear_model库导入LinearRegression。 然后,创建一个名为lm的LinearRegression()模型的实例。 根据训练数据进行训练/拟合。 打印出模型的系数。
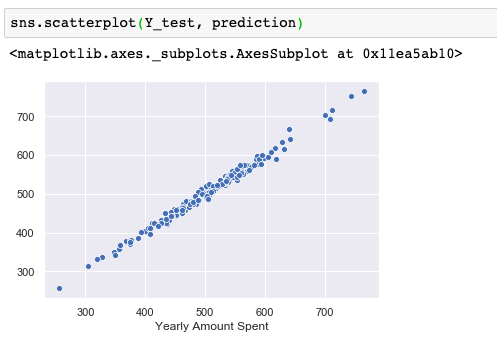
Now that we have fit our model, let’s evaluate its performance by predicting off the test values. I use lm.predict() to predict off the X_test set of the data. Then, let’s see the result of the real test values versus the predicted values by creating a scatterplot.
现在我们已经拟合了模型,让我们通过预测测试值来评估其性能。 我使用lm.predict()来预测数据的X_test集。 然后,我们通过创建散点图来查看实际测试值与预测值的结果。
After making this prediction, I still want to figure out the answer to the original question, do we focus our effort on mobile app or website development? Or maybe that doesn’t even really matter, and Membership Time is what is really important. Let’s see if we can interpret the coefficients at all to get an idea.
做出这个预测之后,我仍然想找出原始问题的答案,我们是否将精力集中在移动应用程序或网站开发上? 也许这甚至都不重要,而入会时间才是真正重要的。 让我们看看是否可以完全解释系数以获得一个想法。
And this is what I suggest to the E-Commerce company:
这是我对电子商务公司的建议:
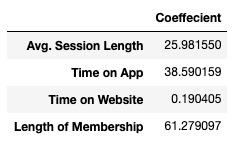
We can see that Length of Membership has a top coefficient value. It means that is the most important variable to get the high customer’s Yearly Amount Spent. Let’s see another coefficient value. Time on App has a bigger value than Time on Website. It indicates us to focus our effort on Mobile App rather than Website Development.We should make a good UI/UX on the mobile app to make customer feels great during their time on the app. It will lead to the longer Length of Membership and will be converted to the better Yearly Amount Spent by the customer.
我们可以看到,成员资格长度具有最高系数值。 这意味着要获得高客户的“年度花费”是最重要的变量。 让我们看看另一个系数值。 应用程序上的时间比网站上的时间具有更大的价值。 这表明我们将精力集中在移动应用程序上,而不是网站开发上。我们应该在移动应用程序上制作出良好的UI / UX,以使客户在使用该应用程序期间感觉良好。 这将导致更长的会员资格,并将被客户转换为更好的年度花费。
You can see the full python script on my GitHub.
您可以在我的GitHub上看到完整的python脚本。
Thank You.See you in another Data Exploration.
谢谢。再见。
BR,Erwindra RusliData Scientist Student at Purwadhika School.
BR,Erwindra Rusli,Purwadhika学校的数据科学家学生。
翻译自: https://medium.com/@erwindrarusli/machine-learning-linear-regression-e-commerce-case-5a7cc396e102
机器学习线性回归代码案例


 5万+
5万+

 被折叠的 条评论
为什么被折叠?
被折叠的 条评论
为什么被折叠?
 到【灌水乐园】发言


