


前言
创作开始时间:2021年4月9日09:17:11
如题。看了一些网页文献,大概对这两种流图有了一定的理解,这里简单地记录一下,尤其是一些例子,感觉比较直观。
1、data flow graphs
参考:
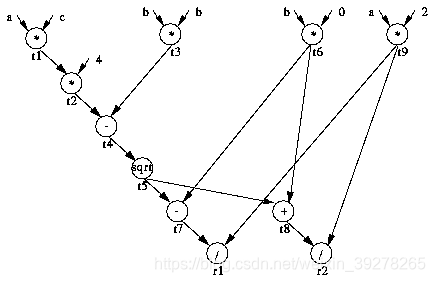
A data-flow graph (DFG) is a graph which represents a data dependancies between a number of operations. Any algorithm consists of a number of ordered operations. Since examples are always better than words, consider the procedure for finding the root of a quadratic equation (algorithm assumes real roots).
一块代码:
quad( a, b, c)
t1 = a*c;
t2 = 4*t1;
t3 = b*b;
t4 = t3 - t2;
t5 = sqrt( t4);
t6 = -b;
t7 = t6 - t5;
t8 = t7 + t5;
t9 = 2*a;
r1 = t7/t9;
r2 = t8/t9;
对应的数据流图是:
(时间紧急,就不在这里自己画了)
另可参考:
2、Control Flow Graph
参考:
- Software Engineering | Control Flow Graph (CFG) https://www.geeksforgeeks.org/software-engineering-control-flow-graph-cfg/
这里讲的还行,但是控制流图好像画错了。。 - Lecture 24: Control Flow Graphs https://www.cs.cornell.edu/courses/cs412/2008sp/lectures/lec24.pdf 这个讲的很好,瞬间会画了。推荐。
- https://www.zhihu.com/question/419064902/answer/1463328724
控制流图(Control Flow Graph, CFG)也叫控制流程图,是一个过程或程序的抽象表现,是用在编译器中的一个抽象数据结构,由编译器在内部维护,代表了一个程序执行过程中会遍历到的所有路径。它用图的形式表示一个过程内所有基本块执行的可能流向, 也能反映一个过程的实时执行过程。
- 参考百科。讲的还可以。
小结
以上。以后有机会再完善一下。基本上看这几个网页就可以理解了。
创作结束时间:2021年4月9日09:23:39


 3983
3983

 被折叠的 条评论
为什么被折叠?
被折叠的 条评论
为什么被折叠?
 到【灌水乐园】发言


