


 本文介绍了Graphviz系统支持的各种图形和数据格式,包括其在不同应用场景中的使用,以及如何通过命令行参数指定输出格式。同时讨论了图像文件的兼容性、插件需求以及id属性的生成规则。
Various graphic and data formats for end user, web, documents and other applications.
为最终用户、网络、文档和其他应用程序提供多种图形和数据格式。
| Format | Command-line parameter | Description |
|---|---|---|
| BMP | bmp | Windows Bitmap |
| CGImage | cgimage | Apple Core Graphics |
| DOT | canon dot gv xdot xdot1.2 xdot1.4 | Graphviz Language |
| EPS | eps | Encapsulated PostScript |
| EXR | exr | OpenEXR |
| FIG | fig | Xfig |
| GD/GD2 | gd gd2 | LibGD |
| GIF | gif | Graphics Interchange Format |
| GTK | gtk | Formerly GTK+ / GIMP ToolKit |
| ICO | ico | Windows Icon |
| Imagemap | imap imap_np ismap cmap cmapx cmapx_np | Image Map: Server-side and client-side |
| JPEG | jpg jpeg jpe | Joint Photographic Experts Group |
| JPEG 2000 | jp2 | |
| JSON | json json0 dot_json xdot_json | JavaScript Object Notation |
pdf | Portable Document Format | |
| PIC | pic | Brian Kernighan’s Diagram Language |
| PICT | pct pict | Apple PICT |
| Plain Text | plain plain-ext | Simple, line-based language |
| PNG | png | Portable Network Graphics |
| POV-Ray | pov | Persistence of Vision Raytracer (prototype) |
| PS | ps | Adobe PostScript |
| PS/PDF | ps2 | Adobe PostScript for Portable Document Format |
| PSD | psd | Photoshop |
| SGI | sgi | Silicon Graphics Image |
| SVG | svg svgz | Scalable Vector Graphics |
| TGA | tga | Truevision TARGA |
| TIFF | tif tiff | Tag Image File Format |
| Tk | tk | Tcl/Tk |
| VML | vml vmlz | Vector Markup Language. |
| VRML | vrml | Virtual Reality Modeling Language |
| WBMP | wbmp | Wireless Bitmap |
| WebP | webp | WebP |
| X11 | xlib x11 | X11 Window |
The output format is specified with the -Tlang flag on the command line, where lang is one of the parameters listed above.
输出格式通过命令行上的
-Tlang标志进行指定,其中 lang 是上述参数之一。
The formats actually available in a given Graphviz system depend on how the system was built and the presence of additional libraries.
实际在
给定的 Graphviz 系统中可用的格式取决于系统的构建方式以及附加库的存在。
To see what formats dot supports, run dot -T?.
要查看 dot 支持的格式,运行
dot -T?。
See the description of the -T flag for additional information.
查看
-T的描述标志了解更多信息。
Note that the internal coordinate system has the origin in the lower left corner.
请注意,
内部坐标系统的原点位于左下角。
Thus, positions in the canon, dot, xdot, plain, and plain-ext formats need to be interpreted in this manner.
Image Formats
The image and shapefile attributes specify an image file to be included as part of the final diagram.
Not all image formats can be read.
image和shapefile属性指定、要作为最终图表一部分的图像文件。
并非所有图像格式都可以读取。
In addition, even if read, not all image formats can necessarily be used in a given output format.
此外,即使可以
读取,也并非所有图像格式都必然能在给定的输出格式中使用。
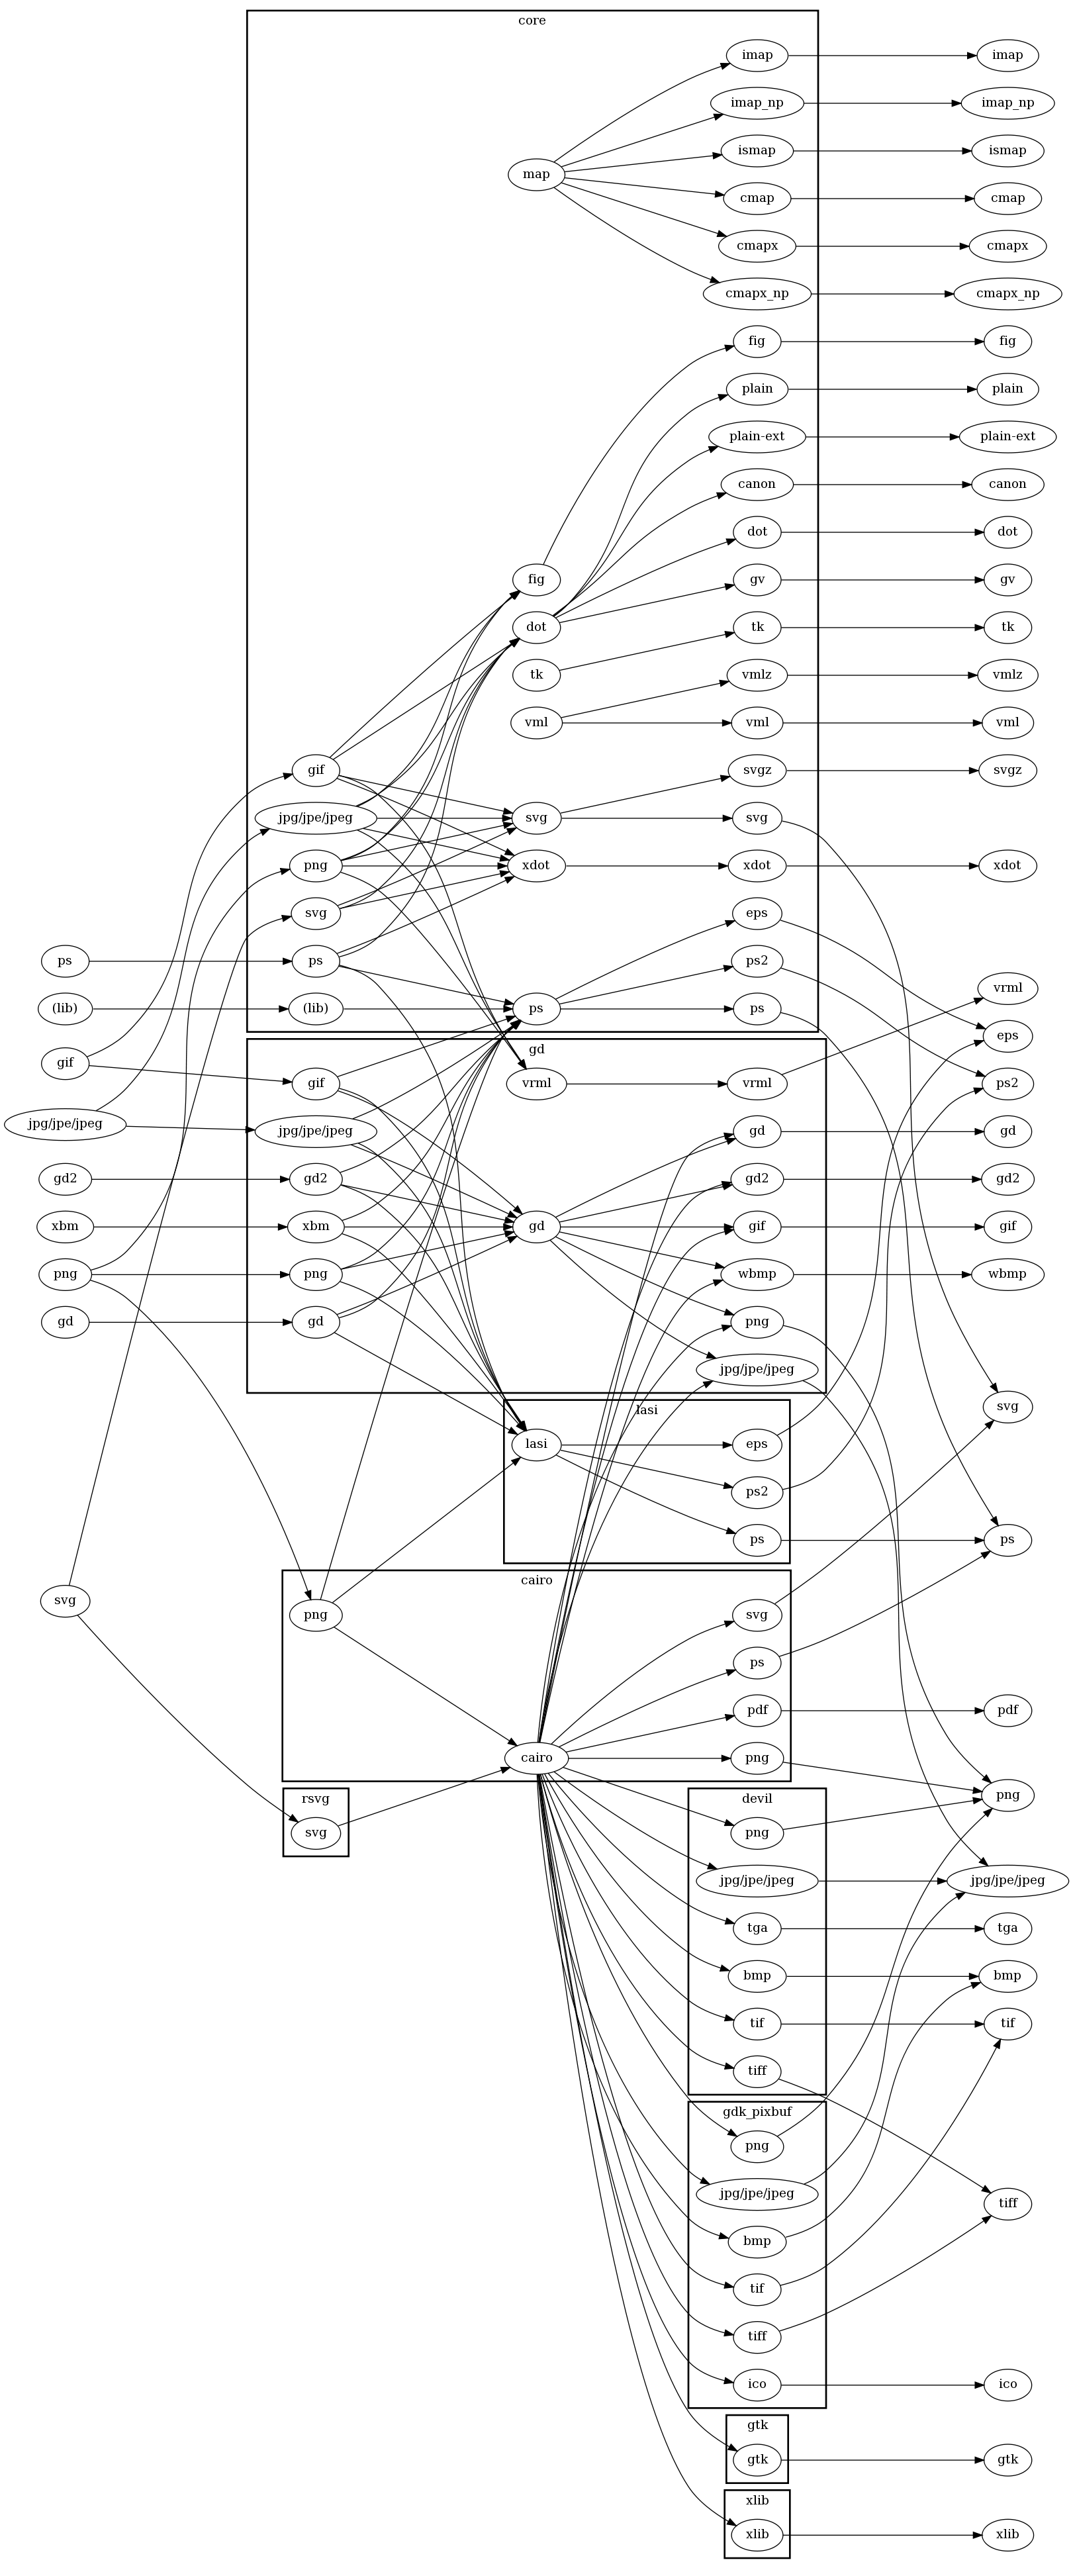
The graph below shows what image formats can be used in which output formats, and the required plugins.
下面的图表显示了
哪些图像格式可以用于哪些输出格式以及所需的插件。
On the left are the supported image formats.
On the right are the supported output formats.
In the middle are the plugins: image loaders, renderers, drivers, arranged by plugin library.
This presents the most general case.
A given installation may not provide one of the plugins, in which case, that transformation is not possible.
左侧是支持的图像格式。
右侧是支持的输出格式。
中间是插件:图像加载器、渲染器、驱动程序,按插件库排列。
这表示
最一般的情况。
给定的安装可能不提供其中一个插件,在这种情况下,该转换无法实现。
ID Output Note
In the formats: -Tcmap, -Tcmapx, -Tsvg, -Tvml,
the output generates id="node#" properties for nodes,
id="edge#" properties for edges,
and id="cluster#" properties for clusters,
with the # replaced by an internally assigned integer.
在以下格式中:-Tcmap,-Tcmapx,-Tsvg,-Tvml,
输出会为节点生成
id="node#"属性,为边生成
id="edge#"属性,为聚类生成
id="cluster#"属性,其中
#会被替换为 一个内部分配的整数。
These strings can be provided instead by an externally provided id=xxx attribute on the object.
Normal \N \E \G substitutions are applied.
Externally provided id values are not used internally, and it is the user’s reponsibilty to ensure that they are sufficiently unique for their intended downstream use.
Note, in particular, that \E is not a unique id for multiedges.
这些
字符串可以替代为 在对象上外部提供的id=xxx属性。正常的
\N\E\G替换是适用的。外部提供的id值不会
内部使用,而且确保它们对于预期的下游使用来说足够唯一是用户的责任。请注意,特别是
\E并不是多边的唯一id。


 2万+
2万+

 被折叠的 条评论
为什么被折叠?
被折叠的 条评论
为什么被折叠?
 到【灌水乐园】发言


