参考资料:#>《Python 机器学习》
github地址:欢迎访问
这里写目录标题
投票法的原理

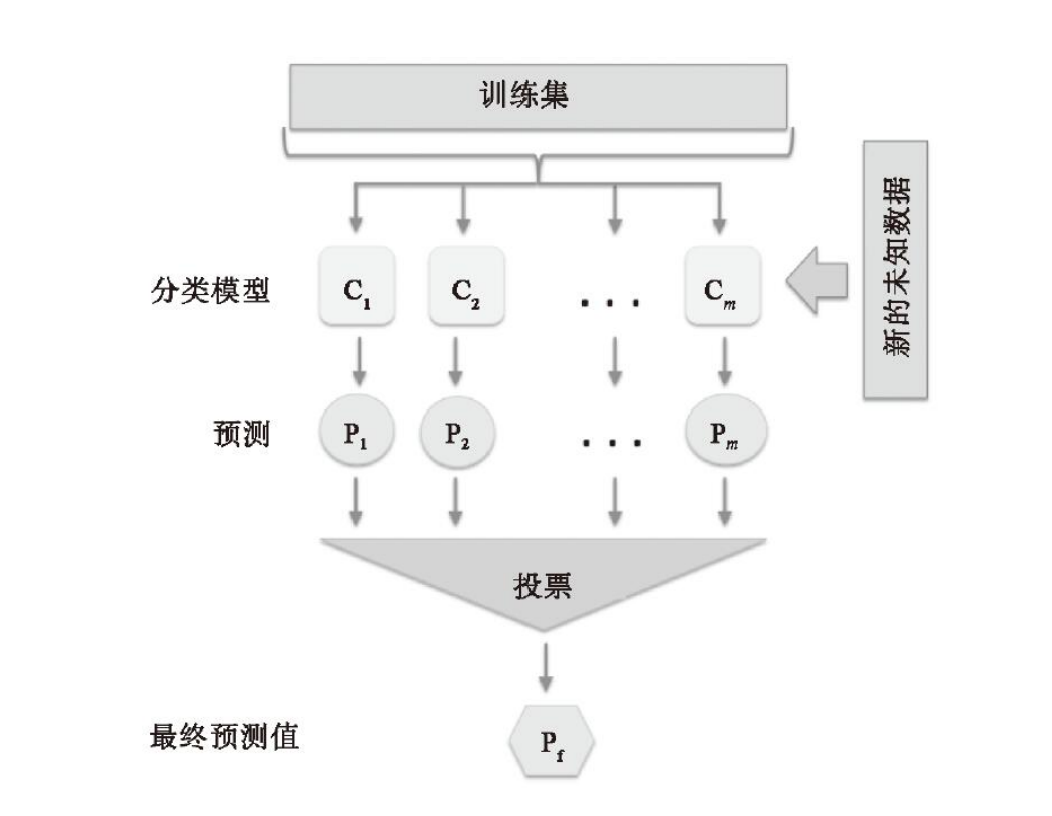
如上图所示,在同一训练集上,训练得到多个分类或回归模型,然后通过一个投票器,通过某种加权方式,输出得票率最高的结果。
集成模型好于单个分类器的原因
假设:n个基分类器的出错率都是 ϵ \epsilon ϵ,且相互独立,则n个基分类器的结果中,出现k个错误的数量服从二项分布,对集成模型(简单多数投票)来说,n个结果中,有K个错误的概率是:

当K>n/2时,集成模型输出错误结果
假设 ϵ = 0.25 , n = 11 \epsilon=0.25,n=11 ϵ=0.25,n=11,输出错误结果的概率为:

from scipy.special import comb #计算组合
import numpy as np
import matplotlib.pyplot as plt
plt.rcParams['font.sans-serif'] = ['SimHei'] # 替换sans-serif字体)
plt.rcParams['axes.unicode_minus'] = False  # (解决坐标轴负数的负号显示问题)

import math

def ensemble_error(n_classifier,epsilon):
    k = math.ceil(n_classifier/2)#向上取整
    probs = [comb(n_classifier,k) * epsilon ** k * (1-epsilon)**(n_classifier-k)
            for k in range(k,n_classifier+1)]
    return sum(probs)

base_error = np.arange(0.0,1.01,0.01)
en_error = [ensemble_error(11,base_e) for base_e in base_error]

plt.figure(figsize=(8,6))
plt.plot(base_error,en_error,label = '集成误差')
plt.plot(base_error,base_error,linestyle = '--',label = '基础分类器误差')
plt.xlabel('基错误率',fontsize = 15)
plt.ylabel('集成错误率',fontsize = 15)
plt.grid()
plt.legend()
plt.show()

如图片所示,只有当基分类器的错误率 ϵ < 0.5 \epsilon<0.5 ϵ<0.5时,多数投票的继承分类器出错率才会低于单个分类器
加权多数投票
硬投票
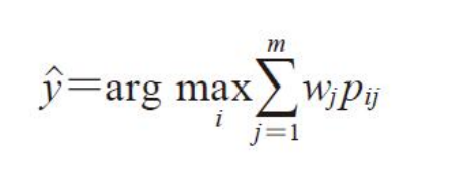
不同的基模型可能有不同的正确率,因此需要赋予不同的结果权重值

w j 表 示 分 类 器 C j 对 应 的 权 重 , y ^ 是 输 出 类 标 , χ A 是 类 标 为 i 的 一 个 分 类 器 集 合 w_j表示分类器C_j对应的权重,\hat y是输出类标,\chi_A是类标为i的一个分类器集合 wj表示分类器Cj对应的权重,y^是输出类标,χA是类标为i的一个分类器集合
软投票

p i j 是 第 j 个 分 类 器 预 测 为 i 的 概 率 p_{ij}是第j个分类器预测为i的概率 pij是第j个分类器预测为i的概率
投票法的使用条件
- 基模型之间的效果不能差别过大。当某个基模型相对于其他基模型效果过差时,该模型很可能成为噪声。
- **基模型之间应该有较小的同质性。**例如在基模型预测效果近似的情况下,基于树模型与线性模型的投票,往往优于两个树模型或两个线性模型。
投票法案例
from sklearn import datasets

from sklearn.preprocessing import StandardScaler
from sklearn.preprocessing import LabelEncoder
from sklearn.model_selection import train_test_split

from sklearn.ensemble import VotingClassifier
from sklearn.pipeline import make_pipeline
数据读取
iris = datasets.load_iris()

# 选择两种花型,两个属性
X,y = iris.data[50:,[1,2]],iris.target[50:]
np.unique(y)
array([1, 2])
le = LabelEncoder()
y = le.fit_transform(y)
np.unique(y)
array([0, 1], dtype=int64)
X_train,X_test,y_train,y_test = train_test_split(X,y,test_size = 0.5,random_state = 1)
基分类器与集成投票器
from sklearn.linear_model import LogisticRegression
from sklearn.tree import DecisionTreeClassifier
from sklearn.neighbors import KNeighborsClassifier
clf_lr = LogisticRegression(penalty='l2',C=1000,random_state=0)
clf_dt = DecisionTreeClassifier(random_state=0)
clf_knn = KNeighborsClassifier(n_neighbors=1,p=2)

pipe1 = make_pipeline(StandardScaler(),clf_lr)
pipe2 = make_pipeline(StandardScaler(),clf_dt)
pipe3 = make_pipeline(StandardScaler(),clf_knn)

models = [('lr',pipe1),
          ('dt',pipe2),
          ('KNN',pipe3)]

ensembel = VotingClassifier(estimators=models,voting='soft')
分类结果(训练集)
from sklearn.model_selection import cross_val_score
all_model = [pipe1,pipe2,pipe3,ensembel]
clf_labels = ['LogisticRegression','DecisionTreeClassifier','KNeighborsClassifier','Ensemble']
for clf,label in zip(all_model,clf_labels):
    score = cross_val_score(estimator=clf,
                           X = X_train,
                           y=y_train,
                           cv = 10,
                           scoring = 'roc_auc')
    print( 'roc_auc: %0.2f (+/- %0.2f) [%s]' % (score.mean(),score.std(),label))
roc_auc: 0.98 (+/- 0.05) [LogisticRegression]
roc_auc: 0.93 (+/- 0.11) [DecisionTreeClassifier]
roc_auc: 0.93 (+/- 0.15) [KNeighborsClassifier]
roc_auc: 0.98 (+/- 0.05) [Ensemble]
不同模型的auc_roc曲线(测试集)
from sklearn.metrics import roc_curve
from sklearn.metrics import auc
colors = ['black','orange','blue', 'green']
linestyles = [':','--','-.','-']
plt.figure(figsize=(10,8))
for clf, label, clr, ls in zip (all_model, clf_labels, colors, linestyles):
    # assuming the label of the positive class is 1
    y_pred = clf.fit(X_train, y_train).predict_proba(X_test)[:,1]
    fpr, tpr, thresholds = roc_curve(y_true=y_test, y_score=y_pred)
    roc_auc = auc(x=fpr, y=tpr)
    plt.plot (fpr, tpr, color=clr, linestyle=ls, label='%s (auc = %0.3f)'%(label, roc_auc) )
    plt.legend (loc='lower right')
    plt.plot ([0,1], [0, 1],linestyle='--',color='gray',linewidth=2)
plt.xlim ([-0.1, 1.1])
plt.ylim([-0.1, 1.1])
plt.grid()
plt.xlabel ('False Positive Rate')
plt.ylabel ('True Positive Rate')
plt.show()

不同模型的分类边界
sc = StandardScaler()
X_train_std =sc.fit_transform(X_train)
from itertools import product
x_min =X_train_std[:,0].min()-1
x_max =X_train_std[:,0].max() + 1
y_min =X_train_std[:,1].min()-1
y_max =X_train_std[:,1].max() + 1
xx, yy =np.meshgrid(np.arange(x_min, x_max, 0.1),np.arange(y_min, y_max, 0.1))
f, axarr = plt.subplots (nrows=2, ncols=2,
                         sharex='col',
                         sharey='row',
                         figsize=(7, 5) )
for idx, clf, tt in zip(product([0, 1], [0, 1]), all_model, clf_labels):
    clf.fit(X_train_std, y_train)
    z= clf.predict(np.c_[xx.ravel(),yy.ravel()])
    z= z.reshape(xx.shape)
    axarr[idx[0],idx[1]].contourf(xx, yy, z, alpha=0.3)
    axarr[idx[0],idx[1]].scatter(X_train_std[y_train==0,0],
                                 X_train_std[y_train==0,1]
                                 , c='blue',
                                 marker='^'
                                 ,s=50)
    axarr[idx[0],idx[1]].scatter(X_train_std[y_train==1,0],
                                 X_train_std[y_train==1,1]
                                 , c='red',
                                 marker='o'
                                 ,s=50)
    axarr[idx[0],idx[1]].set_title(tt)
plt.show()


 本文介绍了投票法作为集成学习的一种策略,通过多个分类器的多数投票来提高整体预测准确率。当基分类器的错误率低于0.5时,集成模型的错误率会低于单个分类器。文章展示了加权多数投票和软投票的概念,并通过Python代码示例解释了其工作原理。在鸢尾花数据集上的实验表明,投票法能够有效提高模型的AUC-ROC曲线和分类边界。


 1万+
1万+

 被折叠的 条评论
为什么被折叠?


