


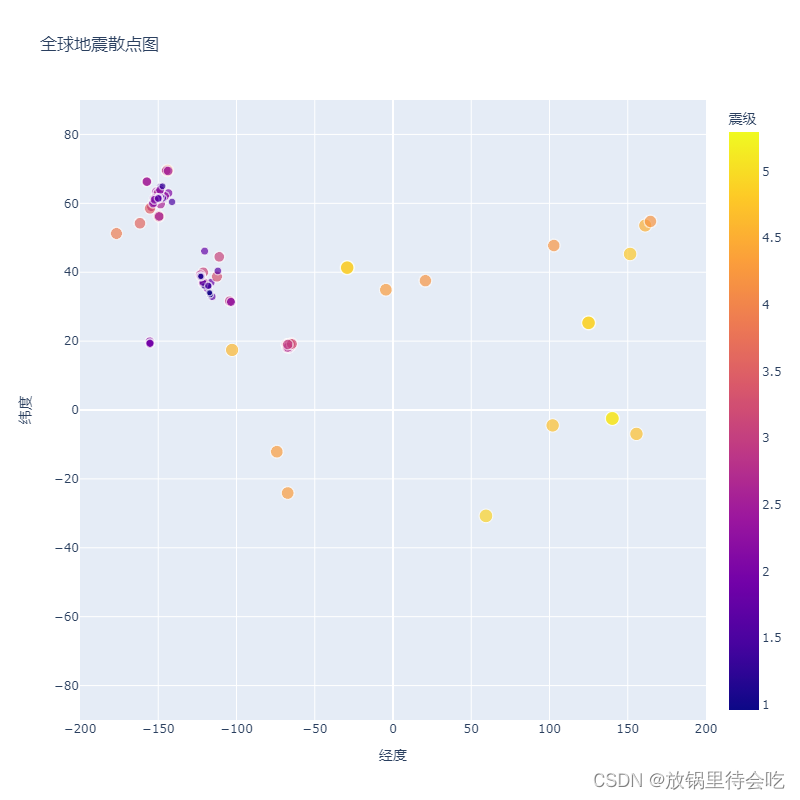
效果图如下:
相关代码如下:
1.eq_explore_data.py
import json

# 探索数据的结构
filename = 'data/eq_data_1_day_m1.json'
with open(filename) as f:
    all_eq_data = json.load(f)

all_eq_dicts = all_eq_data['features']
print(len(all_eq_dicts))

mags, titles, lons, lats = [], [], [], []
for eq_dict in all_eq_dicts:
    mag = eq_dict['properties']['mag']
    title = eq_dict['properties']['title']
    lon = eq_dict['geometry']['coordinates'][0]
    lat = eq_dict['geometry']['coordinates'][1]
    mags.append(mag)
    titles.append(title)
    lons.append(lon)
    lats.append(lat)

# 打印前十次地震的震级
print(mags[:10])
print(titles[:2])
print(lons[:5])
print(lats[:5])

readable_file = 'data/readable_eq_data.json'
with open(readable_file, 'w') as f:
    json.dump(all_eq_data, f, indent=4)
2.eq_world_map.py
import plotly.express as px
from eq_explore_data import lons, lats, titles, mags
import pandas as pd

filename = 'data/eq_data_1_day_m1.json'
data = pd.DataFrame(
    data=zip(lons, lats, titles, mags), columns=['经度', '纬度', '位置', '震级']
)
data.head()

fig = px.scatter(
    #x=lons,
    #y=lats,
    #labels={'x': '经度', 'y': '纬度'},
    data,
    x='经度',
    y='纬度',
    range_x=[-200, 200],
    range_y=[-90, 90],
    width=800,
    height=800,
    title='全球地震散点图',
    size='震级',
    size_max=10,
    color='震级',
    hover_name='位置',
)
fig.write_html('global_earthquakes.html')
fig.show()


 1556
1556


 被折叠的 条评论
为什么被折叠?
被折叠的 条评论
为什么被折叠?
 到【灌水乐园】发言


