


Landfill Process Modelling Workshop Modelling flow to leachate wells in landfills
摘要
垂直井常被用作控制堆填区的渗滤液水平的手段。对于没有任何基础渗滤液收集层的旧垃圾填埋场和安装排水基础设施失败的新场地,它们通常是唯一可用的脱水选择。当井被泵送时,在井的入口处形成一个渗流面,因此周围废物的下降不会像预期的那么大。利用具有渗流面模拟功能的MODFLOW-SURFACT数值地下水流动模型对填埋场的瞬态脱水进行了研究。研究表明,渗流面位置和诱导渗流场特征信息是垃圾填埋场井设计中不可忽视的重要因素。
1. Introduction
Landfill operators’ experiences of using leachate wells to control leachate levels are varied. It is common for the yield of leachate wells to be relatively small (often <1 m3 /day) and for the monitored drawdown around the well to be limited. The low yield of wells is related to the low hydraulic conductivity of the surrounding waste and may also be due to poor well design or badly developed wells. It is also tempting to attribute the limited drawdown in the waste to a clogged or inefficient well screen and filter pack. However, it is possible that the apparent lack of dewatering may in part be explained in terms of the development of a seepage face at the well. Seepage faces are caused by vertical components of flow in the vicinity of a pumped well where the drawdown in the well is a large proportion of the saturated thickness (Al-Thani and White, 2000; Bear, 1979). The purpose of this paper is to report on the possible effects of seepage faces in the dewatering of a landfill by a grid of pumped leachate wells.
1. 介绍
堆填区营办商使用渗滤液井控制渗滤液水平的经验各不相同。渗滤液井的产量通常相对较小(通常<1 m3 /天),并且井周围的监测降是有限的。井的低产量与周围废物的低水力导电性有关,也可能是由于井设计不良或井开发不良所致。人们也很容易将废物的有限减少归因于堵塞或低效的井筛和过滤包。然而,明显缺乏脱水可能在一定程度上可以用井中渗流面的发展来解释。渗流面是由泵井附近的垂直流分量引起的,在泵井附近,井内的降降占饱和厚度的很大比例(Al-Thani和White, 2000;熊,1979)。本文的目的是报告一个由泵送渗滤液井组成的网格在填埋场脱水过程中渗漏面可能产生的影响。
2. Method of analysis
Previous studies have considered the effect of seepage faces on pumped leachate wells (Rowe and Nadarajah, 1996) but results were only presented for steady state conditions. A method of analysis was required that could investigate the transient response to pumping, based on independently measured values of hydraulic conductivity and drainable porosity in a landfill.
MODFLOW-SURFACT is a commercially available fully integrated groundwater flow and transport code based on the USGS’ MODFLOW 3D groundwater flow model. The standard publicly available version of MODFLOW has certain limitations in simulating complex field problems, which make it unsuitable for modelling seepage faces around wells. The enhanced version, which was used for this study, incorporates additional computational modules that improve the simulation capabilities and robustness. Three of the many features that have been added are (1) the ability readily to accommodate conditions of desaturation and resaturation of aquifer systems, (2) the ability to simulate prescribed ponding, recharge, and seepage-face boundary conditions, and (3) the ability to perform axi-symmetric analysis. The reliability of the MODFLOW-SURFACT code has been assessed and found satisfactory in previous work by comparing the predicted results with available analytical and published seepage surface solutions (Al-Thani and White, 1999).
2. 分析方法
以前的研究考虑了渗流面对泵送渗滤液井的影响(Rowe和Nadarajah, 1996),但结果仅针对稳态条件提出。需要一种分析方法,可以根据垃圾填埋场的水力导电性和可排水孔隙度的独立测量值来研究泵送的瞬态响应。
MODFLOW- surfact是一款基于美国地质勘探局MODFLOW 3D地下水流动模型的商业化完全集成的地下水流动和运输代码。MODFLOW的标准公开版本在模拟复杂的现场问题方面存在一定的局限性,这使得它不适合模拟井周围的渗流面。本研究中使用的增强版本包含了额外的计算模块,可以提高模拟能力和鲁棒性。已经增加的许多功能中的三个是:(1)能够很容易地适应含水层系统的去饱和和再饱和条件,(2)能够模拟规定的池塘,补给和渗流面边界条件,以及(3)执行轴对称分析的能力。MODFLOW-SURFACT代码的可靠性已经在之前的工作中进行了评估,通过将预测结果与可用的分析和发表的渗流面解进行比较,发现MODFLOW-SURFACT代码的可靠性令人满意(Al-Thani和White, 1999)。
3. 问题描述
图1显示了一个30米深的垃圾填埋场的示意图,其中有一个20米深的饱和区,以及一个间隔10米的渗滤液泵井网格。这个间距在某种程度上是任意的,但可能代表了大多数垃圾填埋场可能安装的最接近的井间距(每公顷100口井)。假定井完全穿透垃圾填埋场,井的固定半径为0.15 m。这些井的泵送速度保持在井内完全抽汲的状态。
在这种离散化方案中,使用单个单元(平面视图)来表示泵送井。单元的尺寸(x坐标和y坐标)被设置为井的直径(0.3 m),相邻单元的(柱和行)尺寸被设置为井直径的一小部分。随着离井距离的增加,细胞尺寸逐渐增大。任何两个相邻单元的扩展系数a一般不大于1.5。模型的边界设置为在x和y方向距离井5米处无流动边界。模型纵向分为21层,如图1所示。第1层厚度设为10 m(代表非饱和带),其余层厚度设为1 m。
初始饱和渗滤液水位设置为20 m。基于对废物水文地质性质的研究,本研究采用了5%的可排水孔隙度(Hudson et al ., 1999)。水力导电性随深度的变化是基于水力导电性与有效应力之间的关系,由Powrie和heaven(1999)以及heaven(2000)通过实验确定。本研究使用了实验数据的“最佳”拟合和“最坏情况”拟合两种情况(表1)。
通过将恒定的水头和排水装置组合到代表该井的单元中,可以复制该井的操作。一个恒定的头细胞(头为零)分配给模型底层的细胞(即井完全脱水),并将细胞排到上面的每一层。如果模型的头部高于排水管设置的水平,则排水管通过从模型中除去水来运行。每个排水池被分配了一个与该池的高程水头相等的水头。这具有在井处应用渗流面边界条件的效果。
4. Results of numerical investigation
The MODFLOW-SURFACT code was used to solve the described problem for both hydraulic conductivity scenarios in Table 1 over a period of 200 days. Fig. 2 shows the location of piezometric head after 50 days, 100 days and 200 days of pumping.
The solid lines represent the elevation of the phreatic surface, i.e. the location at which leachate would be encountered if an observation well was drilled from the surface. These lines are relatively flat. The dashed lines represent the piezometric levels at the base of the site.
The leachate levels drop faster in the best fit scenario of hydraulic conductivity. This is an expected result, because higher hydraulic conductivity values lead to higher well discharges as shown in Table 2.
The equation for steady state flow to a pumped well in an unconfined aquifer is
4. 数值研究结果
MODFLOW-SURFACT代码用于在200天的时间内解决表1中两种水力导电性情景所描述的问题。图2为泵送50天、100天和200天的压头位置。
实线表示潜水表面的高度,即如果从表面钻一个观察井,将会遇到渗滤液的位置。这些线是相对平坦的。虚线表示场地底部的测压水平。
在水力导率最适宜的情况下,渗滤液水平下降得更快。这是一个预期的结果,因为更高的水力导率值导致更高的井排量,如表2所示。
无承压含水层抽油井稳态流方程为

该方程基于Dupuit-Forchheimer假设,即流体是水平的,并且在各向同性地层中随深度均匀分布,地层下部为不透水地层。该方程忽略了井处的渗流面(Bouwer, 1978)。
然而,Hantush(1964)研究了确定井流量方程的适用性,他发现尽管存在渗流面,方程(1)仍给出了准确的结果。但由于没有考虑渗流面的存在,式(1)不能给出准确的潜水面形状曲线。Muskat(1937)和Wyckoff等人(1932)利用实验研究的结果发现,沿着基座的测压头,而不是自由表面,与式(1)密切相关。此外,Dupuit-Forchheimer假设要求使用水力导电性的总体平均值。因此,在式(1)中没有考虑固体垃圾填埋场中水力导率随深度的变化。
Eq. (1) may be used to estimate an overall instantaneous effective hydraulic conductivity for a matrix in which the permeability varies with depth.
To do this the results from the numerical analysis were substituted into Eq. (1) to determine an overall average hydraulic conductivity for each time step.
In this case, h2=H (=20 m) and h1=0.
The radius of influence, r2, was based on ( A/π)^1/2 where A is the plan area of the model (A=55=25m2 ) which lead to R=5.64 m. Following Beljian (1988), the radius of the well r1 was taken to be the effective well radius, which is equal to 0.2 times the size of the element representing the well (i.e. 0.2*0.3=0.06 m).
Hence the ratio r2/r1 was assumed to be 5.64/0.06=94.
式(1)可用于估计渗透率随深度变化的基质的总瞬时有效水力导率。
为此,将数值分析的结果代入方程(1),以确定每个时间步长的总体平均水力导电性。
在本例中,h2=H (=20 m), h1=0。
影响半径r2基于(A /π)^1/2,其中A是模型的平面面积(A=55=25m2),因此R=5.64 m。继Beljian(1988)之后,采用r1井的半径作为有效井半径,其等于代表井的单元尺寸的0.2倍(即0.2*0.3=0.06 m)。
因此,假设比值r2/r1为5.64/0.06=94。
The results are recorded in Table 3. A comparison of the calculated hydraulic conductivities with Table 1 indicates that it is the hydraulic conductivity in the lower layers that appears to control flow rates. Table 3 also contains a calculation of the equivalent annual infiltration rate Q=A corresponding to the flow rate Q.
These values indicate that the average flow rate could approach typical annual infiltration rates into uncapped landfills in the UK. Where this occurred reductions in leachate levels would be difficult to progress, and may indeed reverse, and an increase in the density of the well array would be required to continue dewatering.
结果记录在表3中。将计算得到的水力导率与表1的对比表明,控制流量的似乎是下层的水力导率。表3还包含了与流量Q对应的年等效入渗速率Q= a的计算。
这些值表明,在英国,平均流量可以接近典型的年渗透速率进入未封顶的垃圾填埋场。在这种情况下,降低渗滤液水平将很难取得进展,甚至可能发生逆转,并且需要增加井阵列的密度才能继续脱水。
The numerical simulation also provided data on flow rates into the well from each 1 m thick layer in the model. Fig. 3 shows that the maximum flow into the well (Q) generally occurred at the very base of the model, despite this corresponding with the layer with the lowest hydraulic conductivity. The explanation for this is that hydraulic gradients within the seepage face in the waste adjacent to the well are predominantly vertical. This drives leachate downwards towards the base of the model (rather than into the well) until the lower impermeable barrier is reached.
The exception to this is during the early stages of dewatering, before the vertical hydraulic gradients associated with the seepage face have become established and when flow is predominantly horizontal into the well. At this stage there is a closer relationship between the vertical distribution of flow rates into the well and the variation in hydraulic conductivity with depth. This is seen mainly in the simulation using the worst case hydraulic conductivity at times earlier than 20 days. It is also evident within the data set for the best fit hydraulic conductivity model at a time of 5 days. As dewatering progresses more rapidly with the higher hydraulic conductivities, data for times earlier than 5 days for the best fit hydraulic conductivity model would produce similar curves to those produced for worst case hydraulic conductivity model prior to 20 days.
数值模拟还提供了模型中每1m厚层流入井中的流量数据。从图3中可以看出,进入井内的最大流量(Q)通常出现在模型的最底部,尽管这与水力导率最低的层相对应。这种现象的解释是,在靠近井的废物中,渗流面的水力梯度主要是垂直的。这使得渗滤液向下流向模型底部(而不是进入井中),直到达到较低的不透水屏障。
唯一的例外是在脱水的早期阶段,在与渗流面相关的垂直水力梯度建立之前,当流体主要是水平流入井中时。在这一阶段,进入井内的流量垂直分布与水力导率随深度的变化之间的关系更为密切。这主要是在使用最坏情况下的模拟中看到的,时间早于20天。在5天的时间内,最适合的水力导率模型的数据集也很明显。随着水力导度的增大,脱水速度加快,最佳拟合的水力导度模型在5天之前的数据与最差情况下的水力导度模型在20天之前的数据相似。
5. Algebraic representation
5. 代数表示
The numerical investigation indicates that the drop of the leachate elevation is almost flat. This observation can be used to develop a simple algebraic representation of the data which may be used to extrapolate the results so that they can be applied to similar systems with different dimensions and hydrogeological parameters.
Assuming that the piezometric surface is effectively horizontal, the flow Q at any time t may be equated to the rate of change of the drained volume above the surface. This volume is equal to AS( H_0 -H )where A is the plan area and S is porosity (see Fig. 4). Thus,
数值研究表明,渗滤液高程的下降几乎是平缓的。这一观察结果可用于建立数据的简单代数表示,可用于推断结果,以便将其应用于具有不同尺寸和水文地质参数的类似系统。
假设测压表面实际上是水平的,则任意时刻t的流量Q可等于该表面上方排水体积的变化率。该体积等于AS(H_0 -H),其中A为平面面积,S为孔隙度(见图4)。

However Q may be calculated using Dupuit-Forchheimer equation so that
然而,Q可以用Dupuit-Forchheimer方程计算,这样

Rearranging and integrating we have,
重新排列和整合,

The data in Table 2 have been plotted on this basis in Fig. 5 with A=100 m2 , S=0.05 and R/rw=5.64/0.06.
The outcome is
表2中的数据在此基础上绘制在图5中,A=100 m2, S=0.05, R/rw=5.64/0.06。
结果是

Fig. 4. Parameter definition diagram for theoretical representation.
图4所示。参数定义图为理论表示。
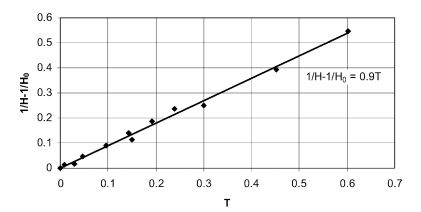
图5所示。将表2中的数据绘制得到Eqn (2)

取K为最底层的水力导率。Eq.(2)中的值0.9实际上是一个校正解析模型以拟合数值模型结果的系数。该分析模型不考虑水力导率随深度的变化,并以一种非常简化的方式表示时间依赖性。因此,值得注意的是,这样一个简单而有用的方程只需要对时间参数T进行很小的修改就可以推导出来。
6. Conclusions
The impact of the development of a seepage face at a vertical well has been demonstrated in the context of landfill dewatering. Strong vertical seepage velocities are set up resulting in pore pressures in the upper part of the landfill being higher than at the base producing an almost horizontal phreatic surface. Care therefore needs to be taken when carrying out field investigations to assess the pore pressures on the base of a landfill: only piezometers with a well defined and limited response zone should be used for this purpose. Fully screened observation wells in close proximity to a pumped well will give ambiguous if not meaningless results.
When a well is initially pumped, and before seepage faces have developed, hydraulic gradients are predominantly horizontal. Consequently, the vertical distribution of flow rates into the well is related to the vertical variation in hydraulic conductivity with depth.
In the cases analysed, where the hydraulic conductivity of the waste reduces with depth, flow rates into the well are greatest in the upper saturated layers and reduce with depth.
With continuous pumping over time a seepage face develops as hydraulic gradients in the immediate vicinity of the well change from being predominantly horizontal to predominantly vertical. The vertical distribution of flow rates into the well also changes and becomes greatest at the base of the well even though this corresponds to the lowest hydraulic conductivity layer
6. 结论
在垃圾填埋场脱水的背景下,论证了直井渗流面发展的影响。竖向渗流速度强,导致填埋场上部孔隙压力高于底部,形成几乎水平的潜水面。因此,在进行实地调查以评估填埋场底部的孔隙压力时,需要注意:只有具有明确定义和有限响应区的压力表才能用于此目的。在靠近抽油井的地方进行全面筛检的观察井,其结果即使不是毫无意义,也是模棱两可的。
当油井最初被泵送时,在渗流面发育之前,水力梯度主要是水平的。因此,入井流量的垂向分布与导水率随深度的垂向变化有关。
在所分析的情况下,当废物的水力导电性随深度而降低时,进入井中的流量在上部饱和层最大,并随深度而降低。
随着时间的推移,随着井附近的水力梯度从以水平为主变为以垂直为主,渗流面也随之发展。进入井内的流量的垂直分布也发生了变化,在井底达到最大,尽管这对应于最低的水力导流层
6. Conclusions
The impact of the development of a seepage face at a vertical well has been demonstrated in the context of landfill dewatering. Strong vertical seepage velocities are set up resulting in pore pressures in the upper part of the landfill being higher than at the base producing an almost horizontal phreatic surface. Care therefore needs to be taken when carrying out field investigations to assess the pore pressures on the base of a landfill: only piezometers with a well defined and limited response zone should be used for this purpose. Fully screened observation wells in close proximity to a pumped well will give ambiguous if not meaningless results.
When a well is initially pumped, and before seepage faces have developed, hydraulic gradients are predominantly horizontal. Consequently, the vertical distribution of flow rates into the well is related to the vertical variation in hydraulic conductivity with depth.
In the cases analysed, where the hydraulic conductivity of the waste reduces with depth, flow rates into the well are greatest in the upper saturated layers and reduce with depth.
With continuous pumping over time a seepage face develops as hydraulic gradients in the immediate vicinity of the well change from being predominantly horizontal to predominantly vertical. The vertical distribution of flow rates into the well also changes and becomes greatest at the base of the well even though this corresponds to the lowest hydraulic conductivity layer in the simulations. The overall yield from the well appears to be controlled by the hydraulic conductivity in these lowest layers. The Dupuit-Forchheimer equation for steady state flow to a pumped well can be used to predict discharge rates with a reasonable degree of accuracy if the hydraulic conductivity at the base of the site is used in the equation.
For the case of a 30 m deep landfill, the predicted yield from pumped wells becomes very low when leachate levels are drawn down below approximately 1.5–3 m (for a grid of pumped wells at 10 m spacing). Rates of dewatering become slow and could even stop if the pumped rate falls below the equivalent annual rainfall infiltration rate. The data obtained for the case of a model with specific dimensions has been used to calibrate a conventional algebraic model which can be used to extrapolate the results to systems with similar geometry at different scales.
6. 结论
在垃圾填埋场脱水的背景下,论证了直井渗流面发展的影响。竖向渗流速度强,导致填埋场上部孔隙压力高于底部,形成几乎水平的潜水面。因此,在进行实地调查以评估填埋场底部的孔隙压力时,需要注意:只有具有明确定义和有限响应区的压力表才能用于此目的。在靠近抽油井的地方进行全面筛检的观察井,其结果即使不是毫无意义,也是模棱两可的。
当油井最初被泵送时,在渗流面发育之前,水力梯度主要是水平的。因此,入井流量的垂向分布与导水率随深度的垂向变化有关。
在所分析的情况下,当废物的水力导电性随深度而降低时,进入井中的流量在上部饱和层最大,并随深度而降低。
随着时间的推移,随着井附近的水力梯度从以水平为主变为以垂直为主,渗流面也随之发展。井内流量的垂直分布也发生了变化,并且在井底处达到最大,尽管在模拟中这对应的是最低的水力导电性层。井的总产量似乎是由这些最低层的水力导电性控制的。如果在方程中使用井底的水力传导性,则用于泵送井稳态流量的Dupuit-Forchheimer方程可以以合理的精度预测排量。
对于30米深的垃圾填埋场,当渗滤液水位降至约1.5-3米以下时(对于间隔10米的抽水井网格),抽水井的预测产量变得非常低。脱水速率变慢,如果抽水速率低于等效年降雨量入渗速率,甚至可能停止。对于具有特定尺寸的模型所获得的数据已用于校准传统的代数模型,该模型可用于将结果外推到具有不同尺度的相似几何结构的系统。
References:
Al-Thani A.A., White J.K., 1999. The impact of the seepage surface on the design of pump-and-treat remediation systems for contaminated aquifers-based on single well. Workshop on Ground Water Pollution, Protection and Remediation, November 7-10, Qatar.
Al-Thani A.A., White J.K., 2000. The impact of the seepage surface on the design of pump-and-treat remediation systems for contaminated aquifers-based on multiple wells. Groundwater 2000, Proceedings of the International Conference on Groundwater Research, June 6-8, Copenhagen-Denmark, A.A. Balkema, Rotterdam.
Bear, J., 1979. Hydraulics of Groundwater. McGraw-Hill Inc., New York. 569 p.
Beaven R.P., 2000. The Hydrogeological and Geotechnical Properties of Household Waste in relation to Sustainable Landfilling. PhD Dissertation, University of London.
Beljian M.S., 1988. Representation of individual wells in two-dimensional groundwater water modeling. Proceedings of Solving Ground Water Problems with Models, Denver, 10-12 February 1988.
Bouwer H., 1978. Groundwater Hydrology. McGraw-Hill. ISBN 0-07006715-5.
Hantush M.S., 1964. Hydraulics of Wells in V.T. Chow, Advances in Hydroscience, Vol. 1, Academic Press Inc., San Diego, California, pp. 281-432.
Hudson A.P., Beaven R.P., Powrie W., 1999. Measurement of the hydraulic conductivity of household waste in a large scale compression cell. Sardinia 99, Proceedings of the Seventh International Waste Management and Landfill Symposium, S. Margherita di Pula, Cagliari, Italy; October 4-8, Vol III, pp 461-468.
Muskat, M., 1937. The Flow of Homogeneous Fluids Through Porous Media. McGraw-Hill Inc., New York. p. 763.
Powrie W. and Beaven R. P., 1999. Hydraulic properties of household waste and implications for liquid flow in landfills. Proceedings of the Institution of Civil Engineers, Geotechnical Engineering, October 1999.
Rowe, K., Nadarajah, P., 1996. Estimating leachate drawdown due to pumping wells in landfills. Journal of Canadian Geotechnical 33, 1-10.
Wyckoff, R.D., Botset, H.G., Muskat, M., 1932. Flow of liquids through porous media under the action of gravity. Physics 2, 90-113.


 595
595

 被折叠的 条评论
为什么被折叠?
被折叠的 条评论
为什么被折叠?
 到【灌水乐园】发言


