


培训通知
GBD最新免费数据公布啦!快速利用发表SCI论文。欢迎参加6.1-6.2 GBD直播课,我们来指导
Question
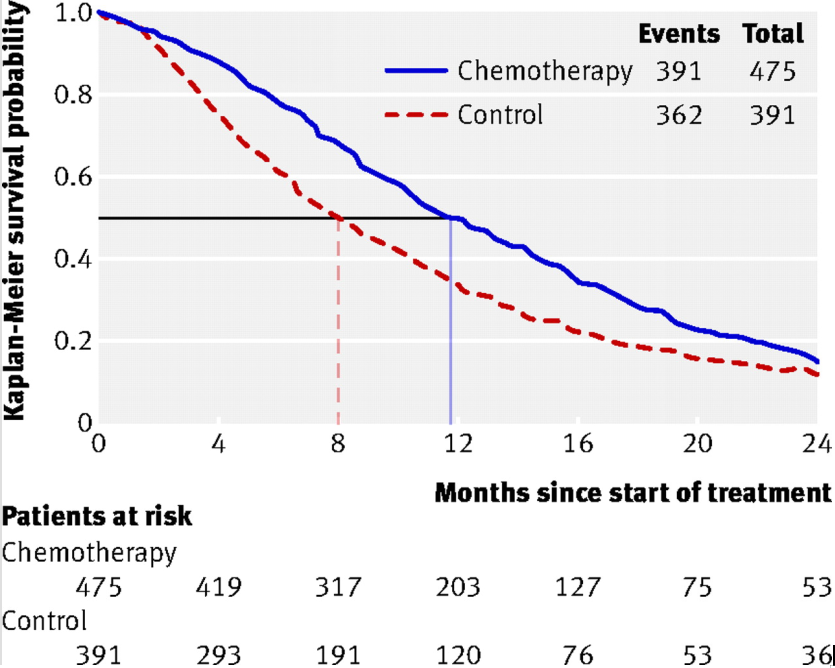
A meta-analysis investigated the effects of palliative chemotherapy in patients with locally advanced or metastatic colorectal cancer. Randomised controlled trials that compared palliative chemotherapy with supportive care were included. Seven trials with a common study period of 24 months were identified, providing individual data on a total of 866 patients. Outcome measures included the length of time until death after starting treatment. The Kaplan-Meier survival curves for the length of time until death for the treatments of palliative chemotherapy and supportive care were presented (figure⇓). The median survival time was estimated to be 8.0 months in the supportive care group and 11.7 months in the chemotherapy group.
KaplanMeier survival curves of overall survival for the chemotherapy and supportive care treatment groups. The number of events (total deaths in each group) are indicated. The median survival time for each treatment group is the length of time corresponding to the probability of 0.5.
Which one of the following best describes the median survival time of 11.7 months for the chemotherapy group?
a) Chemotherapy was delivered for an average of 11.7 months.
b) Half of the patients undergoing chemotherapy were alive at 11.7 months after starting treatment.
c) The probability of surviving 11.7 months or longer after starting chemotherapy was 0.5.
提示:正确答案只有一个。
Answer
Answer c is the best description of the median survival time for the chemotherapy group.
The study investigated whether chemotherapy, when compared with supportive care, prolonged the length of life of patients with locally advanced or metastatic colorectal cancer. For each patient the length of time after starting treatment until death was recorded. The length of time a patient remained alive is referred to as time to event or survival data. The event of interest was death.
The Kaplan-Meier survival curves displayed do not indicate straightforward absolute probabilities—that is, they do not simply indicate the proportion of patients in each treatment group still alive at each time point after starting treatment. This is because there were “censored” observations for each treatment group, as indicated by the survival curves not reaching zero probability when the study concluded at 24 months. Censored observations have been described in a previous question. The probabilities shown are called Kaplan-Meier or conditional probabilities and have a unique interpretation. For the 24 months after starting treatment, the survival curves indicate the probability of surviving at least a particular length of time—that is, the probability of surviving so many months, or longer, after starting treatment. The numbers of patients still alive, and therefore at risk of death, are displayed.
The median survival time for the chemotherapy group was 11.7 months. Therefore, the probability of surviving at least 11.7 months—that is, of surviving 11.7 months or longer after starting treatment—was 0.5 (answer c). It is derived by drawing a horizontal line across from the probability of 0.5. The time point at which this line crosses the curve for the chemotherapy group is the median survival time.As there were censored observations, the median survival time does not indicate the time when half of the patients on chemotherapy treatment were still alive (answer b). It is not possible to estimate from the Kaplan-Meier survival curve the average length of time chemotherapy was administered (answer a).
Basing communication to patients about prognosis and potential treatment options on the Kaplan-Meier survival curves above could be challenging. Obviously death from cancer is an emotive subject. The probabilities are based on groups of people and are, therefore, difficult to relate to an individual. It may be hard to find the balance between explaining statistical information accurately and using words or concepts that are unambiguous to the patient. It is recognised that there are no right answers.
Explanation of the median survival time for the chemotherapy group as described above may not be easily understood and could present further uncertainty. To say that half of patients survive at least 11.7 months, with no indication of how much longer, might not be useful. Presenting percentages can be unhelpful to patients. It may be more meaningful to use natural frequencies and round numbers when discussing a “median survival of 11.7 months.” For example, when comparing treatment options a clinician could explain, “If there are 100 people in your situation, 50 will live at least one year after chemotherapy, compared with eight months with supportive care.” Although details about maximum survival expectations might be relevant, they could give false hope regarding actual survival.
It is essential that the communication about possible survival is combined with information about potential side effects of treatment and quality of life.
所以答案是选择 c
每天学习一点,你会更强大!


 2326
2326


 被折叠的 条评论
为什么被折叠?
被折叠的 条评论
为什么被折叠?
 到【灌水乐园】发言


