


「写在前面」
在科研数据分析中我们会重复地绘制一些图形,如果代码管理不当经常就会忘记之前绘图的代码。于是我计划开发一个 R 包(Biorplot),用来管理自己 R 语言绘图的代码。本系列文章用于记录 Biorplot 包开发日志。
相关链接
相关代码和文档都存放在了 Biorplot GitHub 仓库:
https://github.com/zhenghu159/Biorplot
欢迎大家 Follow 我的 GitHub 账号:
https://github.com/zhenghu159
我会不定期更新生物信息学相关工具和学习资料。如果您有任何问题和建议,或者想贡献自己的代码,请在我的 GitHub 上留言。
介绍
饼状图,常用于展示数据的相对比例。饼状图以圆形图案为基础,将数据分成不同的扇区,每个扇区的大小代表相应数据的相对大小。饼状图可以直观地展示不同数据之间的比例关系,帮助观察者快速了解数据的分布情况。
在 Biorplot 中,我封装了 Bior_PiePlot() 函数来实现饼状图的绘制。
基础饼状图
绘制一个基础的饼状图如下:
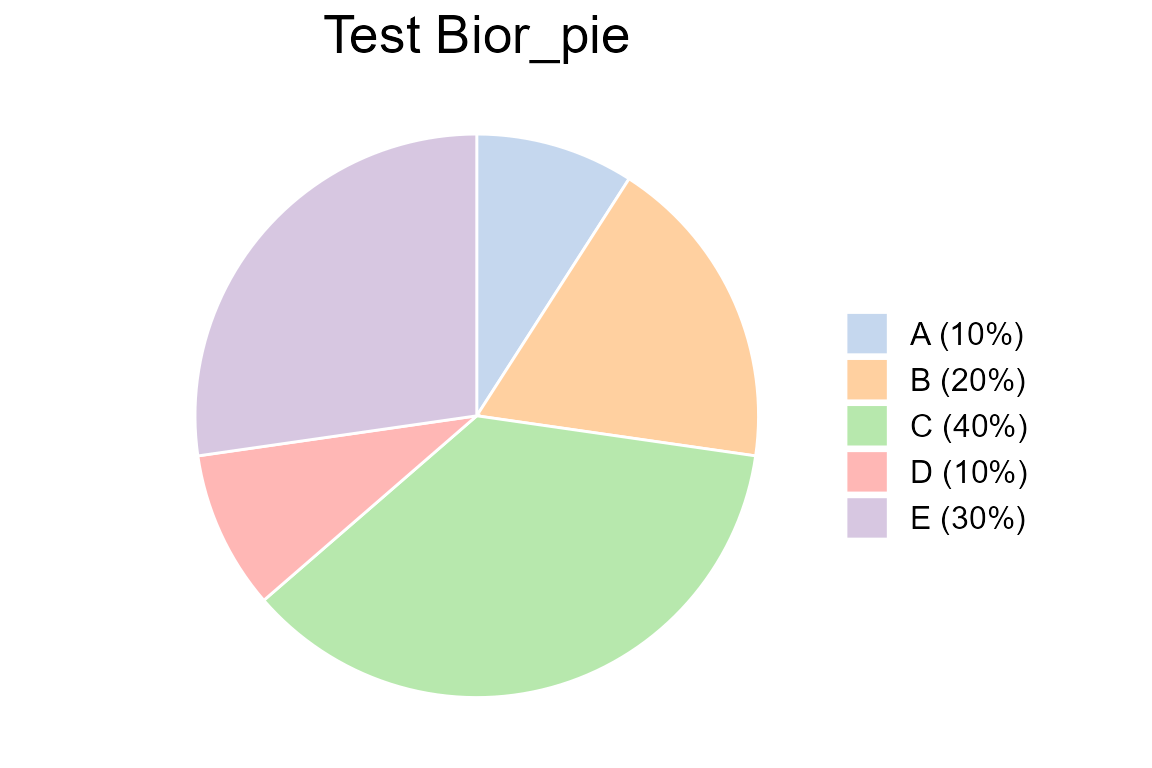
绘图代码:
value <- c(0.1,0.2,0.4,0.1,0.3)
type <- c("A (10%)", "B (20%)", "C (40%)", "D (10%)", "E (30%)")
col <- c("#AEC7E8B2", "#FFBB78B2", "#98DF8AB2", "#FF9896B2", "#C5B0D5B2")
p <- Bior_PiePlot(value=value, type=type, col=col, title="Test Bior_pie")
p
带标签饼状图
绘制一个带有百分比标签的饼状图如下:
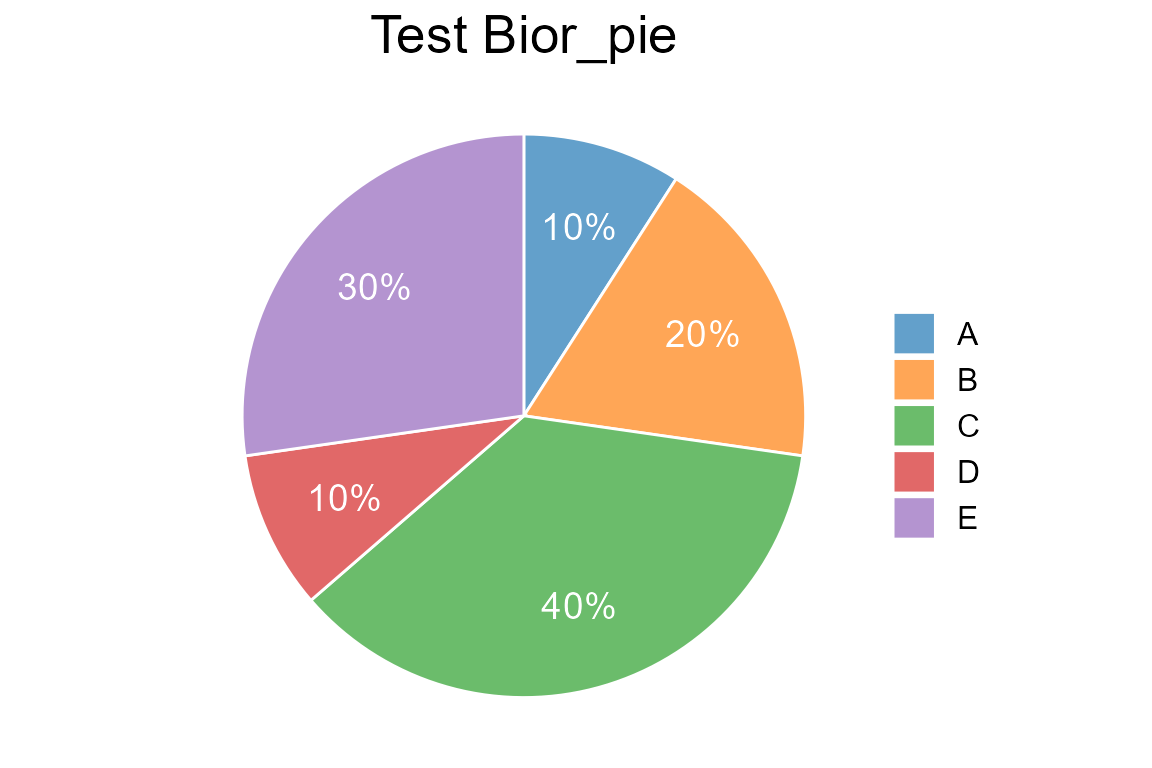
绘图代码:
value <- c(0.1,0.2,0.4,0.1,0.3)
type <- c("A", "B", "C", "D", "E")
label <- c("10%","20%","40%","10%","30%")
col <- c("#1F77B4B2", "#FF7F0EB2", "#2CA02CB2", "#D62728B2", "#9467BDB2")
p <- Bior_PiePlot(value=value, type=type, label=label, col=col, title="Test Bior_pie", label.x=1.2, label.color="white", label.size=5)
p
源码解析
Biorplot::Bior_PiePlot() 函数主要使用了 ggplot2 来绘制饼状图。使用 ggplot2::geom_text() 设置标签文本的显示,相关参数:
-
valueA vector of value -
typeA vector of type -
label(defaut: label=NULL); A vector of label -
col(defaut: col=pal_d3("category20,",alpha=0.7)(20)); colour for type -
title(defaut: title=""); title for plot -
text.size(defaut: text.size=15); text size -
plot.title.size(defaut: plot.title.size=20); plot.title size -
label.x(defaut: label.x=1.2); geom_text x for label -
label.color(defaut: label.color="white"); geom_text color for label -
label.size(defaut: label.size=5); geom_text size for label
源码:
#%%%%%%%%%%%%%%%%%%%%%%%%%%%%%%%%%%%%%%%%%%%%%%%%%%%%%%%%%%%%%%%%%%%%%%%%%%%%%%%

#' Pie Plot
#' @description Create a Pie plot.
#'
#' @import ggplot2
#' @importFrom ggsci pal_d3
#'
#' @param value A vector of value
#' @param type A vector of type
#' @param label (defaut: label=NULL); A vector of label
#' @param col (defaut: col=pal_d3("category20,",alpha=0.7)(20)); colour for type
#' @param title (defaut: title=""); title for plot
#' @param text.size (defaut: text.size=15); text size
#' @param plot.title.size (defaut: plot.title.size=20); plot.title size
#' @param label.x (defaut: label.x=1.2); geom_text x for label
#' @param label.color (defaut: label.color="white"); geom_text color for label
#' @param label.size (defaut: label.size=5); geom_text size for label
#'
#' @return A ggplot object
#' @export
#'
#' @examples
#' # Examples 1
#' value <- c(0.1,0.2,0.4,0.1,0.3)
#' type <- c("A (10%)", "B (20%)", "C (40%)", "D (10%)", "E (30%)")
#' col <- c("#AEC7E8B2", "#FFBB78B2", "#98DF8AB2", "#FF9896B2", "#C5B0D5B2")
#' p <- Bior_PiePlot(value=value, type=type, col=col, title="Test Bior_pie")
#' p
#'
#' # Examples 2
#' value <- c(0.1,0.2,0.4,0.1,0.3)
#' type <- c("A", "B", "C", "D", "E")
#' label <- c("10%","20%","40%","10%","30%")
#' col <- c("#AEC7E8B2", "#FFBB78B2", "#98DF8AB2", "#FF9896B2", "#C5B0D5B2")
#' p <- Bior_PiePlot(value=value, type=type, label=label, col=col, title="Test Bior_pie",
#'                   label.x=1.2, label.color="white", label.size=5)
#' p
#'
Bior_PiePlot <- function(
    value, type, label=NULL, col=pal_d3("category20",alpha=0.7)(20), title="",
    text.size=15, plot.title.size=20,
    label.x=1.2, label.color="white", label.size=5)
{
  df <- data.frame(value=value, type=type)
  df$label <- label
  df$type <- factor(df$type, levels=type)

  p <-
    ggplot(df, aes(x='', y=value, fill=type)) +
    geom_bar(stat="identity", width=1, color="white",
             position = position_stack(reverse =T)) +
    coord_polar("y", start=0) +
    theme_void() +
    theme(text = element_text(size = text.size),
          plot.title = element_text(size=plot.title.size, hjust = 0.5),
          legend.title = element_blank()) +
    scale_fill_manual(values = col) +
    labs(title = title)

  if (!is.null(label)){

    p <- p +
      geom_text(aes(x = label.x, label = label), color = label.color, size=label.size,
                position = position_stack(reverse =T, vjust=0.5))
  }
  return(p)
}

#%%%%%%%%%%%%%%%%%%%%%%%%%%%%%%%%%%%%%%%%%%%%%%%%%%%%%%%%%%%%%%%%%%%%%%%%%%%%%%%
注:本文为个人学习笔记,仅供大家参考学习,不得用于任何商业目的。如有侵权,请联系作者删除。

本文由 mdnice 多平台发布


 被折叠的 条评论
为什么被折叠?
被折叠的 条评论
为什么被折叠?
 到【灌水乐园】发言


