


👨🎓个人主页:研学社的博客
💥💥💞💞欢迎来到本博客❤️❤️💥💥
🏆博主优势:🌞🌞🌞博客内容尽量做到思维缜密,逻辑清晰,为了方便读者。
⛳️座右铭:行百里者,半于九十。
📋📋📋本文目录如下:🎁🎁🎁
目录

💥1 概述
文献来源:
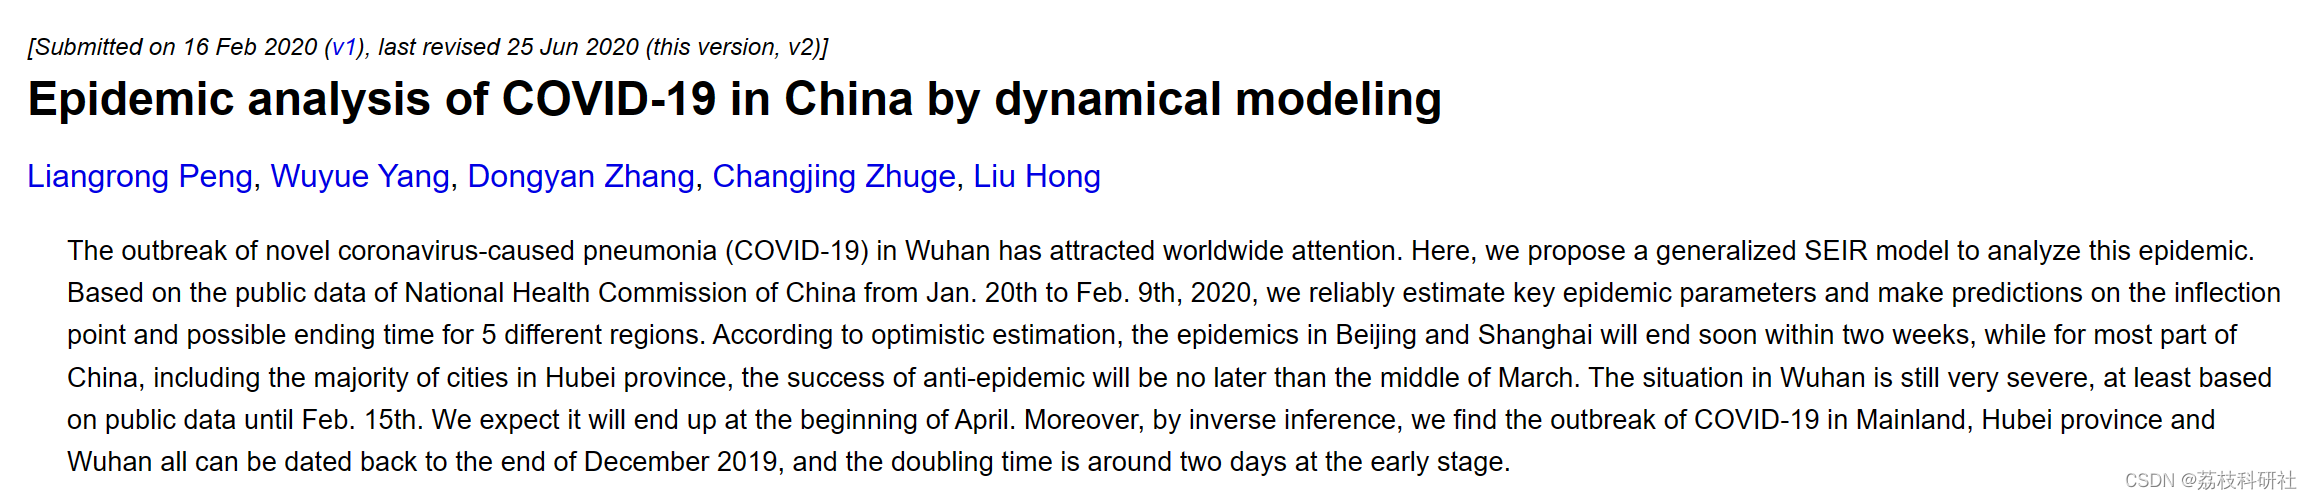
武汉新型冠状病毒感染的肺炎(COVID-19)的爆发引起了全世界的关注。在这里,我们提出了一个广义的SEIR模型来分析这种流行病。根据中国国家卫生健康委员会2020年1月20日至2月9日的公开数据,对5个不同地区的疫情关键参数进行了可靠估计,并对疫情拐点和可能结束时间进行了预测。乐观估计,北京和上海的疫情将在两周内结束,而中国大部分地区,包括湖北省大部分城市,最迟将在3月中旬取得抗疫成功。至少从2月15日之前的公开数据来看,武汉的形势仍然非常严峻。我们预计它将在四月初结束。此外,通过反向推断,我们发现大陆、湖北省和武汉市的疫情都可以追溯到2019年12月底,早期的翻倍时间在2天左右。
原文摘要:
The outbreak of novel coronavirus-caused pneumonia (COVID-19) in Wuhan has attracted worldwide attention. Here, we propose a generalized SEIR model to analyze this epidemic. Based on the public data of National Health Commission of China from Jan. 20th to Feb. 9th, 2020, we reliably estimate key epidemic parameters and make predictions on the inflection point and possible ending time for 5 different regions. According to optimistic estimation, the epidemics in Beijing and Shanghai will end soon within two weeks, while for most part of China, including the majority of cities in Hubei province, the success of anti-epidemic will be no later than the middle of March. The situation in Wuhan is still very severe, at least based on public data until Feb. 15th. We expect it will end up at the beginning of April. Moreover, by inverse inference, we find the outbreak of COVID-19 in Mainland, Hubei province and Wuhan all can be dated back to the end of December 2019, and the doubling time is around two days at the early stage.
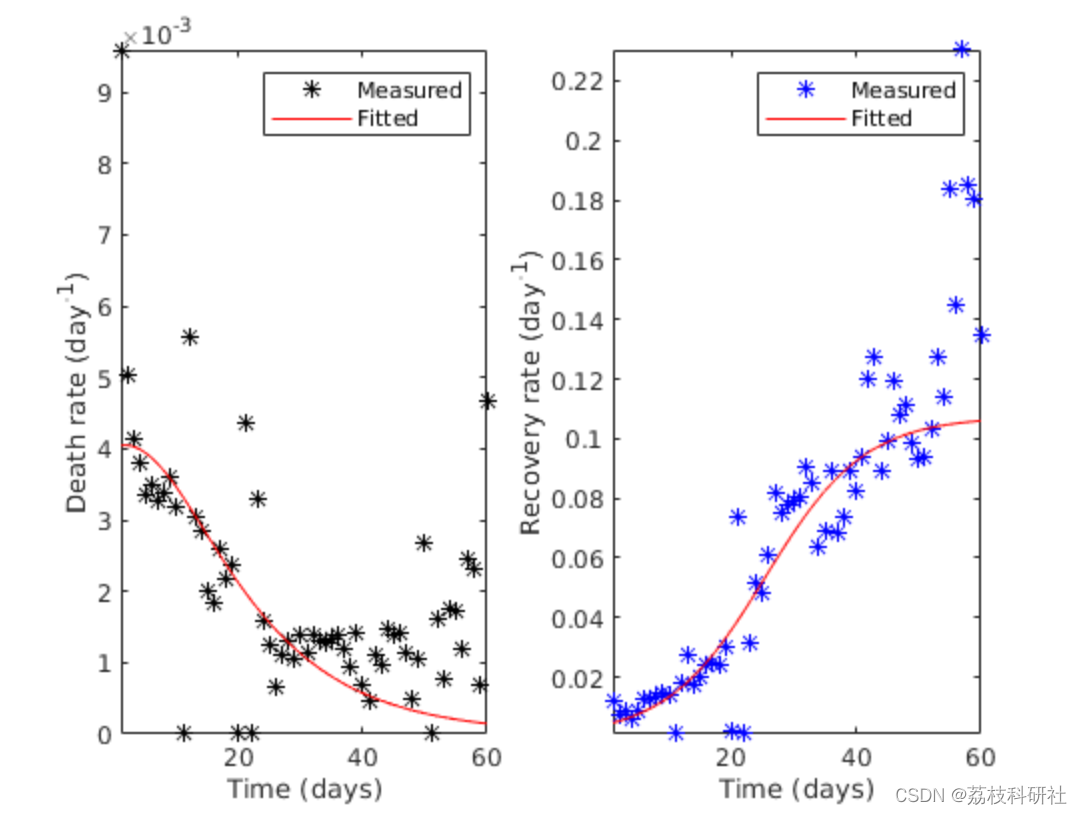
本文与参考文献 [1] 相关的一些主要差异。其中有死亡率和康复率的表示,是当时的分析和经验函数。这种时间依赖性背后的想法是,随着时间的增加,死亡率和恢复率应该收敛到一个恒定值。如果死亡率保持不变,死亡人数可能会被高估。这里没有模拟出生和自然死亡。这意味着总人口,包括死亡病例数,保持不变。请注意,详细讲解参考文献[1].
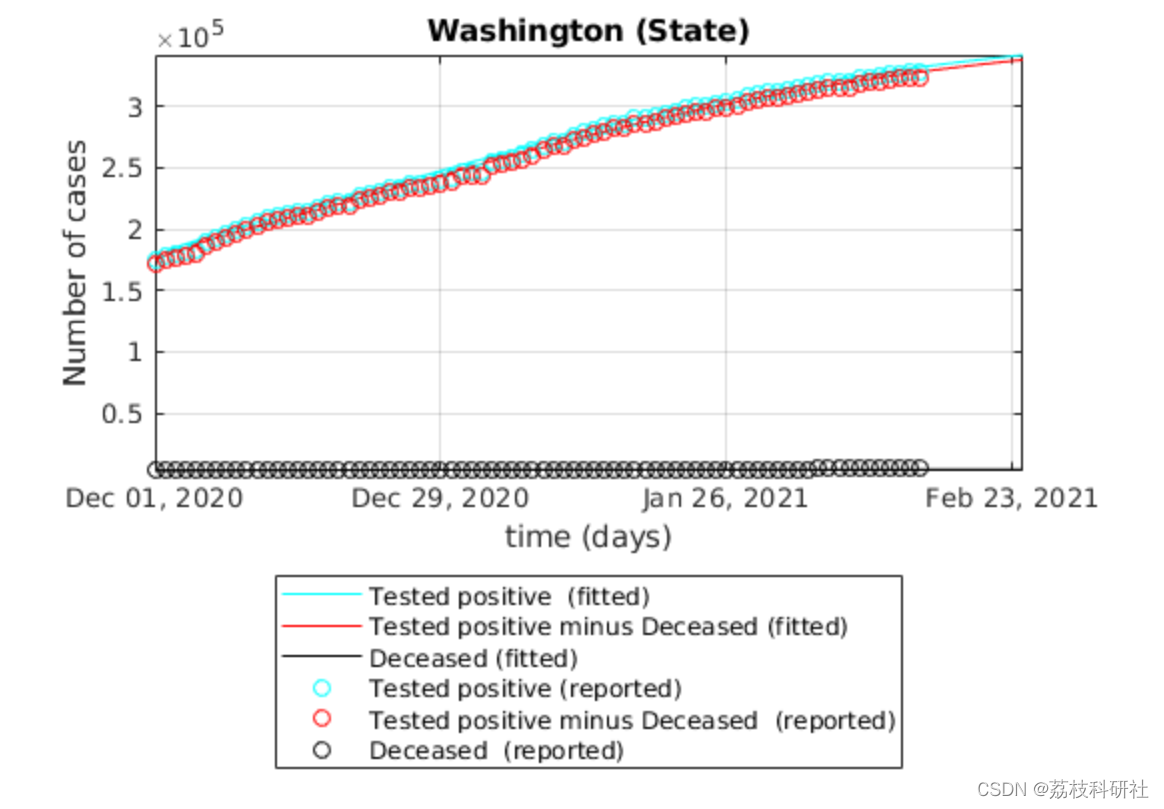
📚2 运行结果
2.1 河北

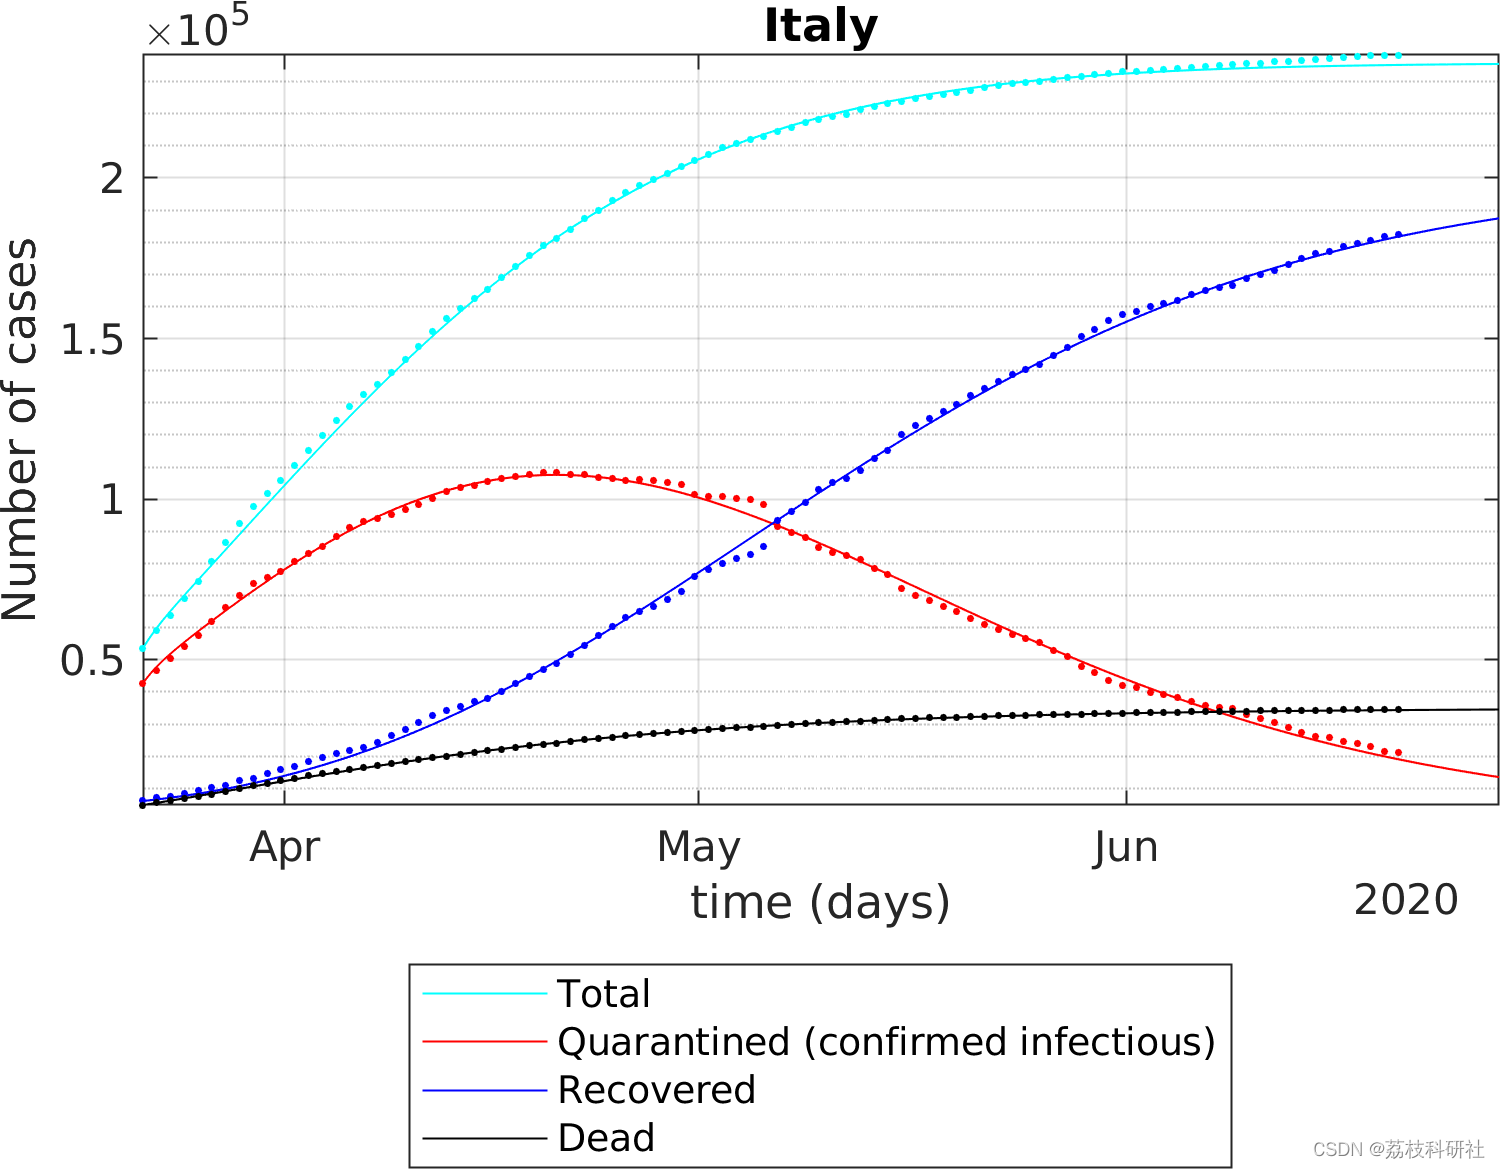
2.2 意大利
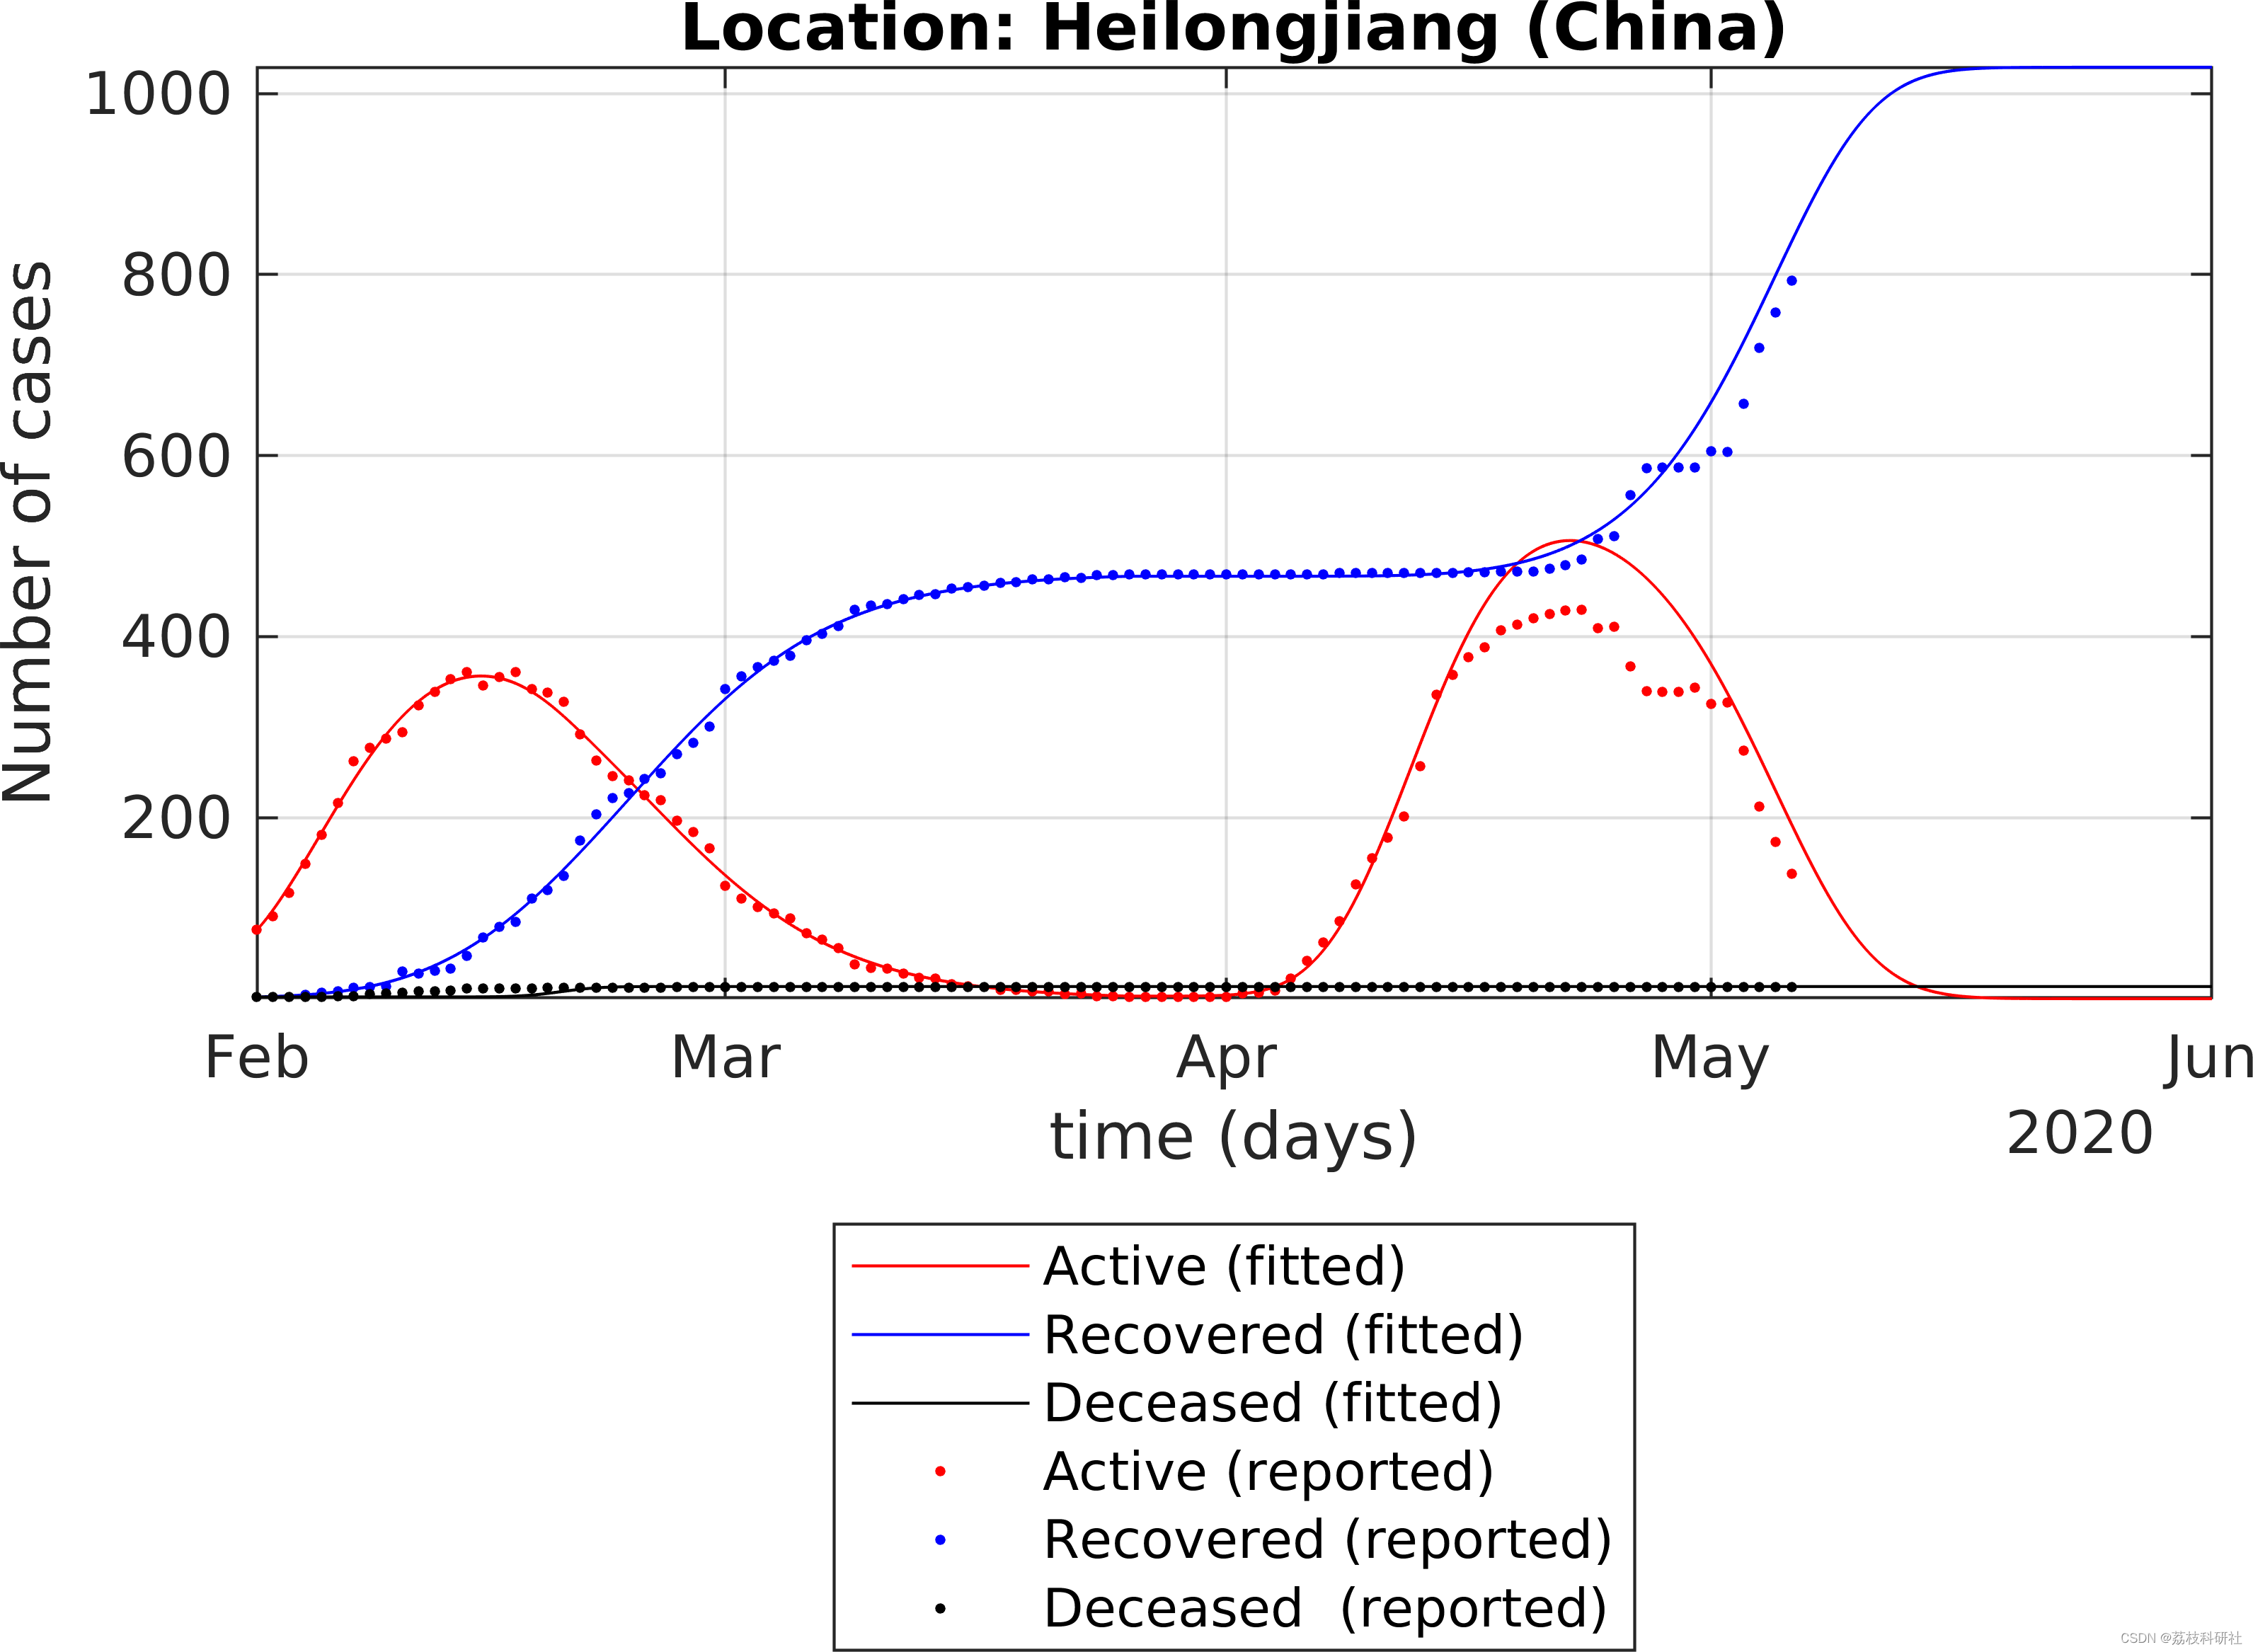
2.3 黑龙江
2.4 社会经济发展不确定因素
2.5 其他

部分代码:
% Setup the Import Options and import the data
% Set the number of columns
opts = delimitedTextImportOptions("NumVariables", 16);
% Specify range and delimiter
opts.DataLines = dataLines;
opts.Delimiter = ",";
% Specify column names and types
% opts.VariableNames = ["HospitalizedWithSymptoms", "HospitalizedInIntensiveCare", "Hospitalized", "HomeConfinement", "confirmed" , "activeCases", "newCases", "Recovered", "Deaths" , "totalCases"]
opts.VariableNames = ["Date" , "CountryCode", "RegionCode", "RegionName", "Lat" , "Long" , "HospitalizedWithSymptoms", "HospitalizedInIntensiveCare", "Hospitalized", "HomeConfinement", "Quarantined", "variationQuarantined", "NewQuarantined","Recovered", "Deaths", "Confirmed" , "Swabs" ];
opts.VariableTypes = ["string", "string" , "uint8" , "string" , "double", "double", "double" , "double" , "double" , "double" , "double" , "double" , "double" , "double" , "double", "double" , "double"];
% Specify file level properties
opts.ExtraColumnsRule = "ignore";
opts.EmptyLineRule = "read";
% Specify variable properties
% Can create an error with older Matlab versions
% opts = setvaropts(opts, "Date", "InputFormat", "yyyy-MM-dd HH:mm:ss"); % Use "Format","yyyy-MM-dd'T'HH:mm:ss" from Mar 23, 2020 on
% Download the CSV file
websave('dummy.csv',fileURL);
% Import the data
fid = fopen('dummy.csv');
tableCOVIDItaly = readtable('dummy.csv', opts);
fclose(fid);
delete('dummy.csv')
end
🎉3 参考文献
部分理论来源于网络,如有侵权请联系删除。
[1] Peng, L., Yang, W., Zhang, D., Zhuge, C., & Hong, L. (2020). Epidemic analysis of COVID-19 in China by dynamical modeling. arXiv preprint arXiv:2002.06563.


 1410
1410

 被折叠的 条评论
为什么被折叠?
被折叠的 条评论
为什么被折叠?
 到【灌水乐园】发言


