


 文章介绍了如何使用Python中的numpy和matplotlib库实现Fourier变换,展示了一段关于正弦信号的频谱分析过程,包括计算频率、绘制频率-幅度图,并演示了如何过滤负频率并找出信号峰值。
f=2, fs=200
import numpy as np
import matplotlib.pyplot as plt
from tqdm import tqdm
_, ax = plt.subplots()
ax.spines['right'].set_visible(False)
ax.spines['top'].set_visible(False)

t0, t1 = 0,1
fs = 200
t = np.arange(t0,t1,1/fs)
f = 2
ft = np.sin(2*np.pi*f*t)

plt.scatter(t,ft,marker='.',s=1,c='b')
plt.savefig('f.jpg')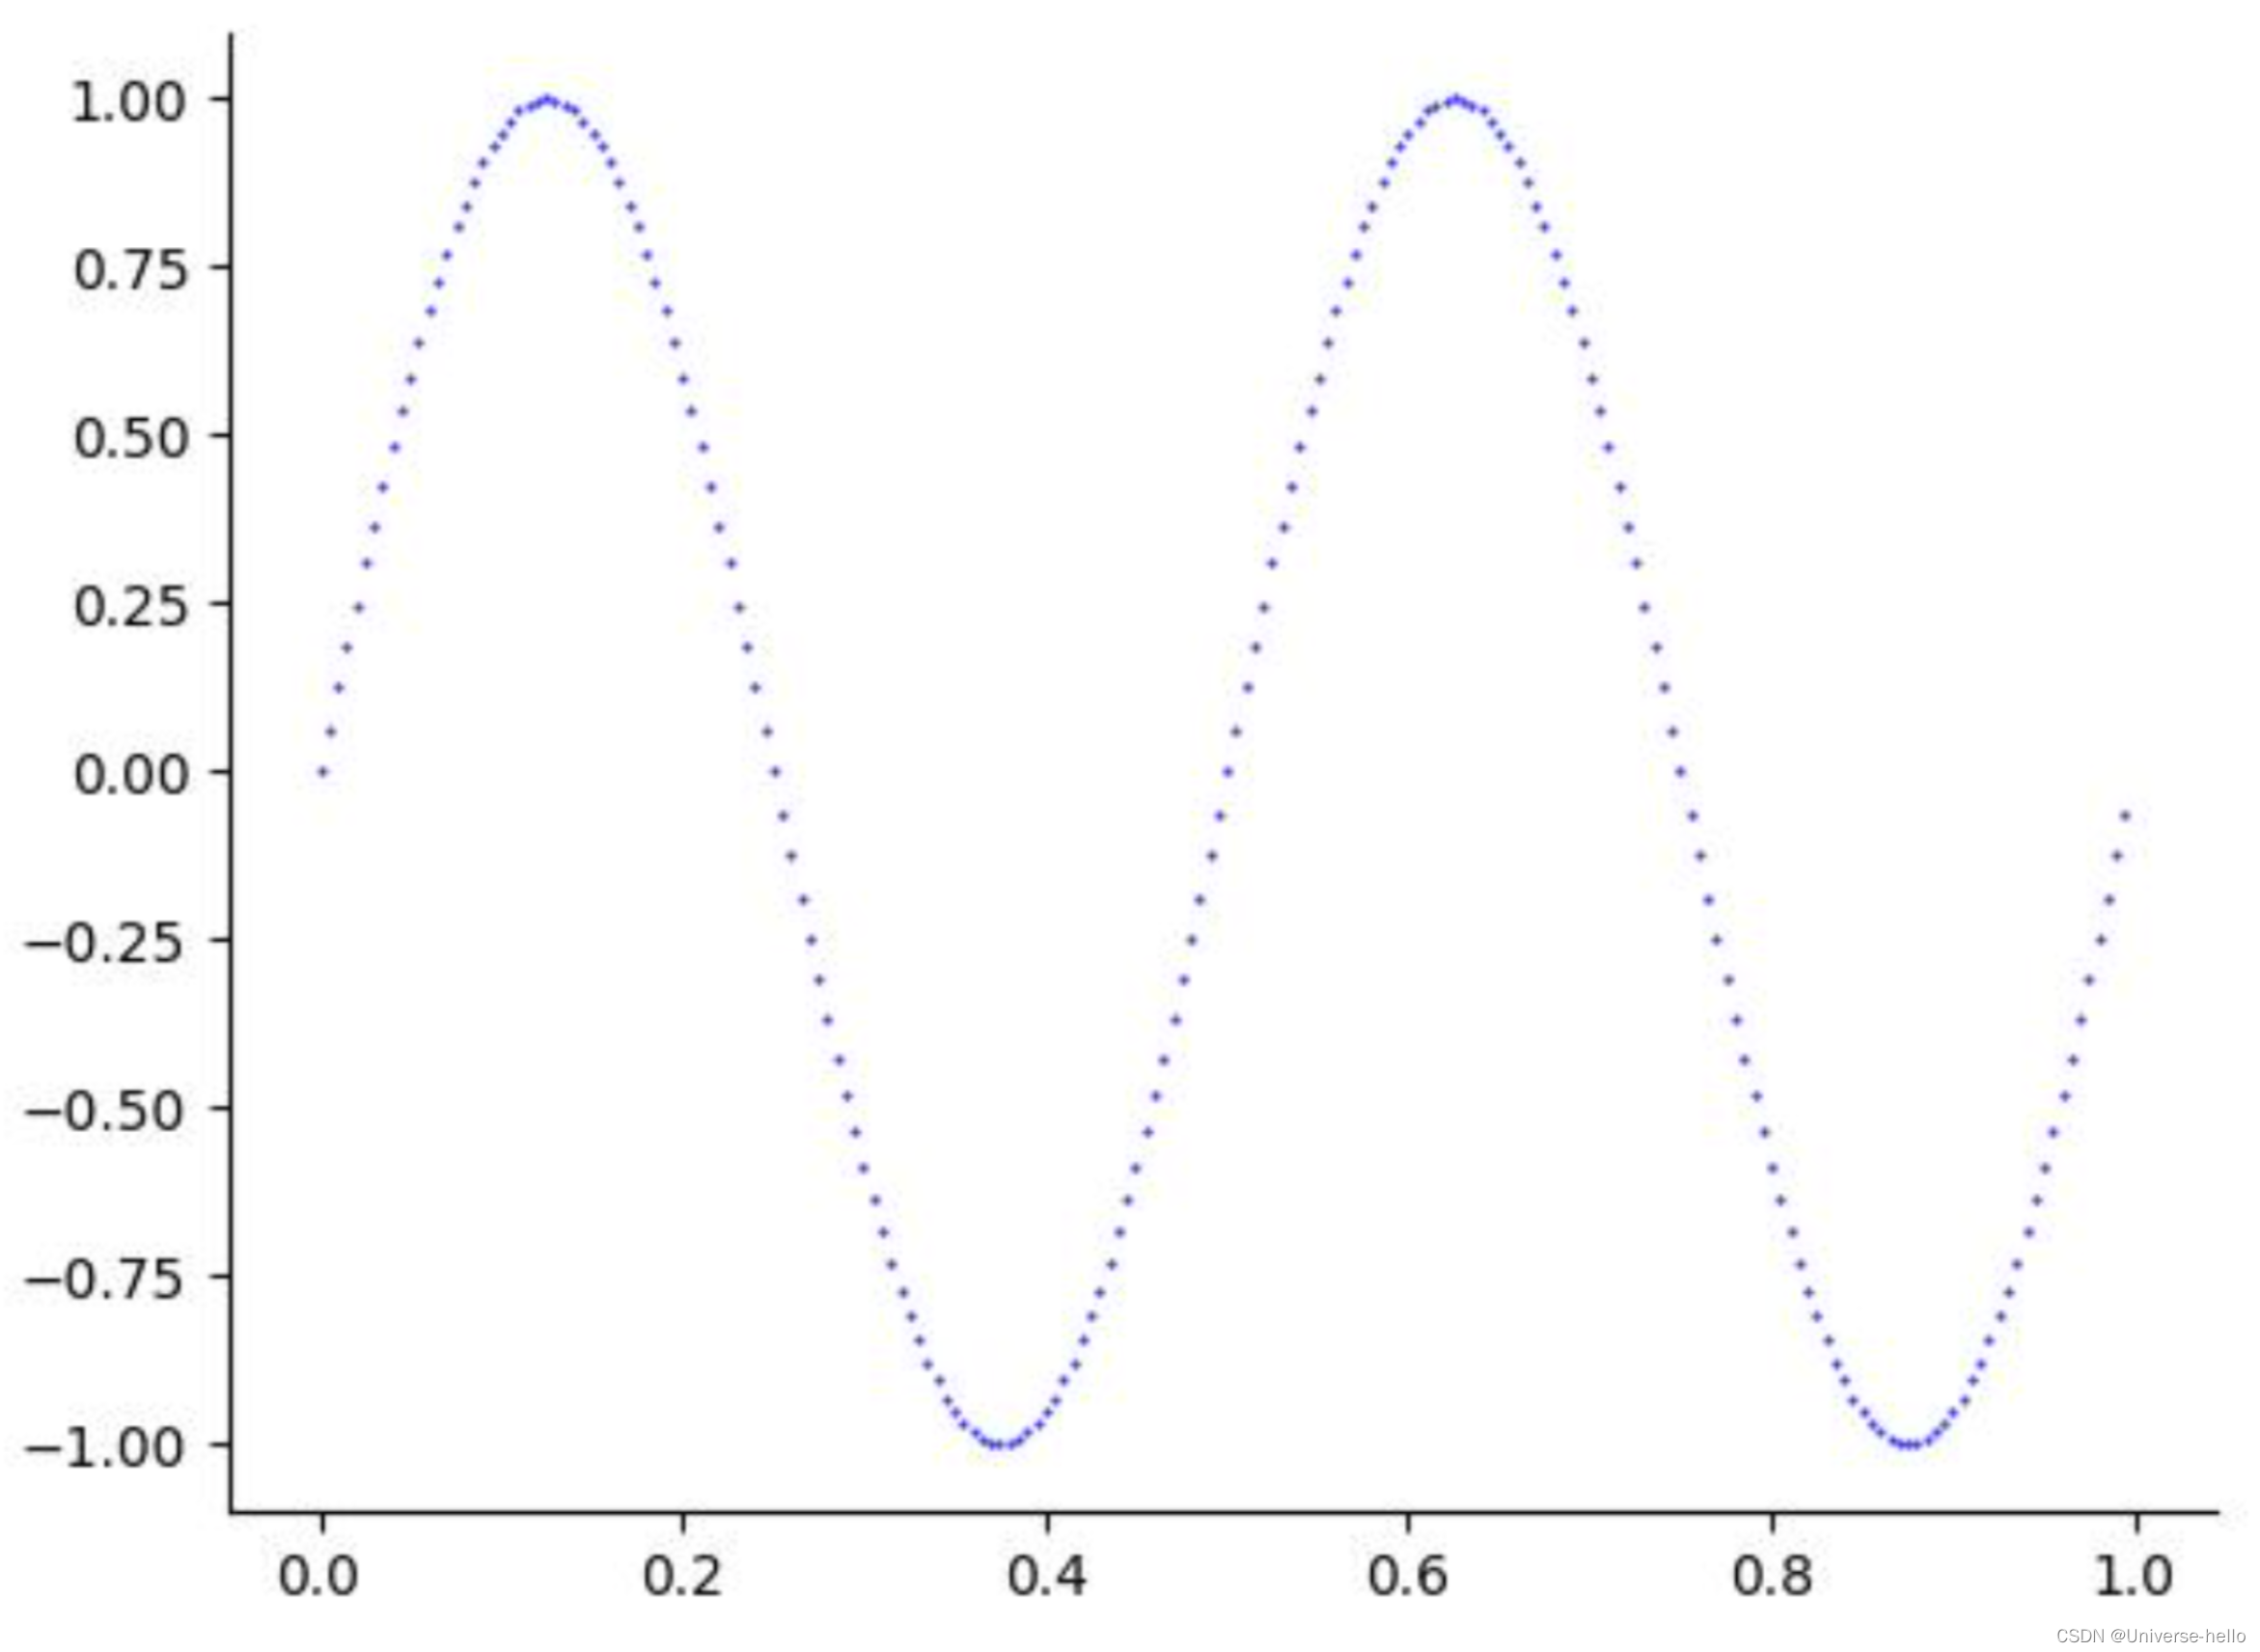
wn计算
>>> import numpy as np
>>> N = 3
>>> np.array(list(range(-N,N+1)))
array([-3, -2, -1,  0,  1,  2,  3])
>>> f = 2
>>> 2*np.pi*f*np.array(list(range(-N,N+1)))
array([-37.69911184, -25.13274123, -12.56637061, 0. ,
12.56637061, 25.13274123, 37.69911184])Fourier逆变换
N=1
import numpy as np
import matplotlib.pyplot as plt
from tqdm import tqdm
_, ax = plt.subplots()
ax.spines['right'].set_visible(False)
ax.spines['top'].set_visible(False)

t0, t1 = 0,1
fs = 200
t = np.arange(t0,t1,1/fs)
f = 2
ft = np.sin(2*np.pi*f*t)
plt.scatter(t,ft,marker='.',s=1,c='b')

N = 1
W_n = 2*np.pi*f*np.array(list(range(-N,N+1)))
F_wn = lambda wn: sum(ft*np.exp(-1j*wn*t)*1/fs)
F_t = lambda ti: sum([F_wn(wn)*np.exp(1j*wn*ti) for wn in W_n])/(t1-t0)
Fourier_t = []
for i in tqdm(t):
    Fourier_t.append(F_t(i))
print('虚部的均值:',np.mean([i.imag for i in Fourier_t]))
Fourier_real = [i.real for i in Fourier_t]
plt.scatter(t,Fourier_real,marker='.',s=1,c='r')

plt.savefig('f.jpg')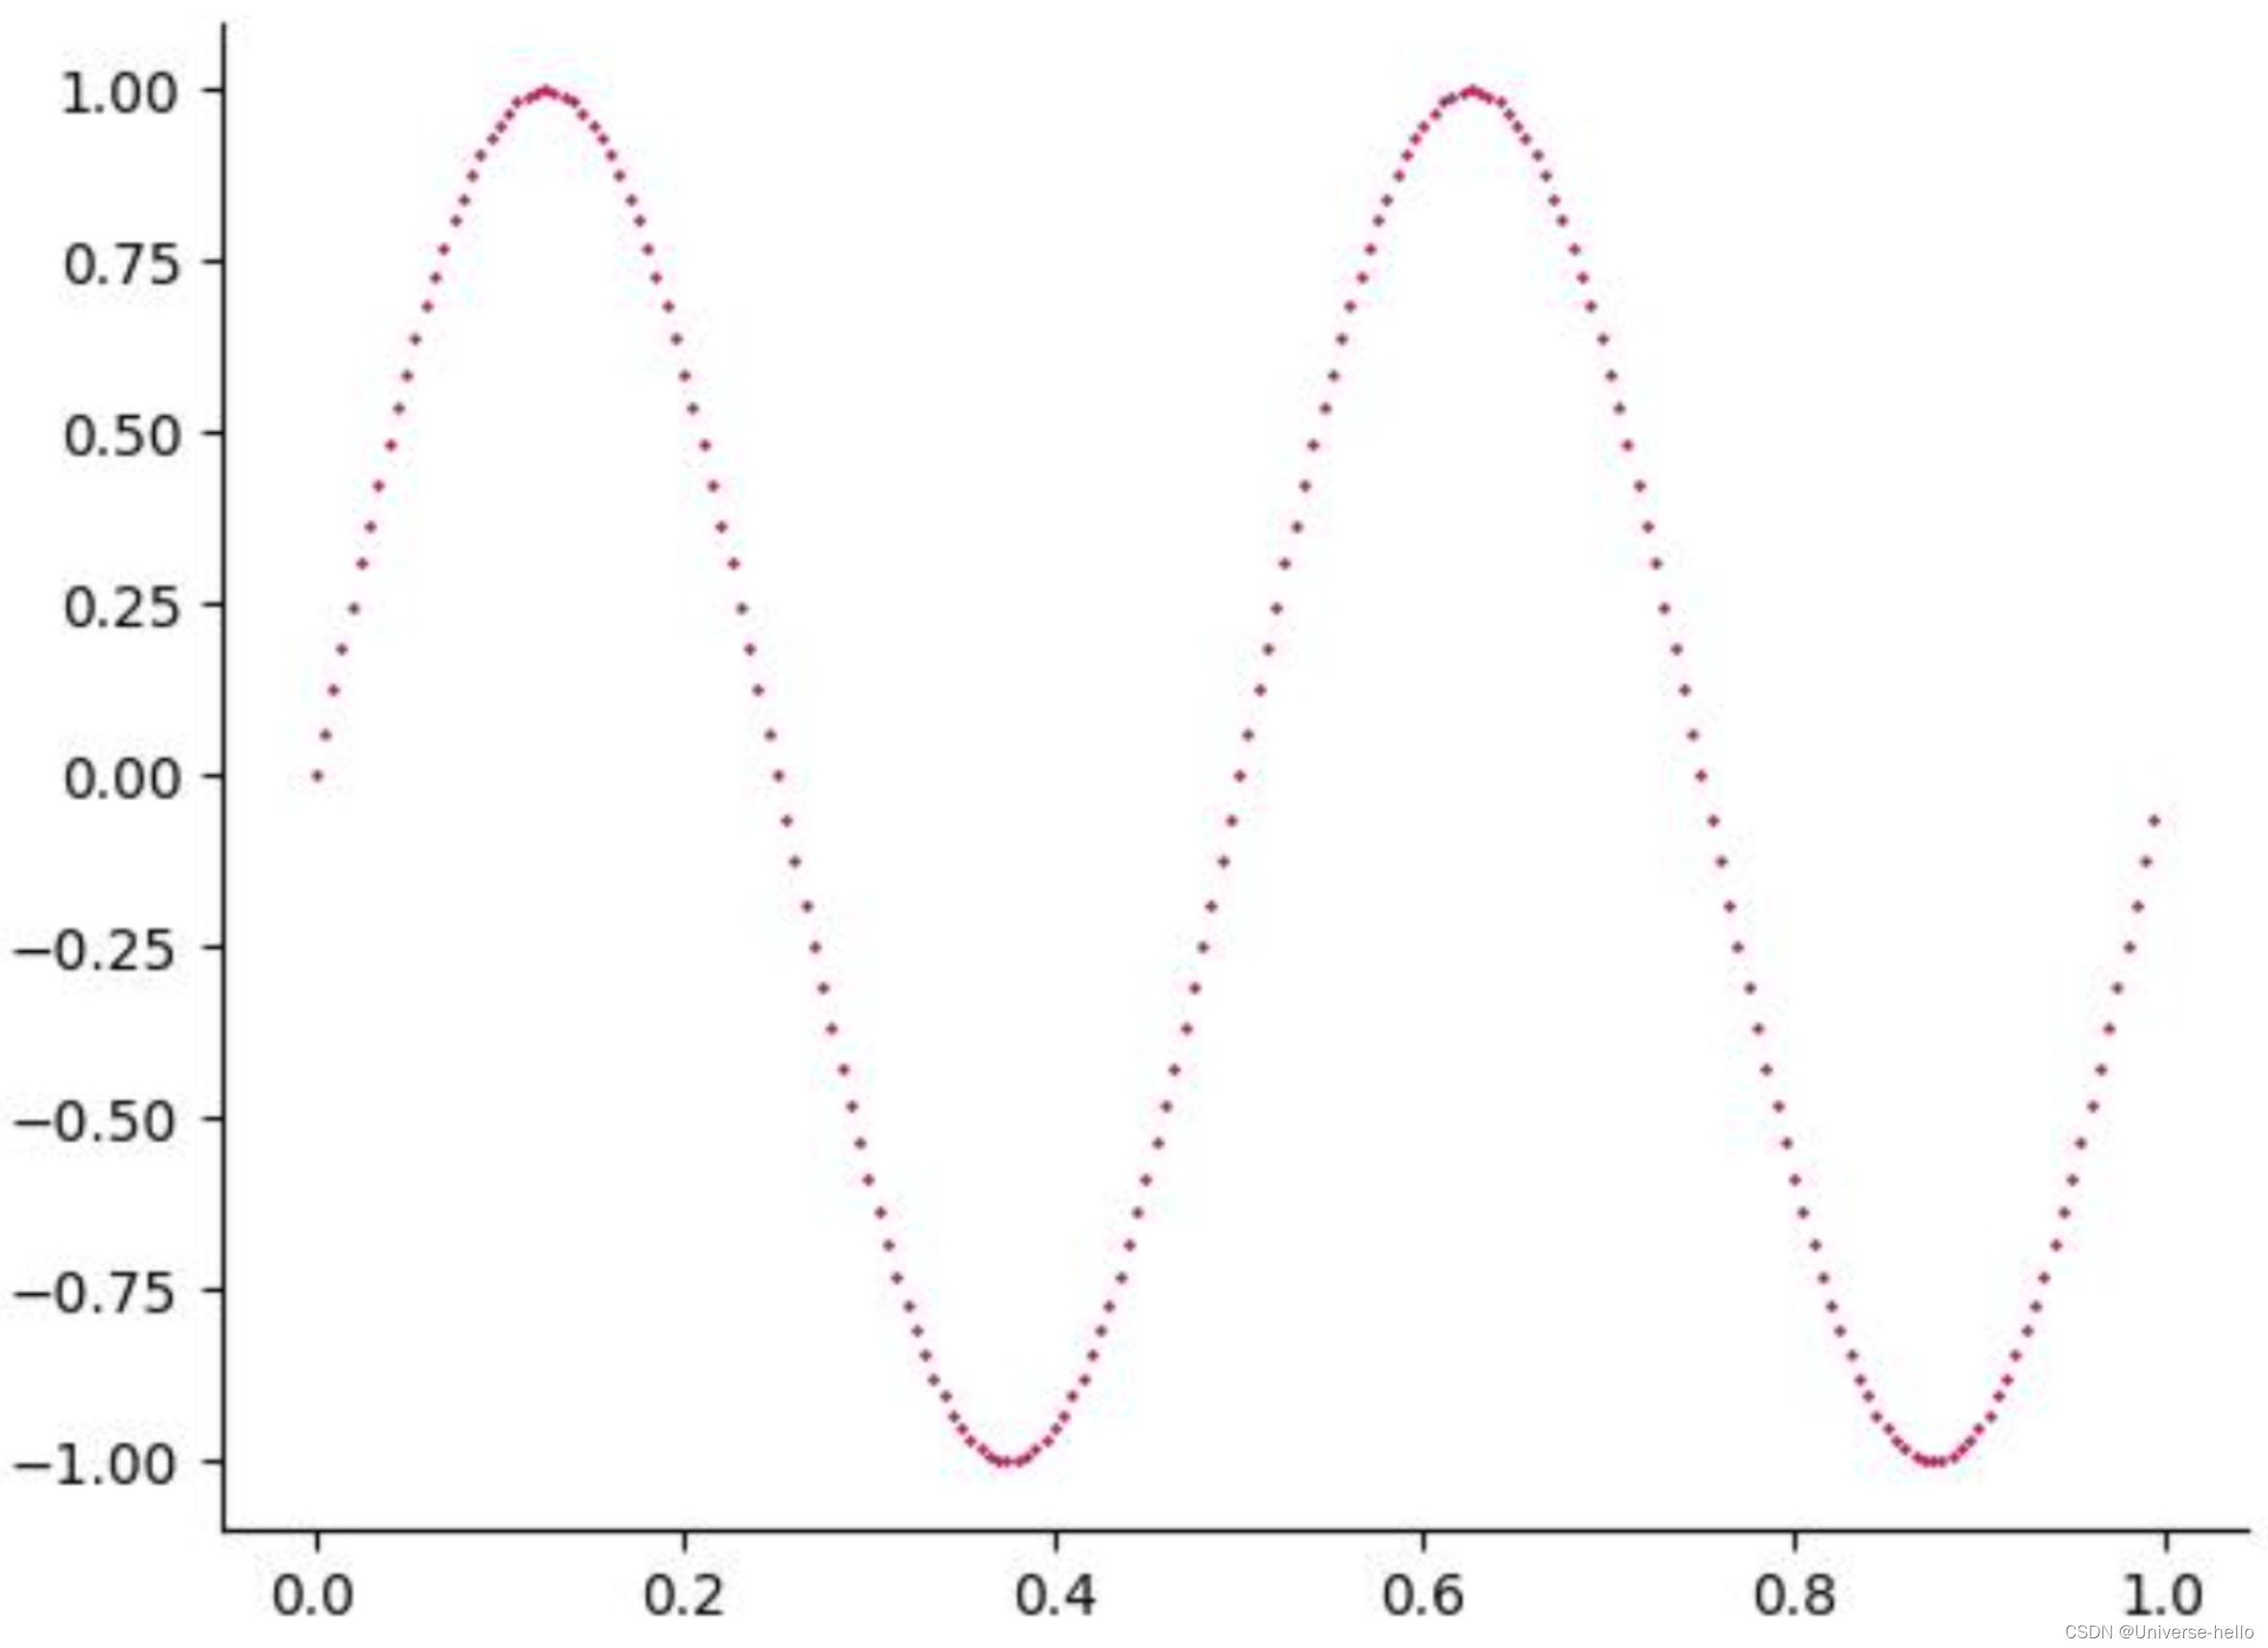
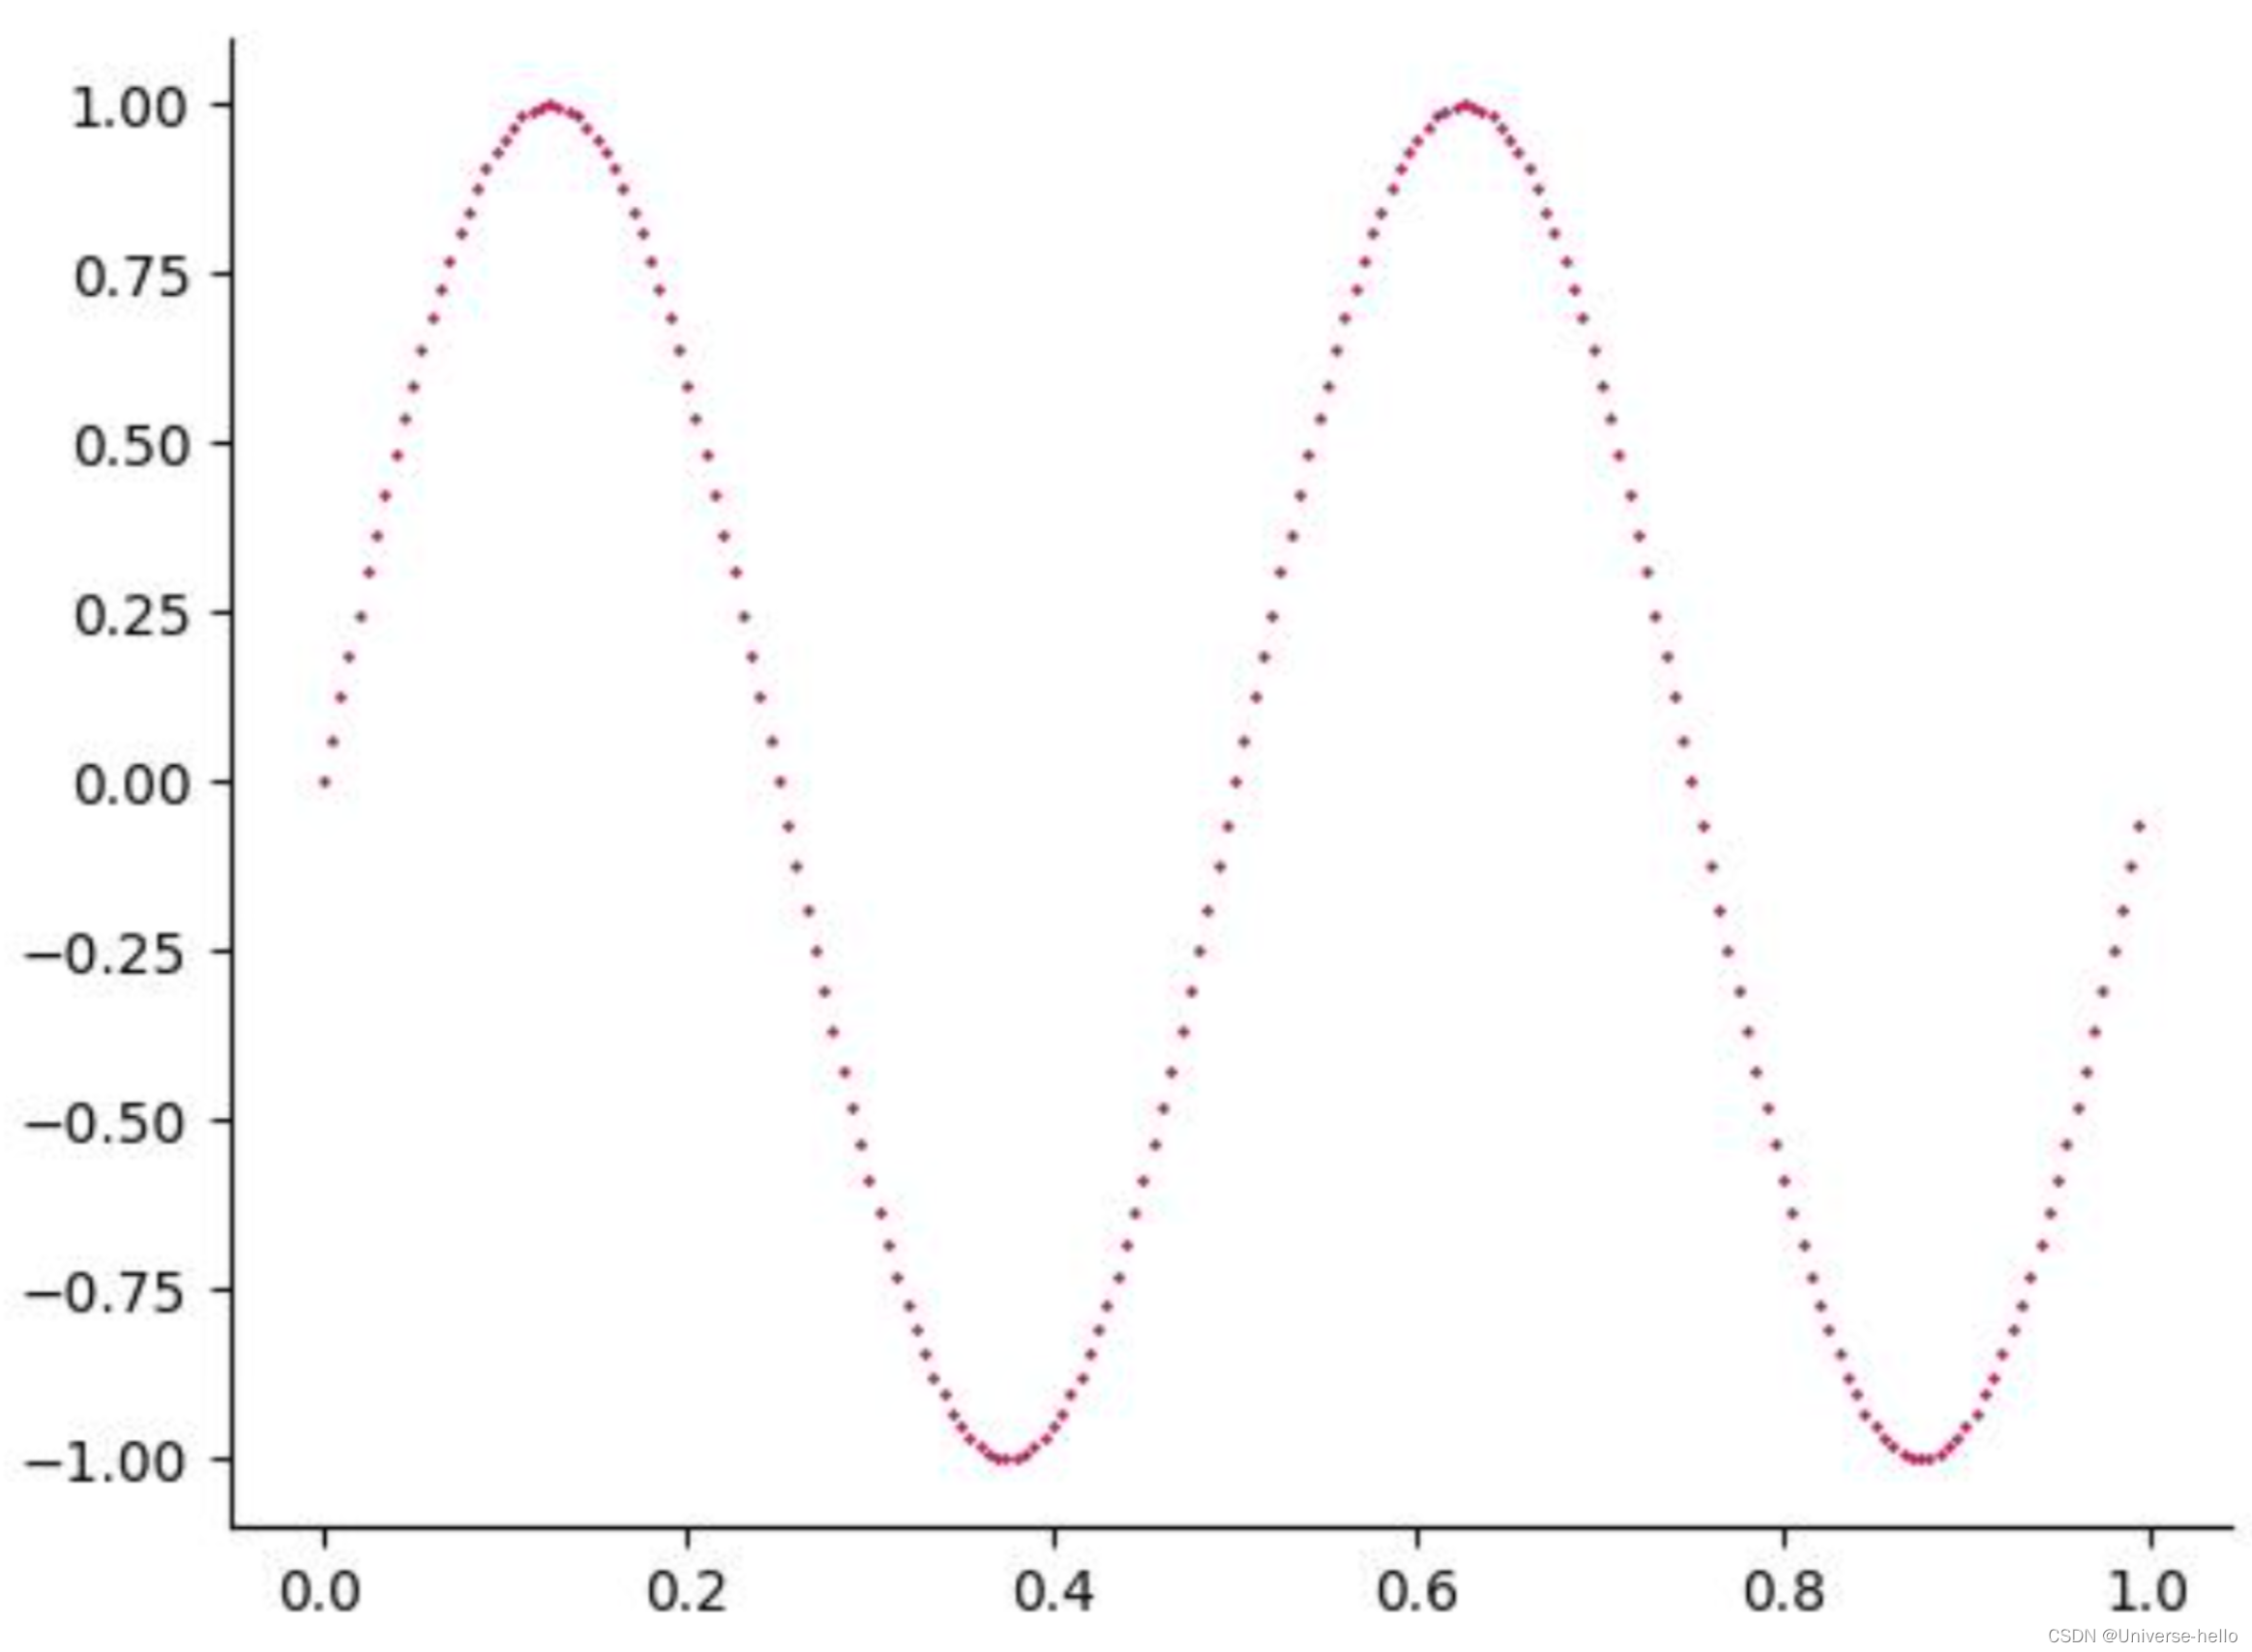
N=2

N=10
Fourier变换
N=1
import numpy as np
import matplotlib.pyplot as plt
from tqdm import tqdm
_, ax = plt.subplots()
ax.spines['right'].set_visible(False)
ax.spines['top'].set_visible(False)

t0, t1 = 0,1
fs = 200
t = np.arange(t0,t1,1/fs)
f = 2
ft = np.sin(2*np.pi*f*t)

N = 1
W_n = 2*np.pi*f*np.array(list(range(-N,N+1)))
F_wn = lambda wn: sum(ft*np.exp(-1j*wn*t)*1/fs)
Fw = [F_wn(wn) for wn in W_n]
print(Fw)
[(-5.800481622797449e-18+0.5000000000000001j), (9.952975943416931e-17+0j), (-5.800481622797449e-18-0.5000000000000001j)]是复数,用复数模长代替
Fw = [abs(F_wn(wn)) for wn in W_n]
print(Fw)
[0.5000000000000001, 9.952975943416931e-17, 0.5000000000000001](wn,fw)画图
import numpy as np
import matplotlib.pyplot as plt
from tqdm import tqdm
_, ax = plt.subplots()
ax.spines['right'].set_visible(False)
ax.spines['top'].set_visible(False)

t0, t1 = 0,1
fs = 200
t = np.arange(t0,t1,1/fs)
f = 2
ft = np.sin(2*np.pi*f*t)

N = 1
W_n = 2*np.pi*f*np.array(list(range(-N,N+1)))
F_wn = lambda wn: sum(ft*np.exp(-1j*wn*t)*1/fs)
Fw = [abs(F_wn(wn)) for wn in W_n]

plt.scatter(W_n,Fw,marker='*',s=30,c='r')
plt.savefig('f.jpg')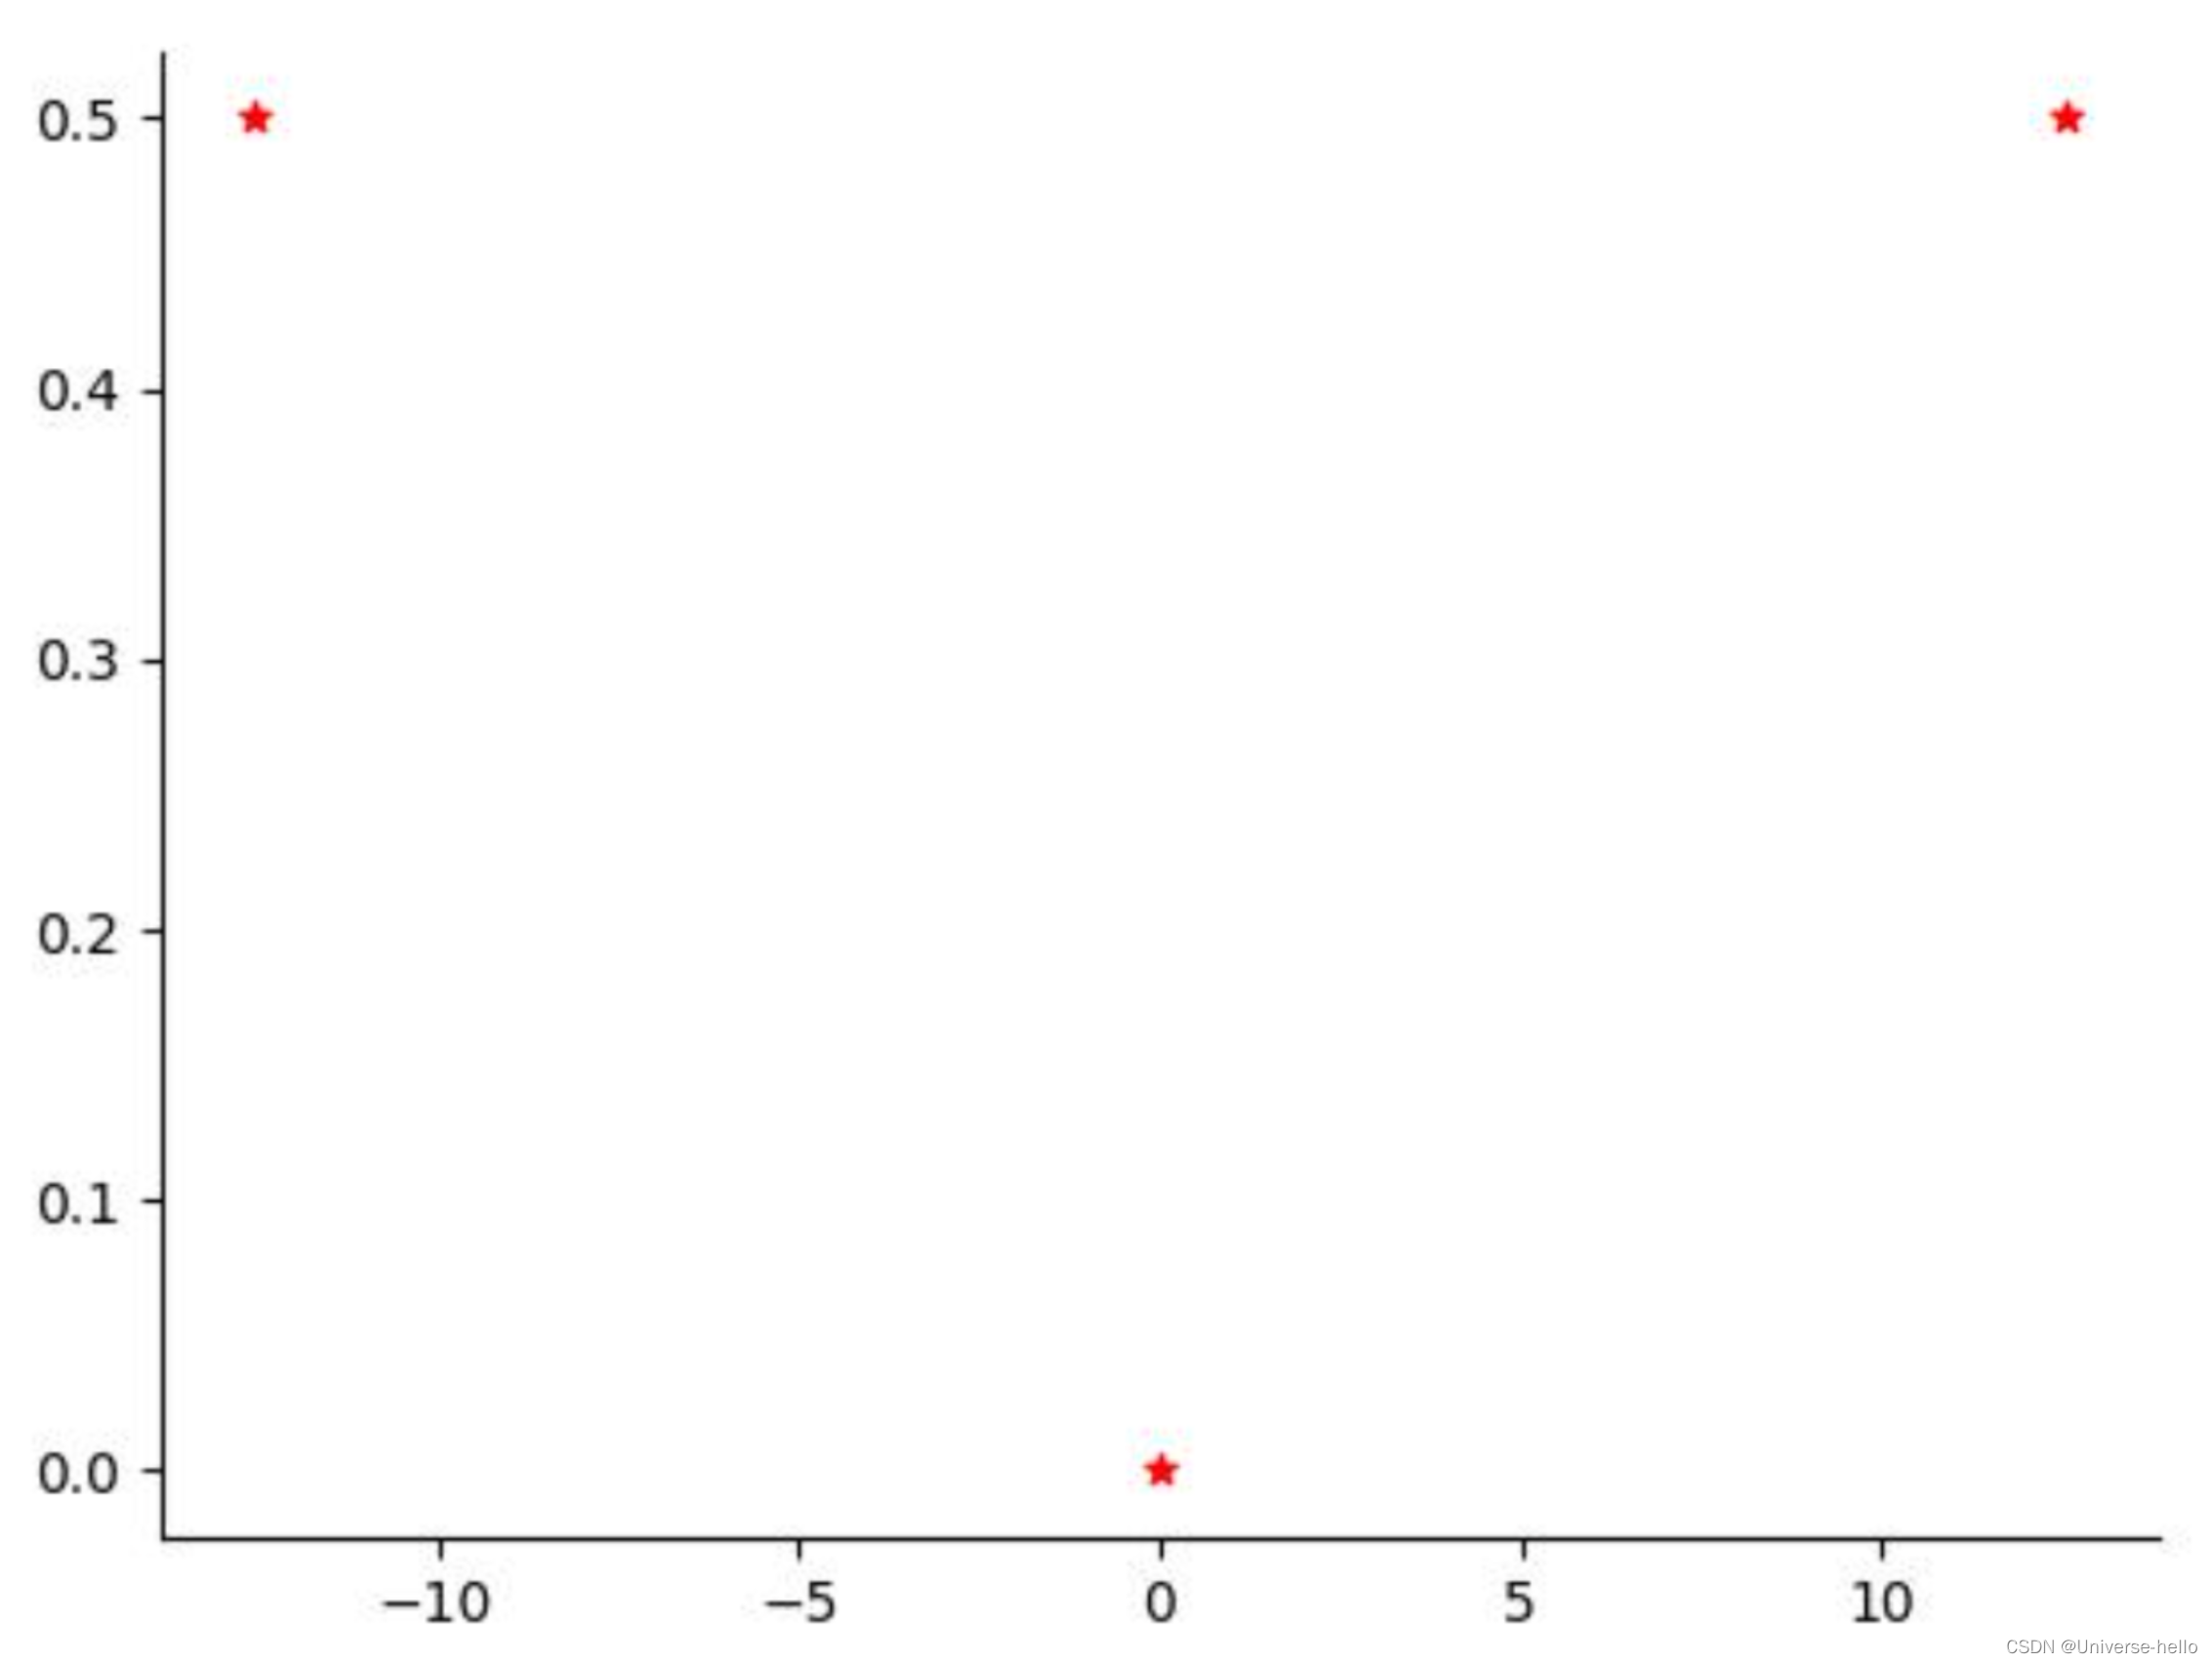
(频率,fw)画图
import numpy as np
import matplotlib.pyplot as plt
from tqdm import tqdm
_, ax = plt.subplots()
ax.spines['right'].set_visible(False)
ax.spines['top'].set_visible(False)

t0, t1 = 0,1
fs = 200
t = np.arange(t0,t1,1/fs)
f = 2
ft = np.sin(2*np.pi*f*t)

N = 1
W_n = 2*np.pi*f*np.array(list(range(-N,N+1)))
F_wn = lambda wn: sum(ft*np.exp(-1j*wn*t)*1/fs)
Fw = [abs(F_wn(wn)) for wn in W_n]

freq_n = [wn/(2*np.pi) for wn in W_n]
plt.scatter(freq_n,Fw,marker='*',s=30,c='r')
plt.savefig('f.jpg')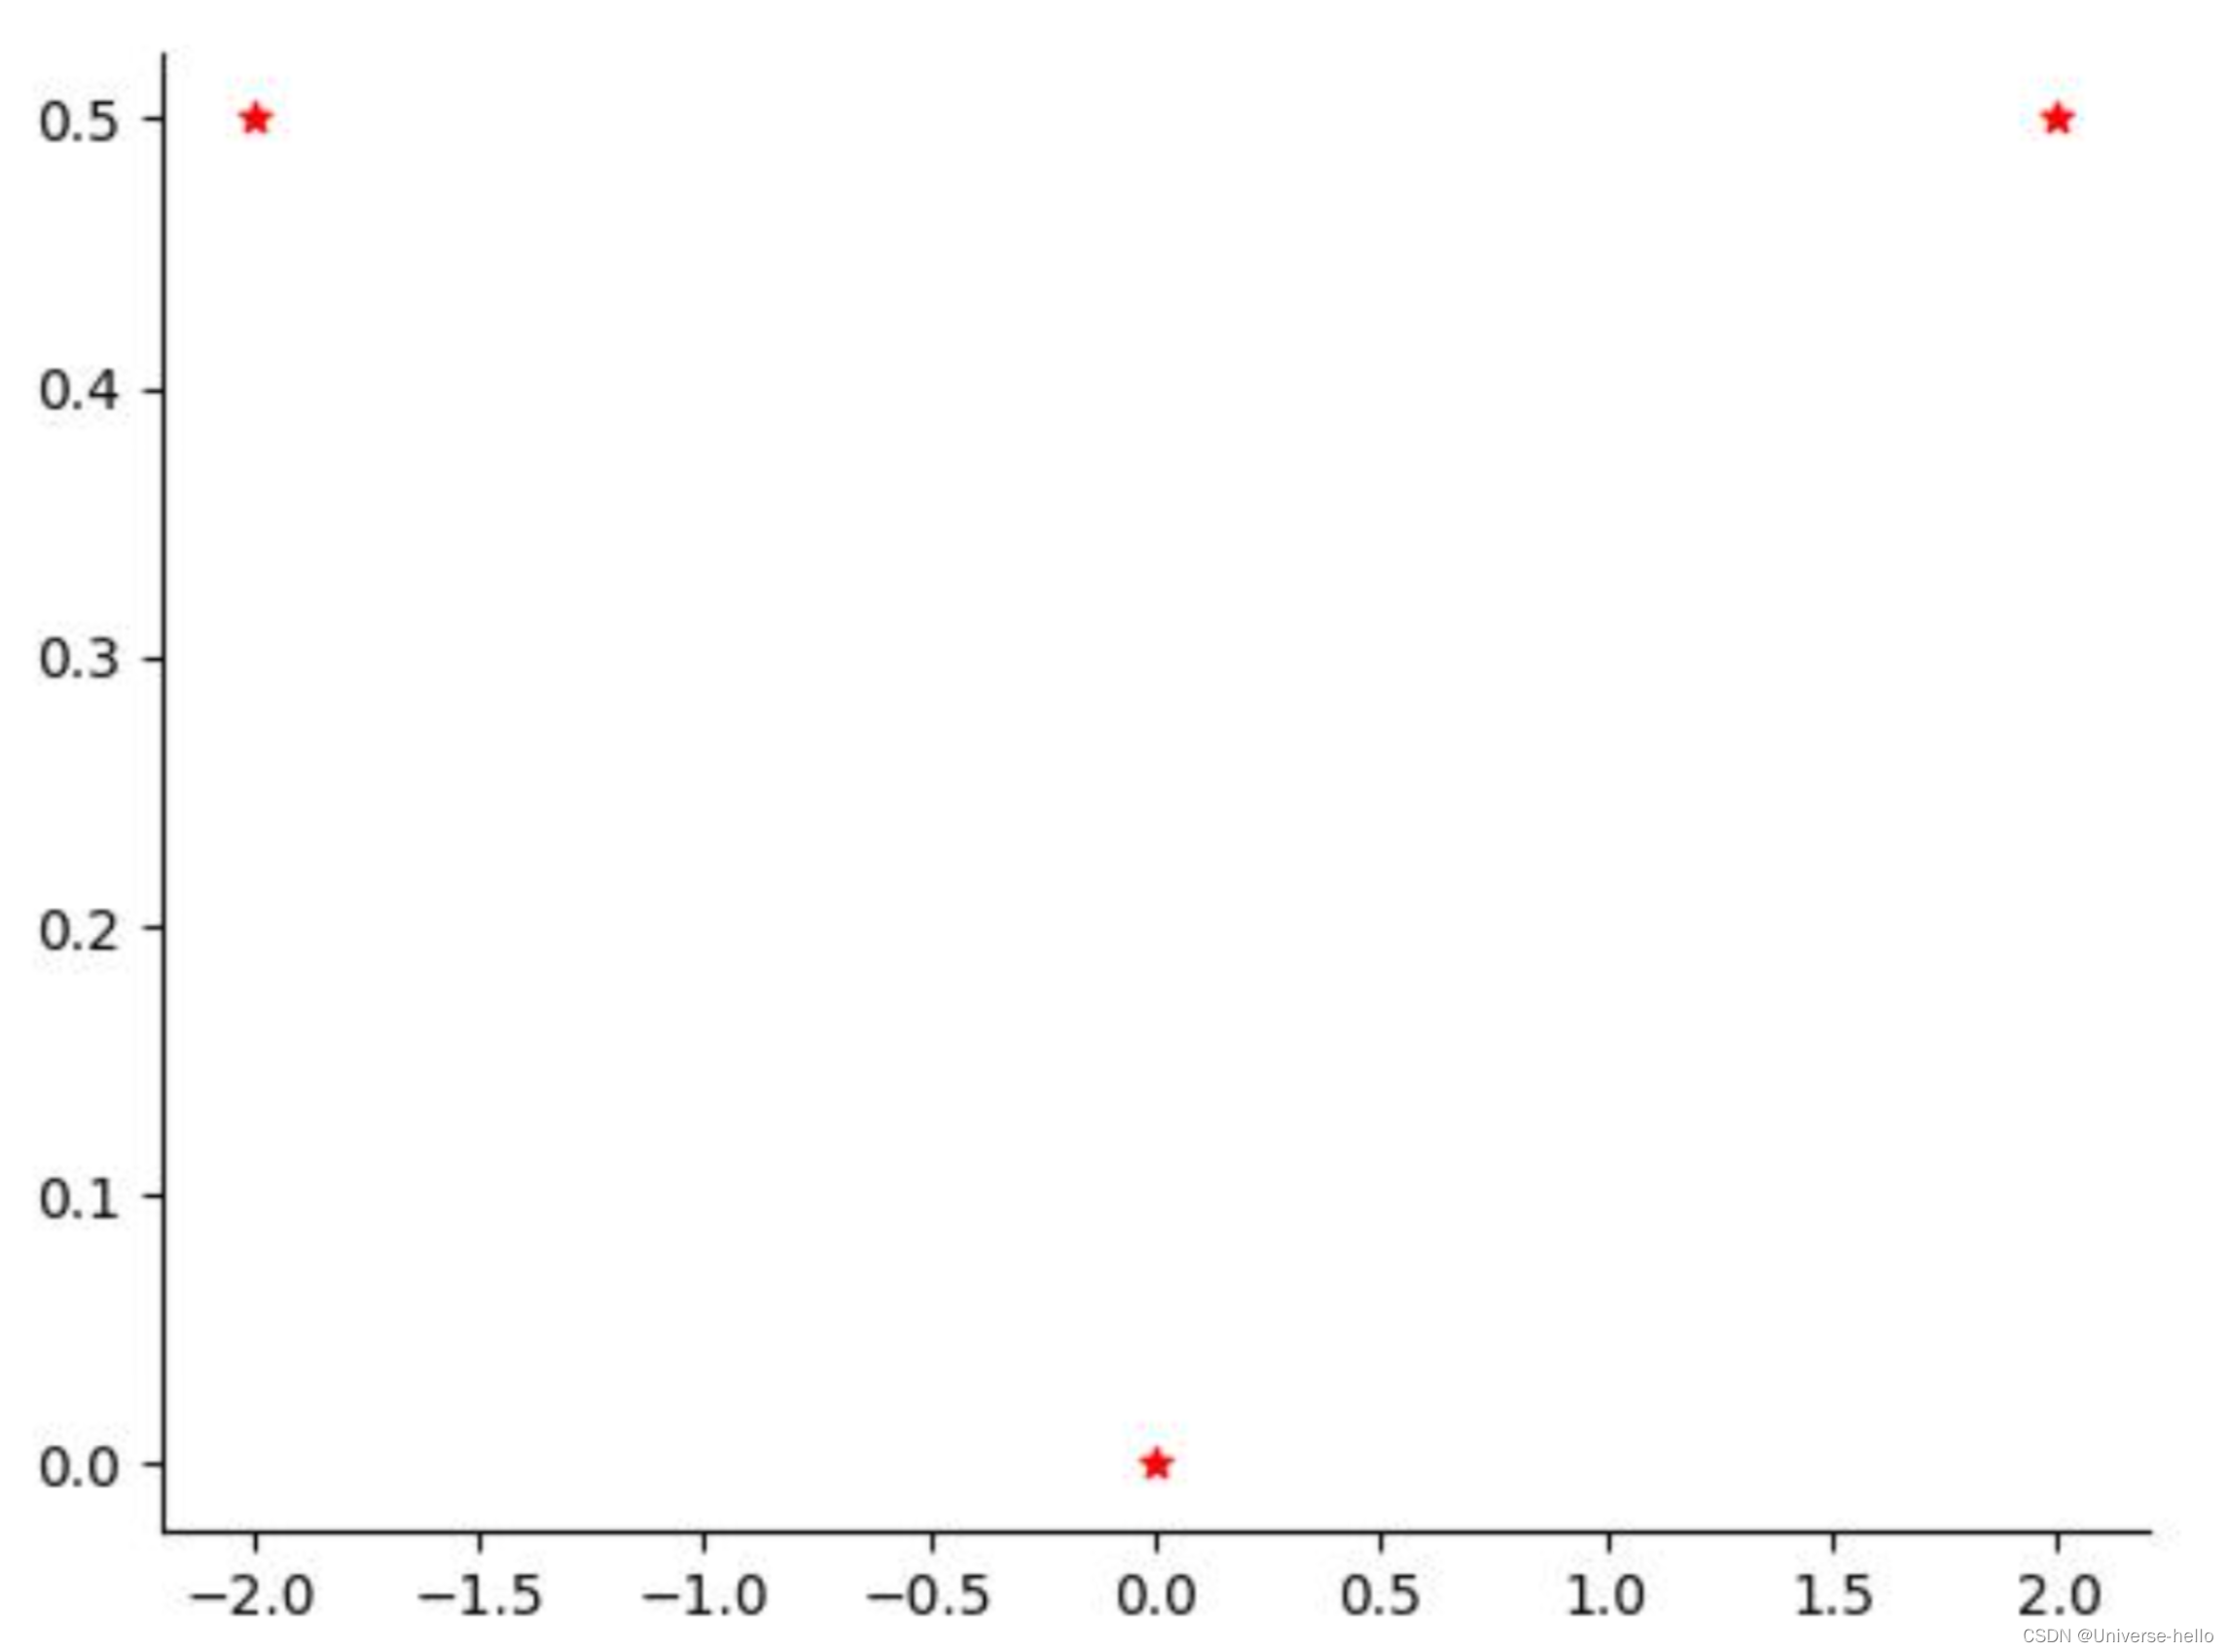
n可以取负数,是因为Fourier级数-复数形式,有如下关系
为了公式的简洁性,把n从1到inf推到了-inf~inf
在本文章中,我们想从实际意义的角度看信号跟频率的关系,
可以只看Fourier变换后: w或f为正的那一半,但是Fourier变换公式计算的过程中正负频率都要算
过滤n<0
import numpy as np
import matplotlib.pyplot as plt
from tqdm import tqdm
_, ax = plt.subplots()
ax.spines['right'].set_visible(False)
ax.spines['top'].set_visible(False)

t0, t1 = 0,1
fs = 200
t = np.arange(t0,t1,1/fs)
f = 2
ft = np.sin(2*np.pi*f*t)

N = 1
W_n = 2*np.pi*f*np.array(list(range(-N,N+1)))
F_wn = lambda wn: sum(ft*np.exp(-1j*wn*t)*1/fs)
Fw = [abs(F_wn(wn)) for wn in W_n[W_n>=0]]

freq_n = [wn/(2*np.pi) for wn in W_n[W_n>=0]]
plt.scatter(freq_n,Fw,marker='*',s=30,c='r')
index = np.argmax(Fw)
plt.text(freq_n[index]+0.1,Fw[index],f'freq={freq_n[index]}')
plt.savefig('f.jpg')
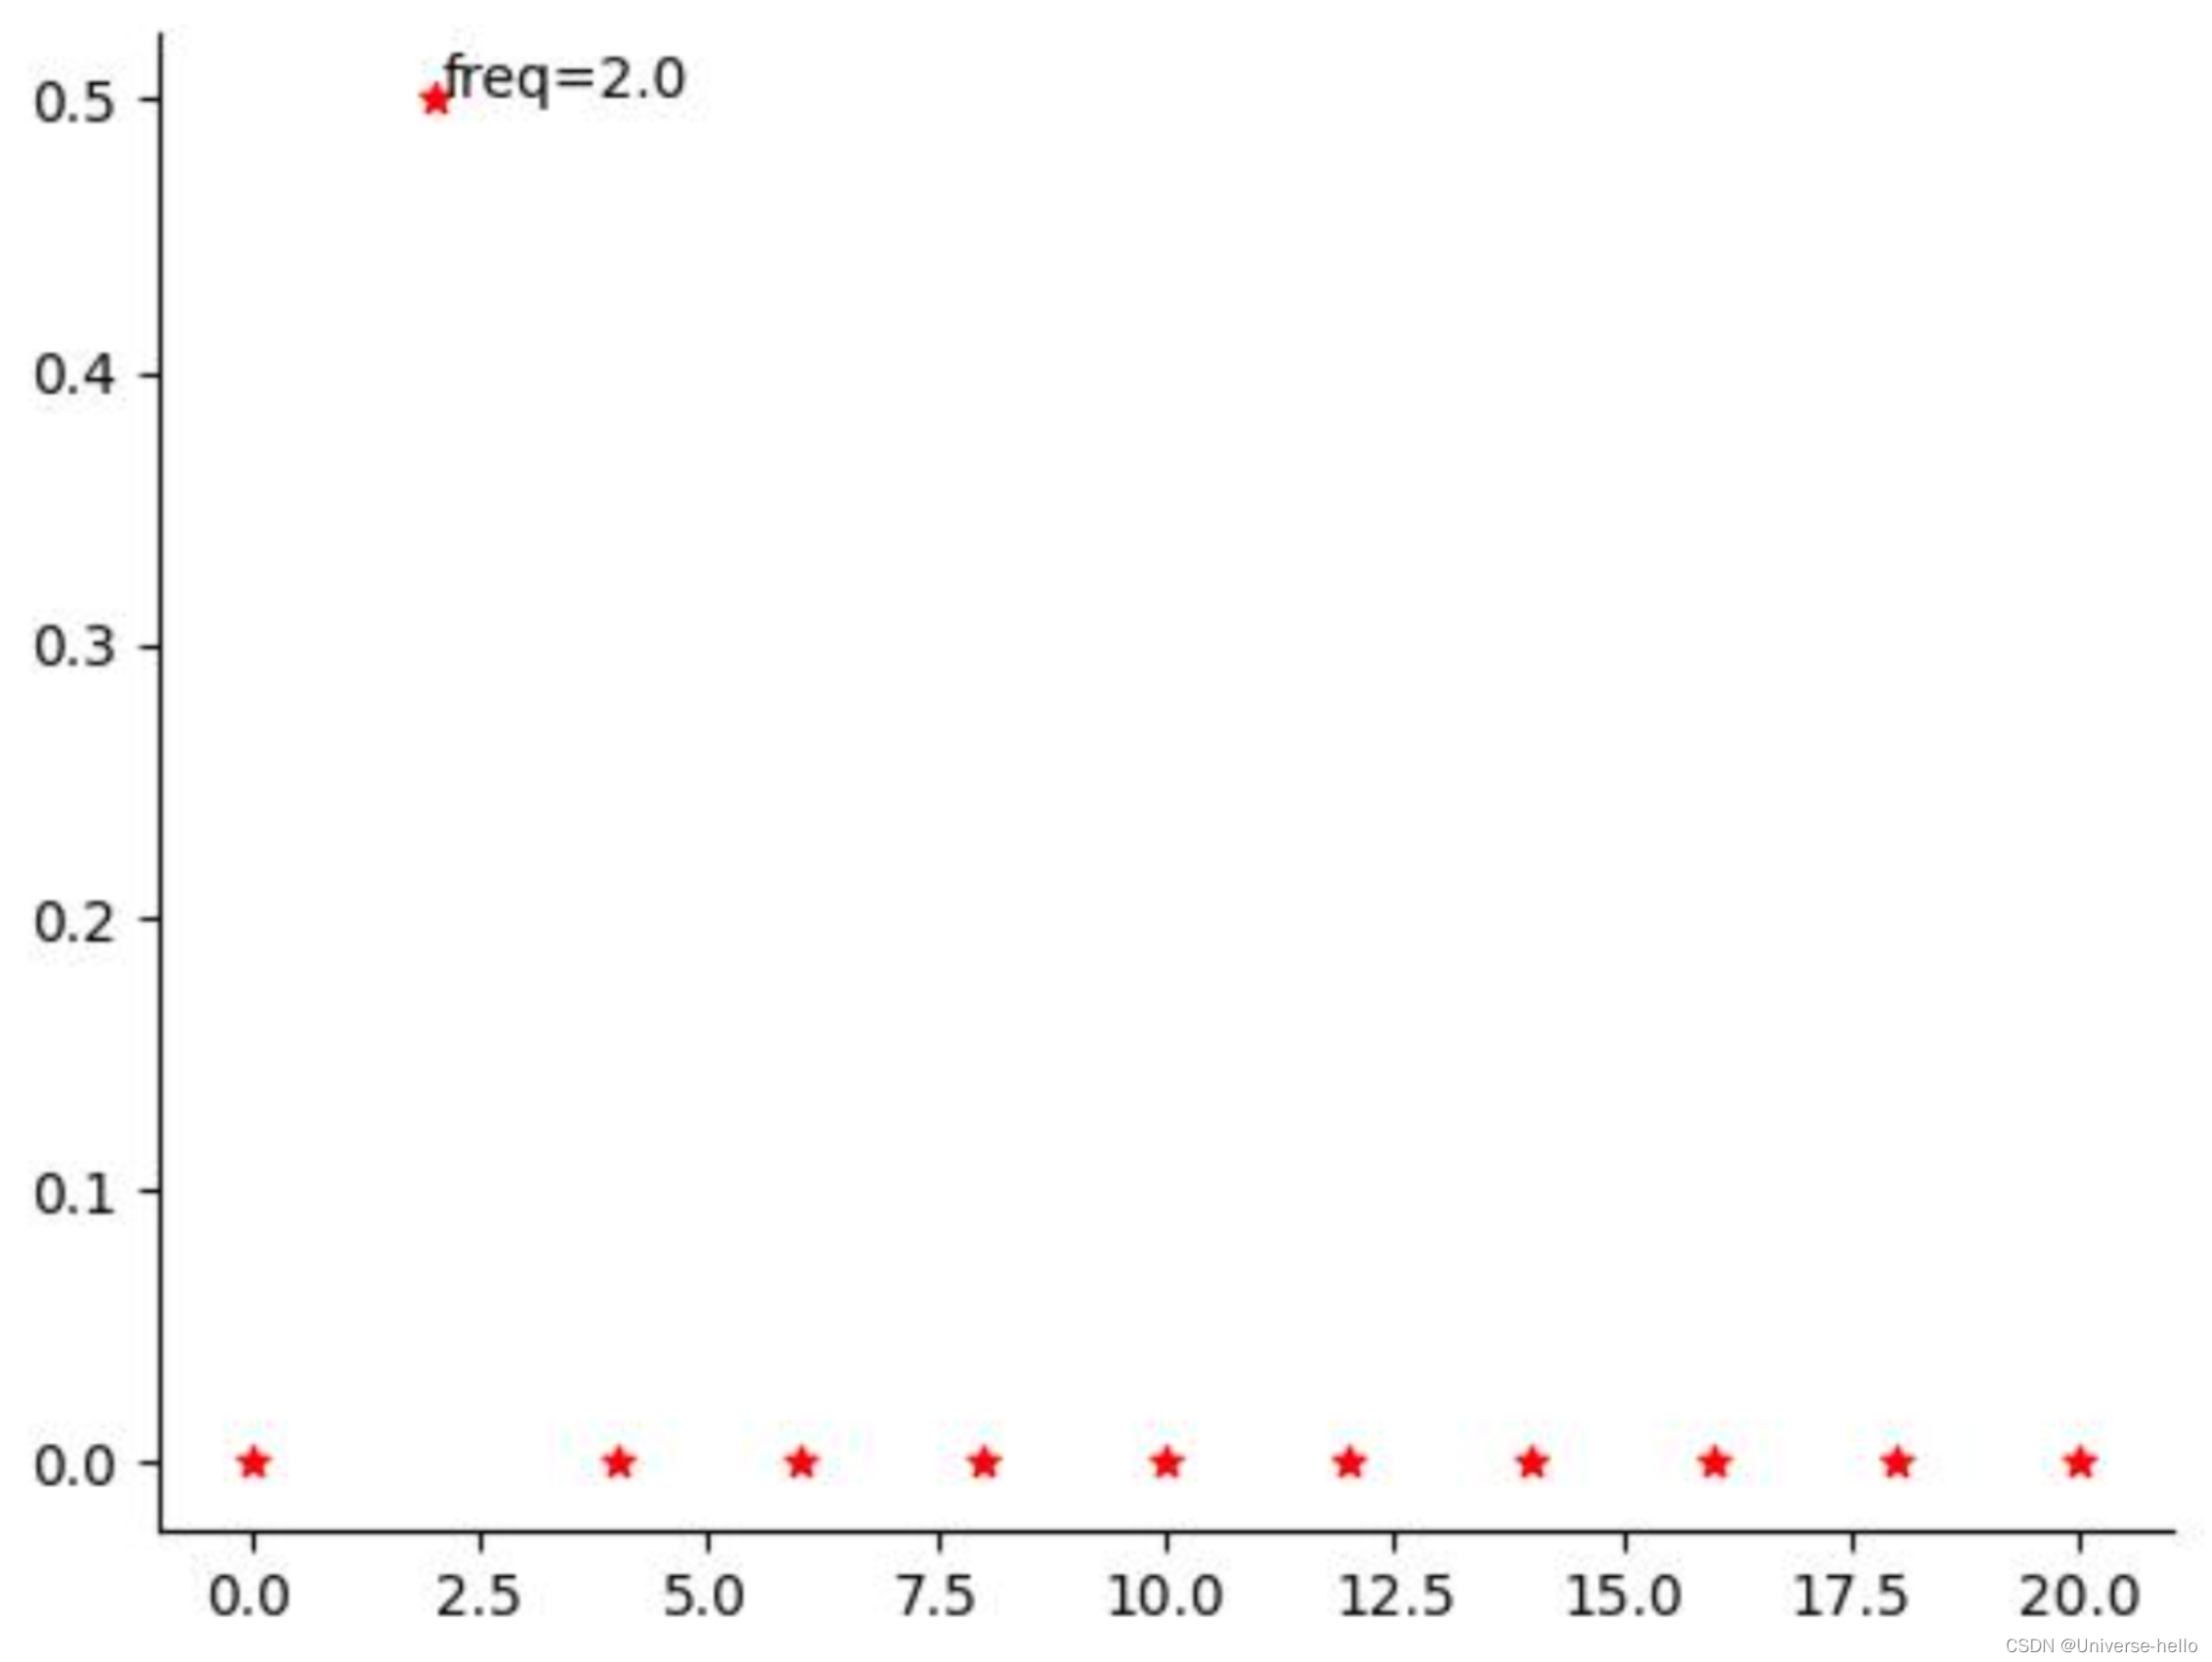
N=2
import numpy as np
import matplotlib.pyplot as plt
from tqdm import tqdm
_, ax = plt.subplots()
ax.spines['right'].set_visible(False)
ax.spines['top'].set_visible(False)

t0, t1 = 0,1
fs = 200
t = np.arange(t0,t1,1/fs)
f = 2
ft = np.sin(2*np.pi*f*t)

N = 2
W_n = 2*np.pi*f*np.array(list(range(-N,N+1)))
F_wn = lambda wn: sum(ft*np.exp(-1j*wn*t)*1/fs)
Fw = [abs(F_wn(wn)) for wn in W_n[W_n>=0]]

freq_n = [wn/(2*np.pi) for wn in W_n[W_n>=0]]
plt.scatter(freq_n,Fw,marker='*',s=30,c='r')
index = np.argmax(Fw)
plt.text(freq_n[index]+0.1,Fw[index],f'freq={freq_n[index]}')
plt.savefig('f.jpg')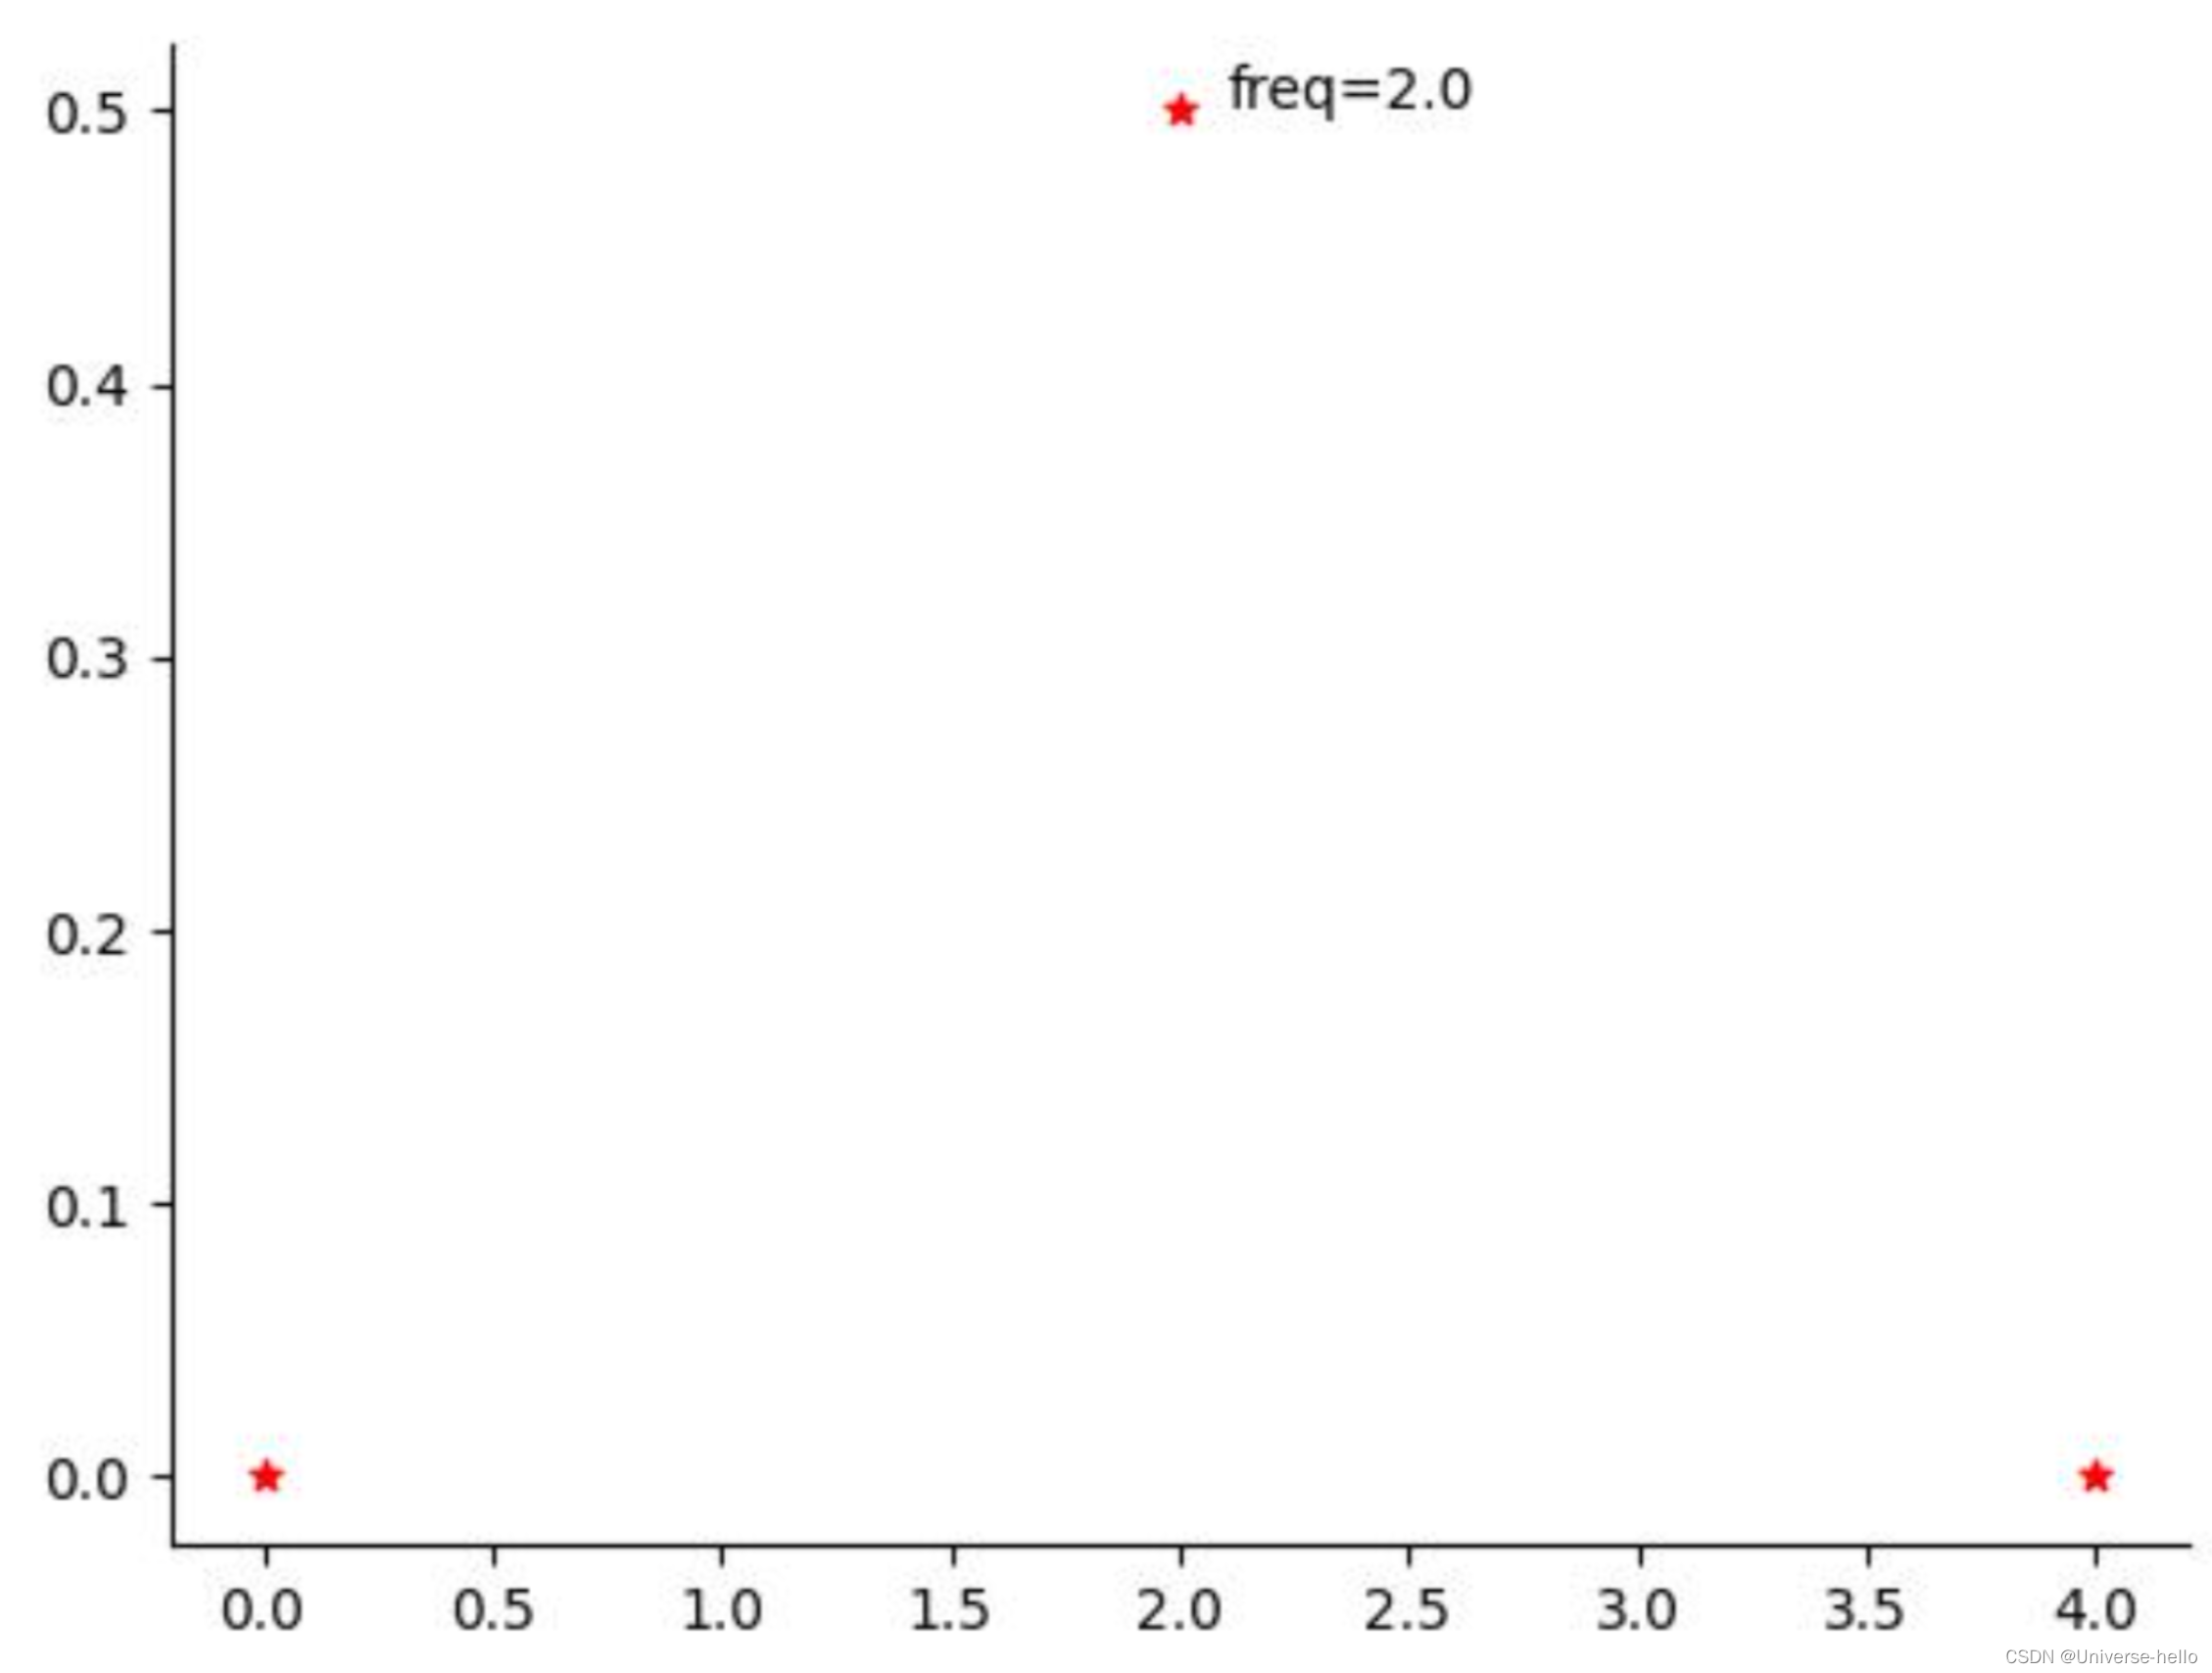
N=10


 5329
5329

 被折叠的 条评论
为什么被折叠?
被折叠的 条评论
为什么被折叠?
 到【灌水乐园】发言


