


Matplotlib常用技巧之简易线型图
导入模块 import matplotlib as mlt import matplotlib.pyplot as plt
1、简单画图
1.1 在脚本中画图
- plt.plot(x, y, style=’–’)
- plt.show()
1.2 在IPython shell中画图
-
开头使用魔法命令
matplotlibUsing matplotlib backend: TkAggplt.draw()可以强制更新
1.3 在IPython Notebook中画图(Jupyter Notebook)
- 魔法命令:
%matplotlib notebookor%matplotlib inline
1.4 .1 如何保存
fig = plt.figure()<class 'matplotlib.figure.Figure'>fig.savefig('my_fgure.png')保存时不需要用.show()
1.4.2 end渲染png基本图像
fig.canvas.get_supported_filetypes() 以下是系统支持的具体格式
{'eps': 'Encapsulated Postscript',
 'jpg': 'Joint Photographic Experts Group',
 'jpeg': 'Joint Photographic Experts Group',
 'pdf': 'Portable Document Format',
 'pgf': 'PGF code for LaTeX',
 'png': 'Portable Network Graphics',
 'ps': 'Postscript',
 'raw': 'Raw RGBA bitmap',
 'rgba': 'Raw RGBA bitmap',
 'svg': 'Scalable Vector Graphics',
 'svgz': 'Scalable Vector Graphics',
 'tif': 'Tagged Image File Format',
 'tiff': 'Tagged Image File Format'}
2、两种画图接口(MATLAB风格省略)
2.1 面对对象接口
#先创建图形网络
#ax是包含两个Axes对象的数组
fig, ax = plt.subplots(2)

# 在每个对象上调用plot()方法
ax[0].plot(x, np.sin(x))
ax[1].plot(x, np.sin(x))
2.2 简易线形图
#先需要创建一个图形fig 和 一个坐标轴 ax
fig = plt.figure()  # 装图表的容器
ax = plt.axes()  #带有刻度和标签的矩形

x = np.linspace(0, 10, 1000)
"""
np.linspace(start, stop, num, endpoint, retstep, dtype) 复习
参数分析:
start:开始的数;
stop:停止的数(根据endpoint决定是开是闭);
num:数量;
endpoint:又开还是又闭;
retstep:显示出数据之间的间隔
dtype:数组类型
"""
ax.plot(x, np.sin(x))
2.3 调整线条和颜色与风格
#使用参数color、linestyle
ax.plot(x,np.sin(x),linestyle="",color="")
"""
参数分析:
linestyle=" " 可以选择--\-\-.\:
color=" " 可以输入各种颜色名称:
"""
#还可以简写成以下形式:
"""
--c\-g\-.k\:r
"""
ax.plot(x,np.sin(x),"--g")
3. 调整图形:坐标上下限
3.1 数值范围硬性调整(支持对象名操作)
# 注: 下面的 # 都表示重点内容
ax = plt.axes()
"""
在创建对象之后才可以设置上下限
也有其他方式,但下面这个方式能够一行代码解决
"""
plt.axis([x下限,x上限,y下限,y上限])  上下限可逆→坐标轴方向可以反的
3.2 数值布局自动调整(支持对象名操作)
plt.axis("tight")   不留空白
plt.axis("equal")   x与y相等
+++
4. 设置图形标签(不支持对象名操作)&创建图例
plt.title("加标题内容")           这里不支持用对象名
plt.xlabel(" ")			 x坐标名 这里不支持用对象名
plt.ylabel(" ")			 y坐标名 这里不支持用对象名
plt.legend()              创建图例
"""
但是也有使用对象操作的方法
ax.set_xlabel(" ")
ax.set_ylabel(" ")
ax.set_xlim(" ")
ax.set_ylim(" ")
ax.set_title(" ")
"""
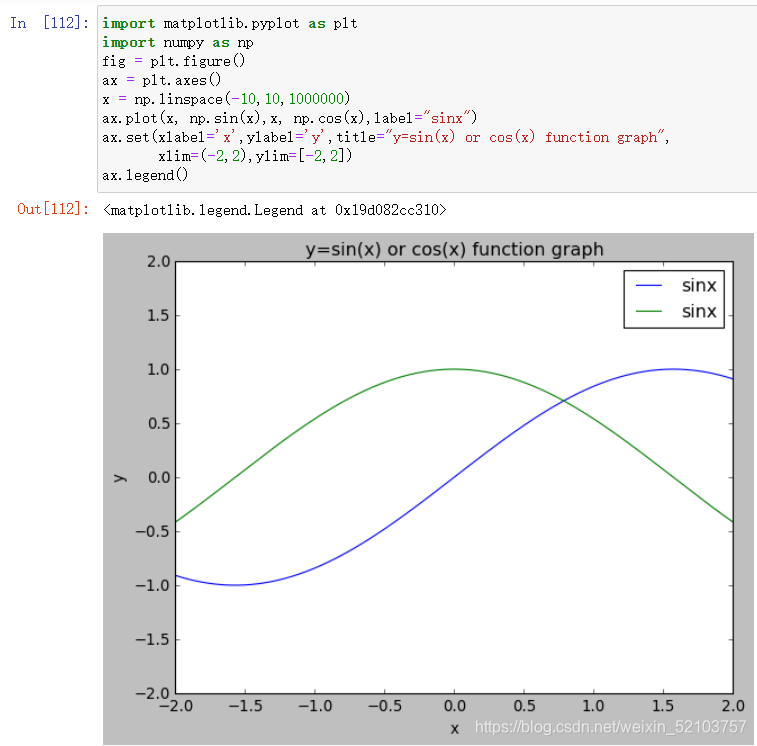
* 一次性设置所有属性
文章摘自书本《Python 数据科学手册》 初次发表,如有纰漏,感谢大家批评指正。


 1725
1725


 被折叠的 条评论
为什么被折叠?
被折叠的 条评论
为什么被折叠?
 到【灌水乐园】发言


