


雷达图简介
雷达图又称为蜘蛛图,非常适合展示对象在多个维度的属性值或得分,又或是用于展示不同样本、细胞亚群中目标基因的表达水平、微生物在不同环境中的丰度变化等等。
标签:#微生物组数据分析 #MicrobiomeStatPlot #雷达图 #R语言可视化 #Ladar plot
作者:First draft(初稿):Defeng Bai(白德凤);Proofreading(校对):Ma Chuang(马闯) and Jiani Xun(荀佳妮);Text tutorial(文字教程):Defeng Bai(白德凤)
源代码及测试数据链接:
https://github.com/YongxinLiu/MicrobiomeStatPlot/项目中目录 3.Visualization_and_interpretation/LadarChart
或公众号后台回复“MicrobiomeStatPlot”领取
雷达图案例1
这是中国农业大学Yantai Gan课题组2024年发表于Nature Communications上的一篇文章,题目为:Diversifying crop rotation increases food production, reduces net greenhouse gas emissions and improves soil health. https://doi.org/10.1038/s41467-023-44464-9
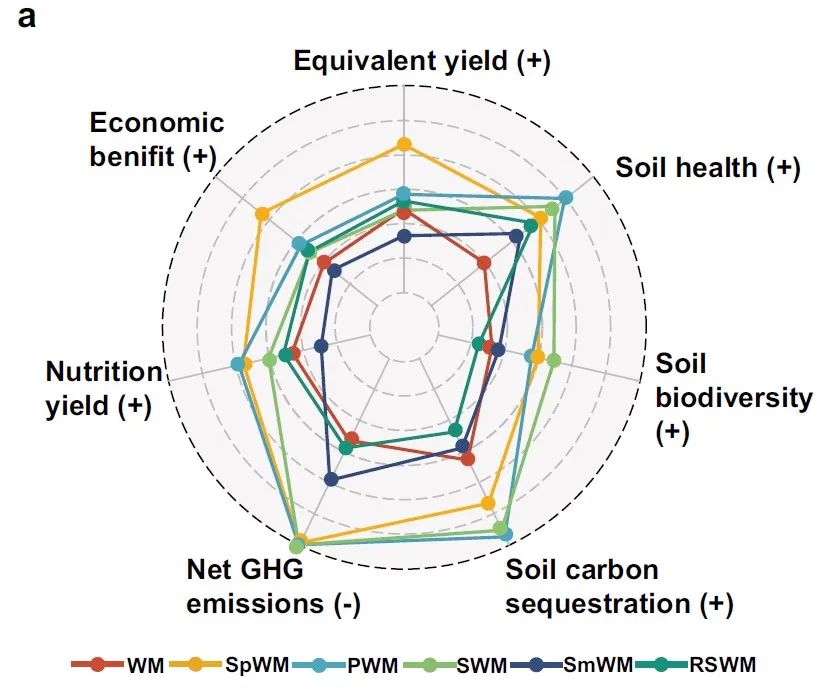
图 6 | 多目标分析雷达图。
用于评估旋转的各种功能。
结果
使用综合评价指数概念(CEI)来评估不同作物轮作在产量、营养价值、土壤相关指标(健康、碳封存、微生物生物多样性)、温室气体净排放和经济效益方面的协同作用和权衡(方法中的等式11–20)(图6a,d)。
雷达图R语言实战
源代码及测试数据链接:
https://github.com/YongxinLiu/MicrobiomeStatPlot/
或公众号后台回复“MicrobiomeStatPlot”领取
软件包安装
# 基于CRAN安装R包,检测没有则安装
p_list = c("ggplot2", "ggthemes")
for(p in p_list){if (!requireNamespace(p)){install.packages(p)}
    library(p, character.only = TRUE, quietly = TRUE, warn.conflicts = FALSE)}


# 基于github安装
library(devtools)
if(!requireNamespace("ggradar", quietly = TRUE))
  install_github("ricardo-bion/ggradar")
#>
#> ── R CMD build
最低0.47元/天 解锁文章


 被折叠的 条评论
为什么被折叠?
被折叠的 条评论
为什么被折叠?
 到【灌水乐园】发言


