


频率分布直方图简介
什么是频率分布直方图?
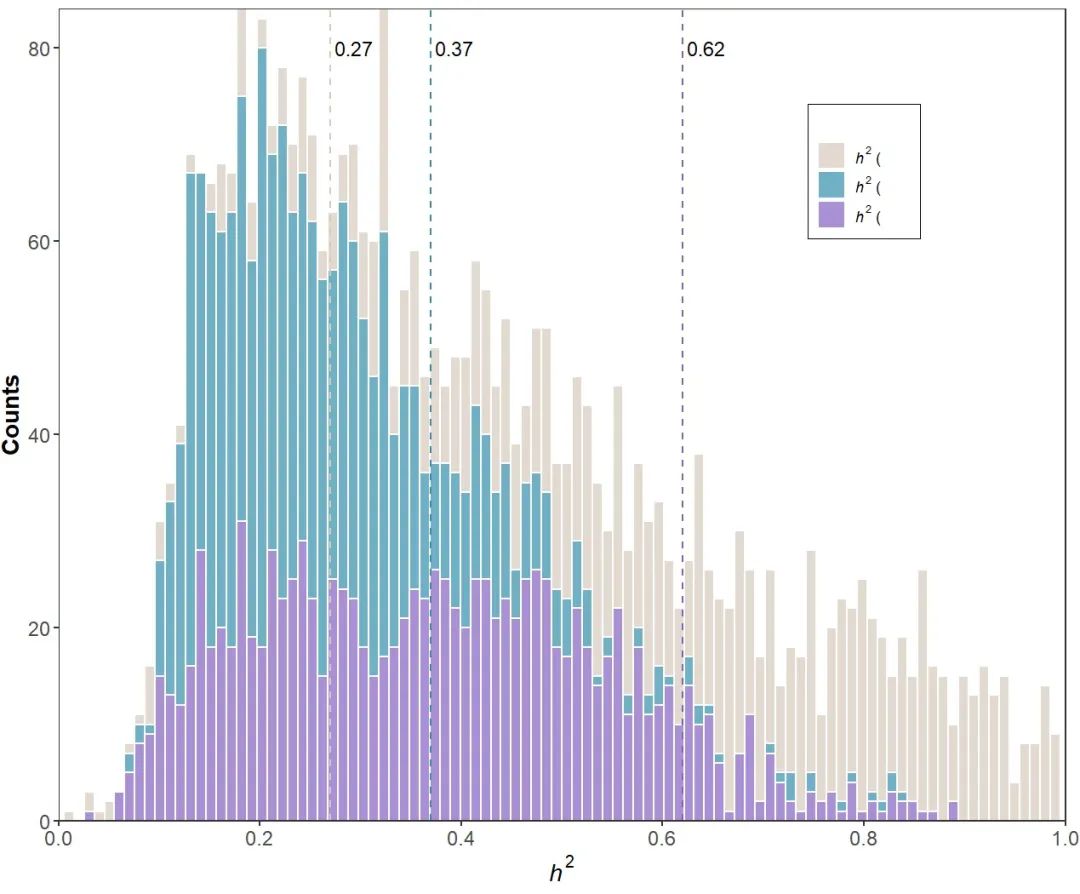
频率分布直方图(histogram)是一种图表,用于显示数据集中各个数值范围内数据出现的频率。它将连续的数据分割为若干个区间(称为bins或箱子),并根据每个区间中的数据点数量绘制矩形柱。柱子的高度表示数据在该区间内出现的频率或次数。频率分布直方图可用于查看数据的分布情况,同时帮助快速了解数据的集中趋势、离散程度等特征。
标签:#微生物组数据分析 #MicrobiomeStatPlot #频率分布直方图 #R语言可视化 #Frequency distribution histogram
作者:First draft(初稿):Defeng Bai(白德凤);Proofreading(校对):Ma Chuang(马闯) and Jiani Xun(荀佳妮);Text tutorial(文字教程):Defeng Bai(白德凤)
源代码及测试数据链接:
https://github.com/YongxinLiu/MicrobiomeStatPlot/项目中目录 3.Visualization_and_interpretation/FrequencyDistributionHistogram
或公众号后台回复“MicrobiomeStatPlot”领取
频率分布直方图应用案例
这个案例是来自于斯坦福大学Alice Y. Ting团队2021年发表于Nature Communications上的一篇论文。论文题目为:Spatiotemporally-resolved mapping of RNA binding proteins via functional proximity labeling reveals a mitochondrial mRNA anchor promoting stress recovery. https://doi.org/10.1038/s41467-021-25259-2
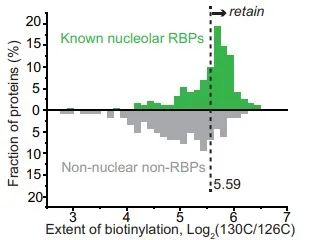
图 4b| 样本直方图显示了如何应用 130 C/126 C TMT 比率的截止值。
通过“成对 ROC 方法”(图 4a、b 和补充图 7b)和“统计方法”过滤质谱数据。
频率分布直方图R语言实战
源代码及测试数据链接:
https://github.com/YongxinLiu/MicrobiomeStatPlot/
或公众号后台回复“MicrobiomeStatPlot”领取
软件包安装
# 基于CRAN安装R包,检测没有则安装 Installing R packages based on CRAN and installing them if they are not detected
p_list = c("ggplot2", "latex2exp", "readxl", "patchwork", "dplyr", "ggdag",
           "dagitty","broom","ggsci","brms" )
for(p in p_list){if (!requireNamespace(p)){install.packages(p)}
    library(p, character.only = TRUE, quietly = TRUE, warn.conflicts = FALSE)}


# 加载R包 Loading R packages
suppressWarnings(suppressMessages(library(ggplot2)))
suppressWarnings(suppressMessages(library(latex2exp)))
suppressWarnings(suppressMessages(library(readxl)))
suppressWarnings(suppressMessages(library(patchwork)))
suppressWarnings(suppressMessages(library(dplyr)))
suppressWarnings(suppressMessages(library(ggdag)))
suppressWarnings(suppressMessages(library(dagitty)))
suppressWarnings(suppressMessages(library(broom)))
suppressWarnings(suppressMessages(library(ggsci)))
suppressWarnings(suppressMessages(library(brms)))
实战1
参考:
https://mp.weixin.qq.com/s/ypxoFaiZBIaBphcNPS5B_A https://mp.weixin.qq.com/s/nYozxXYdpBXOC4Xh1RWH1A
# 读取数据 最低0.47元/天 解锁文章


 被折叠的 条评论
为什么被折叠?
被折叠的 条评论
为什么被折叠?
 到【灌水乐园】发言


