


Data rssource
Kallisto/ star_stringtie tximport
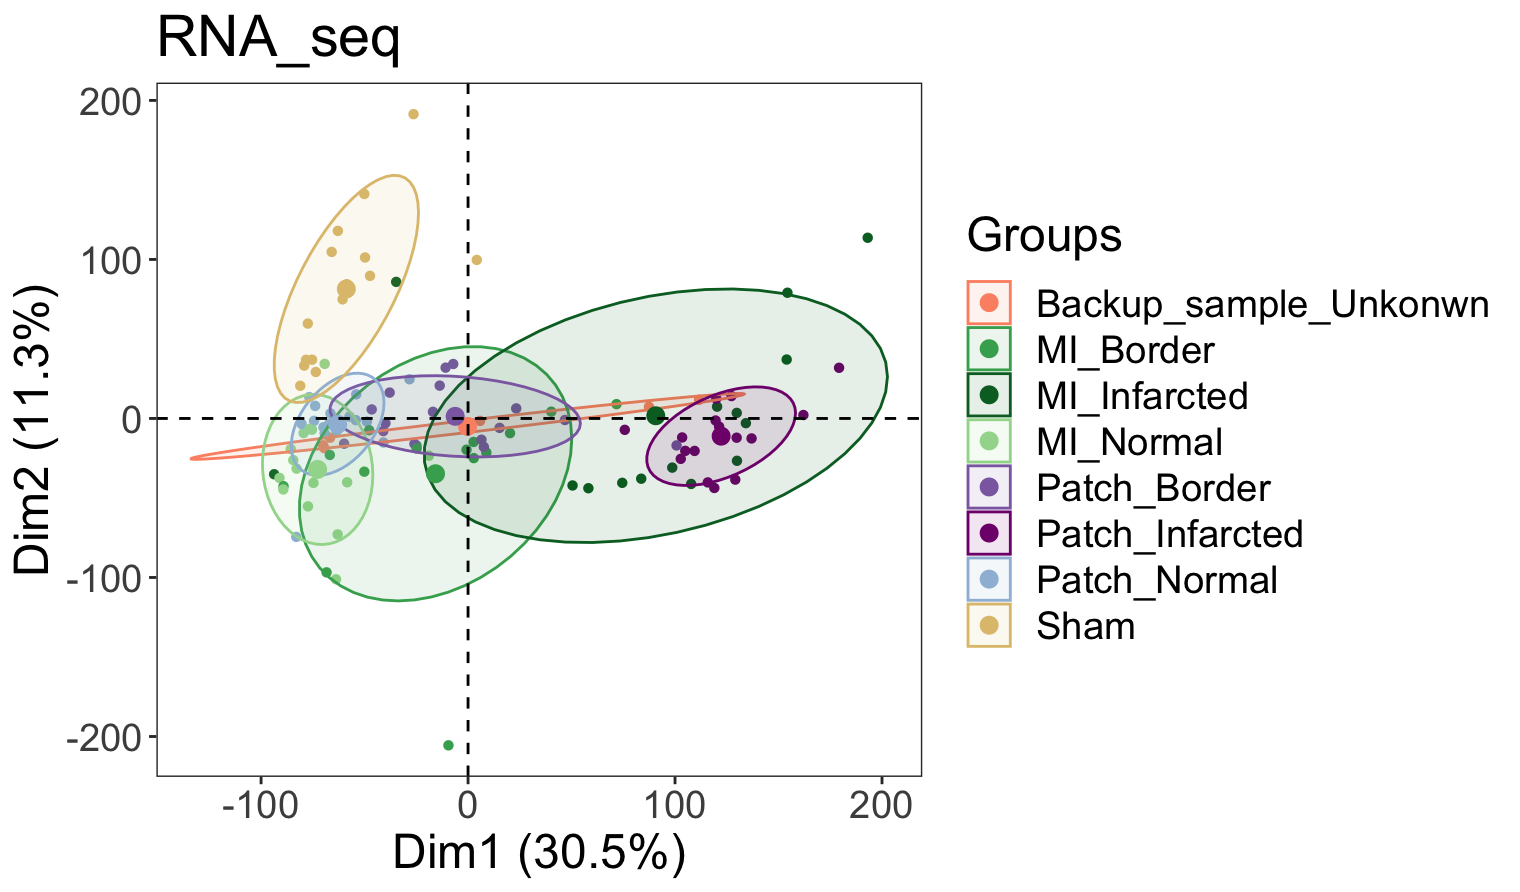
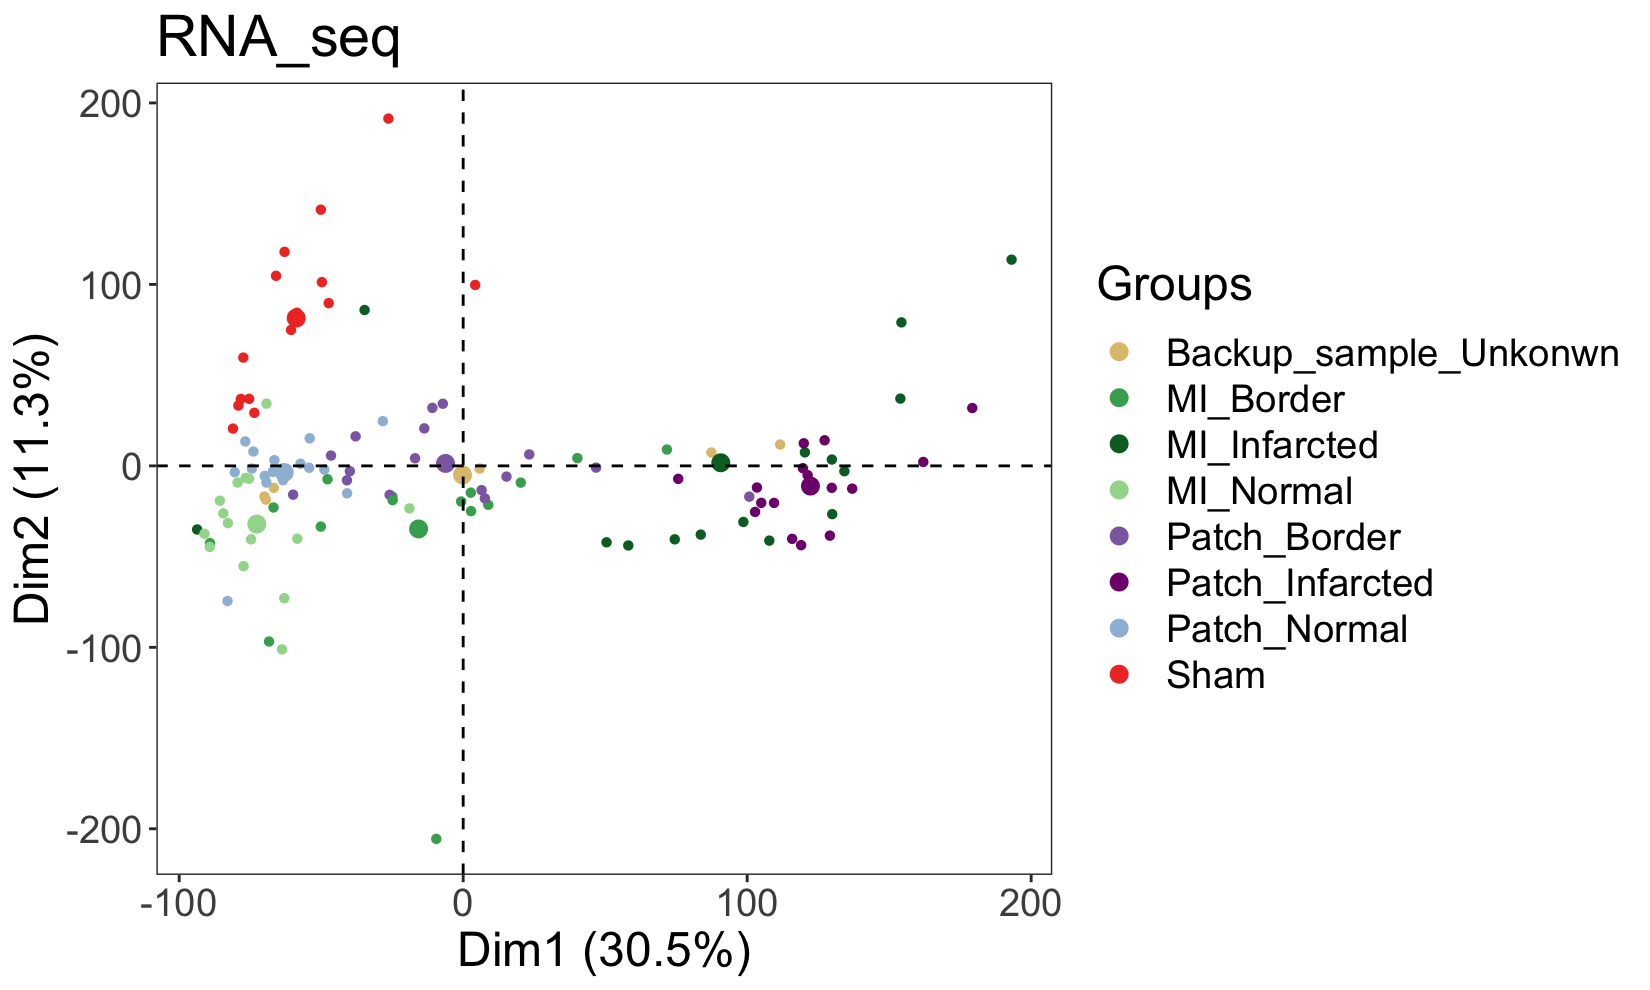
PCA of all genes in all samples
## 根据全部筛选后的,非低表达的ensmusg画PCA
library(factoextra)
library(RColorBrewer)
library(sva)

suppressMessages(library(FactoMineR))
suppressMessages(library(factoextra))

> dim(exprSet)
[1] 21690   114

dat.pca<-prcomp(t(exprSet),scale=TRUE)
group<-design_matrix$condition

#### 确保表达矩阵exprSet与design_matrix的分组信息是顺序一一对应
#### 另外这里的表达矩阵一定是转置后与分组表格横行相对应(行数相对应)

fviz_pca_ind(dat.pca,
             # 只显示点,不显示文字
             geom.ind = "point",
             # 用不同颜色表示分组
             col.ind = design_matrix$condition,
             palette = c("#DFC27D","#41AB5D","#006D2C","#A1D99B","#8C6BB1","#810F7C","#9EBCDA","#EF3B2C"),
             # 是否圈起来
             addEllipses = TRUE,
             legend.title = "Groups",ellipse.level=0.65,
             title="RNA_seq"
)+theme_bw() +
  theme(panel.grid.major=element_line(colour=NA),
        panel.background = element_rect(fill = "transparent",colour = NA),
        plot.background = element_rect(fill = "transparent",colour = NA),
        panel.grid.minor = element_blank()) +
  scale_shape_manual(values=c(16, 16, 16, 16, 16, 16, 16, 16))+
  theme(text = element_text(size = 18))


#### 接下来针对能对比到基因name的去画PCA
library(clusterProfiler)
library(org.Mm.eg.db)

en2gene <- bitr( rownames(exprSet), fromType = "ENSEMBL", toType = c( "SYMBOL" ), OrgDb = org.Mm.eg.db )
#### 'select()' returned 1:many mapping between keys and columns
#### Warning message:
#### In bitr(rownames(exprSet), fromType = "ENSEMBL", toType = c("SYMBOL"),  :
  # 11.94% of input gene IDs are fail to map...

dat.pca.gene<-prcomp(t(exprSet[en2gene$ENSEMBL,]),scale=TRUE)
group.gene<-design_matrix$condition ## 更改了基因数量但是样本数量分组没变
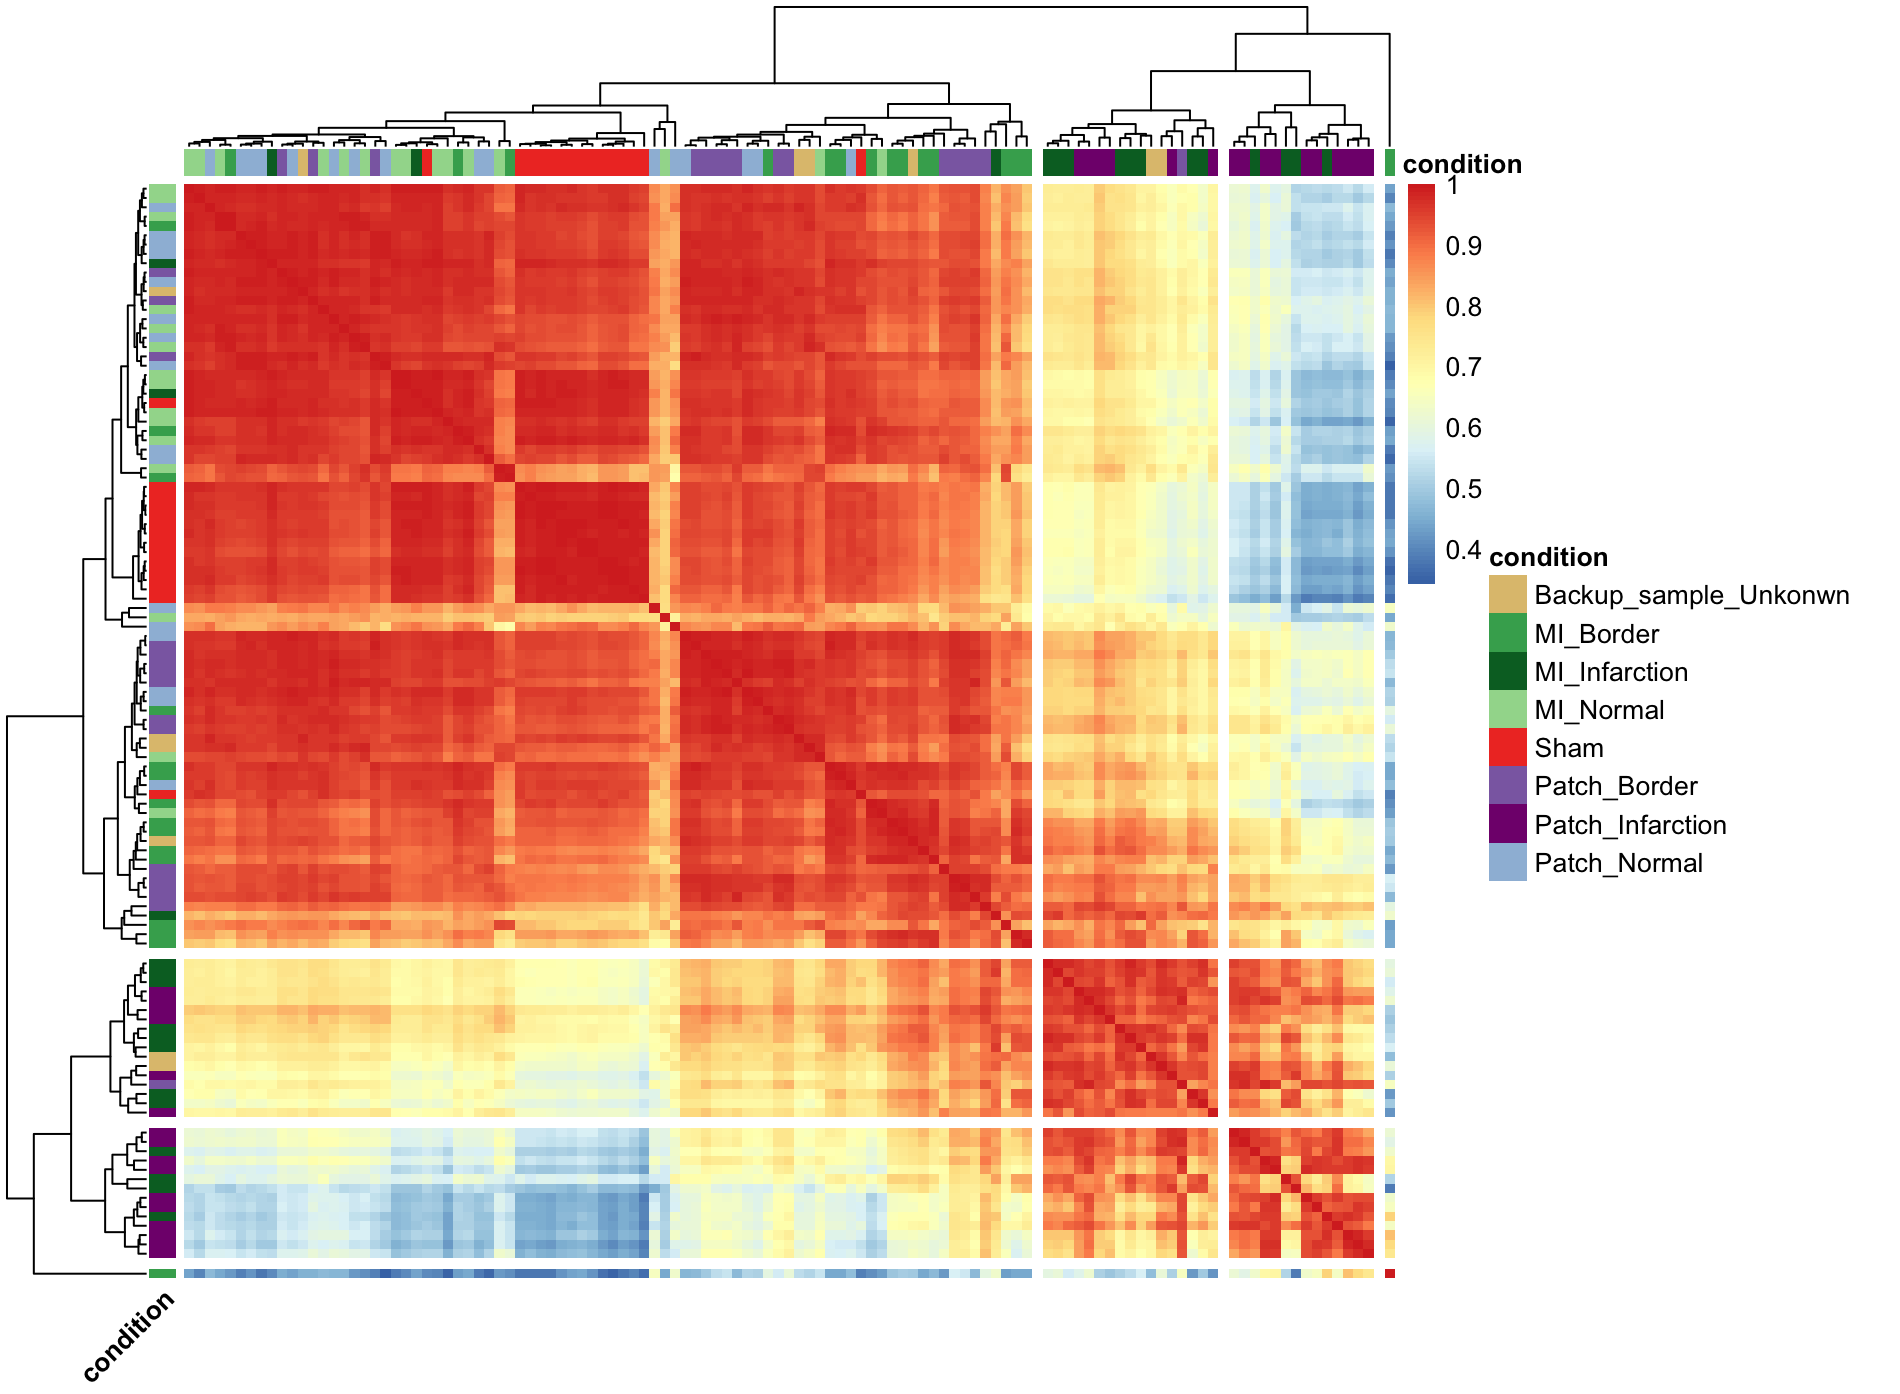
Correlation of samples
library(corrplot)
dim(exprSet)

# 加载edgeR包计算counts per millio(cpm) 表达矩阵,并对结果取log2值
library(edgeR)
exprSet3 <- cpm(exprSet,log = TRUE)

# 利用绝对中位差mad/标准差sd统计学方法进行数据异常值检测
# 将表达量的绝对中位差mad从大到小排列取前500的结果
tmp <- sort(apply(exprSet3,1, mad),decreasing = T)[1:500]
exprSet3 <- exprSet3[names(tmp),]

# 使用500个基因的表达量来做相关性图
library(corrplot)
dim(exprSet)
# 计算相关性
M <- cor(exprSet)

annotation_col<-data.fram(condition=design_matrix$condition)
rownames(annotation_col)<-rownames(M)

ann_colors = list(
  condition = c(Backup_sample_Unkonwn = "#DFC27D",MI_Border="#41AB5D",MI_Infarction="#006D2C",MI_Normal="#A1D99B",Sham="#EF3B2C",Patch_Border="#8C6BB1",
                Patch_Infarction = "#810F7C",Patch_Normal = "#9EBCDA")
)

## 注意在组别较多且名字复杂时候,一定注意检查ann_colors与annotation_col的名字是否一致。
## 具体可以进行
> names(ann_colors[[1]])==unique(annotation_col$condition)
[1] TRUE TRUE TRUE TRUE TRUE TRUE TRUE TRUE
## 这里我是把二者的组别顺序改为一致,检查

pheatmap(M,annotation_col = annotation_col,annotation_row = annotation_col,show_rownames=FALSE,
         show_colnames = FALSE,annotation_colors = ann_colors,angle_col = "45",
         clustering_distance_rows = drows,
         # color = colorRampPalette(c("navy", "white", "firebrick3"))(100),
         clustering_distance_cols = dcols,clustering_callback = callback,
         cutree_row = 4,cutree_col = 4)
Differential expressed genes analysis
##
library(DESeq2)
### 把针对的组别拎出来
MI_Patch_infracted_index<-c(which(design_matrix$condition=="MI_Infarction"),which(design_matrix$condition=="Patch_Infarction"))
Sample_focus<-colnames(data)[MI_Patch_infracted_index]

exprSet_focus<-data[,Sample_focus]
rownames(exprSet_focus)<-rownames(exprSet)
rownames(design_matrix)<-design_matrix$sample
group_list<-design_matrix[Sample_focus,]$condition

#### 第一步,构建DESeq2的DESeq对象
colData <- data.frame(row.names=colnames(exprSet_focus),group_list=group_list)
dds <- DESeqDataSetFromMatrix(countData = exprSet_focus,colData = colData,
                              design = ~ group_list)
#### 第二步,进行差异表达分析
dds2 <- DESeq(dds)
res <- results(dds2,contrast=c("group_list","MI_Infarction","Patch_Infarction"))

# 提取差异分析结果,trt组对untrt组的差异分析结果
resOrdered <- res[order(res$padj),]
head(resOrdered)

DEG <- as.data.frame(resOrdered)

# 去除差异分析结果中包含NA值的行
DESeq2_DEG = na.omit(DEG)

## 取出包含logFC和P值的两列
nrDEG=DESeq2_DEG[,c(2,6)]
colnames(nrDEG)=c('log2FoldChange','pvalue')

# 排序差异倍数,提取前200和后200的基因名
FC <- nrDEG$log2FoldChange
names(FC) <- rownames(DEG)
DEG_200 <- c(names(head(sort(FC),200)),names(tail(sort(FC),200)))
head(DEG_200)
# 提取基因的归一化
dat <- t(scale(t(exprSet_focus[DEG_200,])))
dat[1:4,1:4]
rownames(dat)<-DEG_200
group <- data.frame(group=group_list)
rownames(group)=colnames(exprSet_focus)
## 这里我选用的dat是 dat<-exprSet_focus[DEG_200,],原始counts数据,即只用原始数值log之后,再scale=row画图
pheatmap(log(dat+1),show_colnames =F,show_rownames = F, cluster_cols = T,scale = "row",
         annotation_col=group,color = colorRampPalette(c("#006D2C", "white", "#EF3B2C"))(50))


 370
370


 被折叠的 条评论
为什么被折叠?
被折叠的 条评论
为什么被折叠?
 到【灌水乐园】发言


