


绘制动态图思想步骤
(1)生成多张静态图
(2)静态图组合形成动态图
示例:
(生成单图)
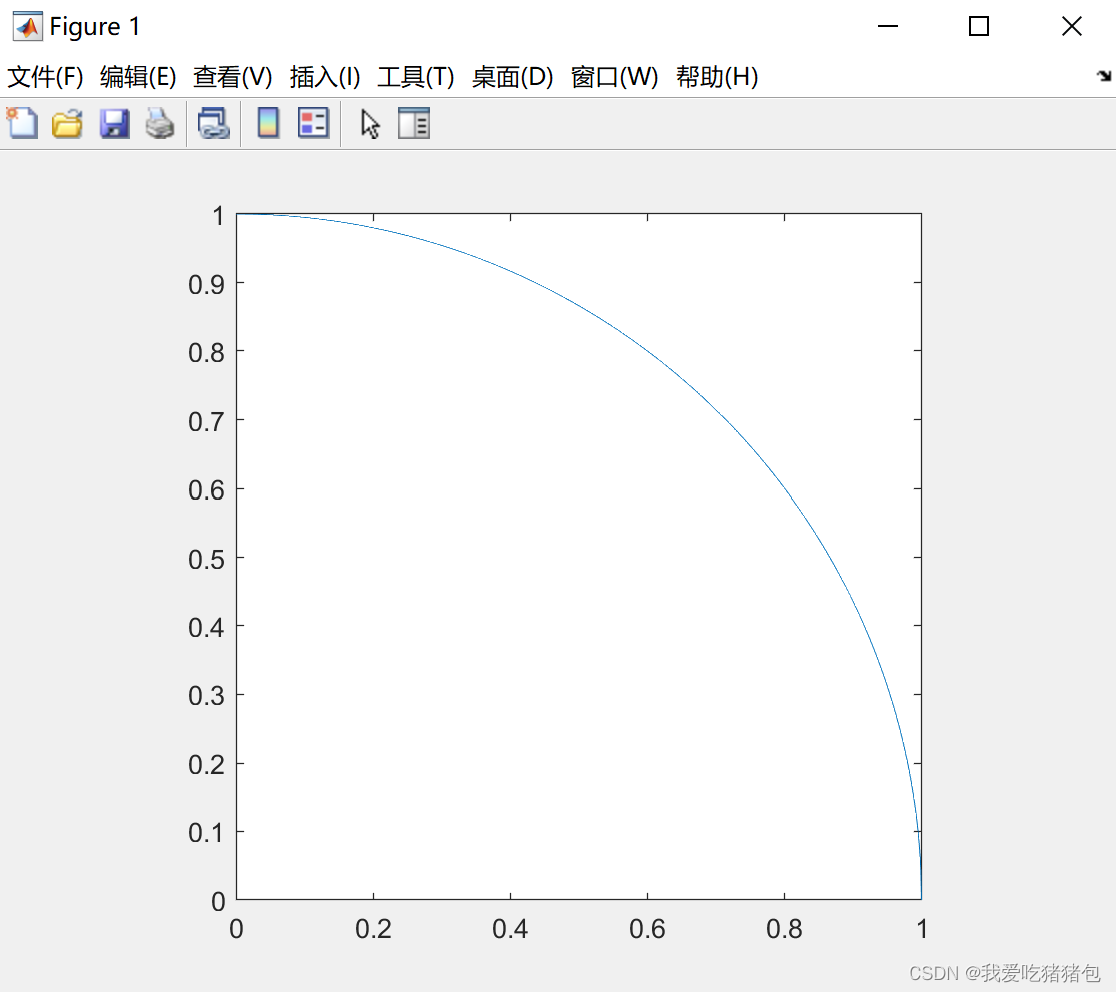
生成边缘线
// An MATLAB block
x=linspace(0,1,1000);
y=(1-x.^2).^0.5;
plot(x,y);
axis square;
结果:
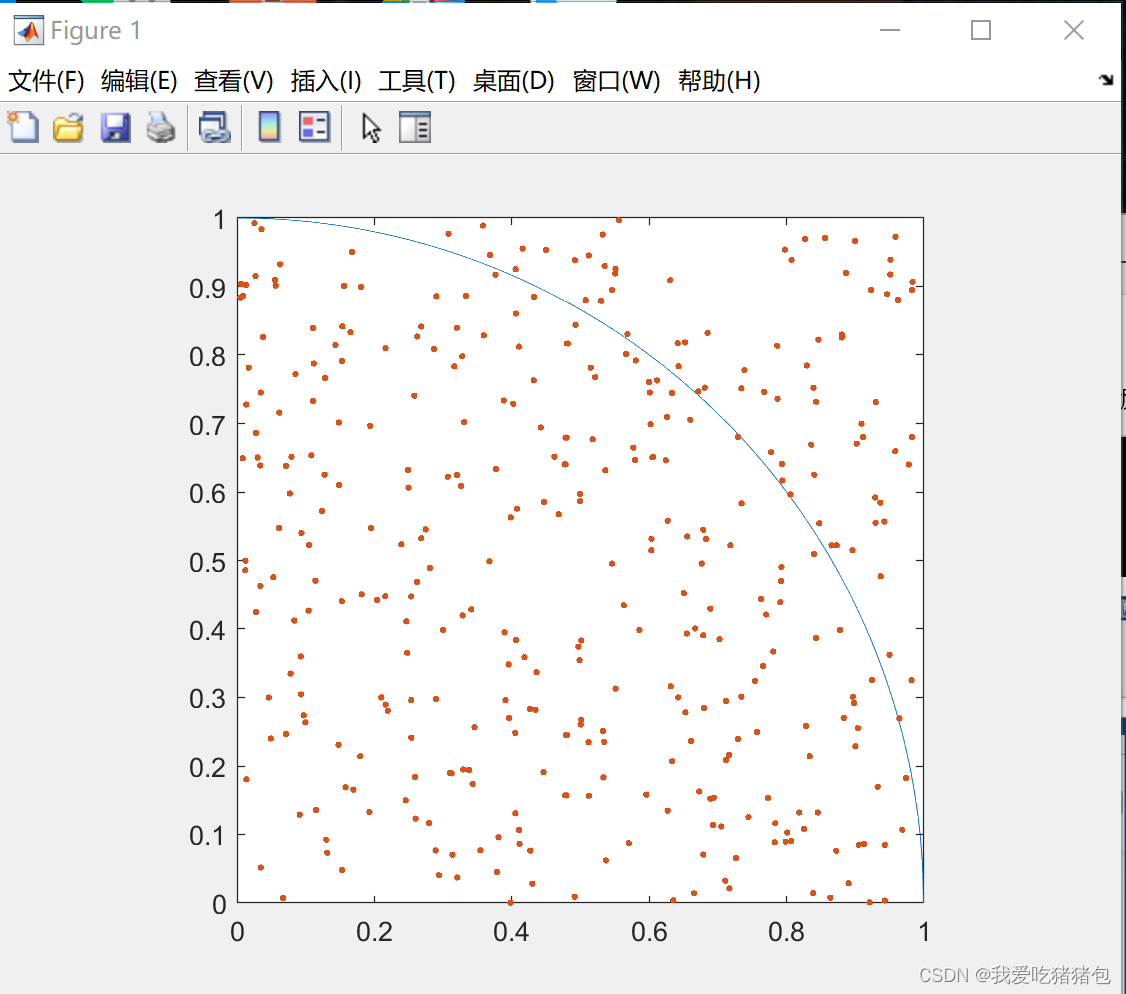
生成多个随机点
// An MATLAB block
x=linspace(0,1,1000);
y=(1-x.^2).^0.5;
x1=rand([1,360]);
y1=rand([1,360]);
plot(x,y,x1,y1,".");%散点以“.”形式呈现;
axis square;
结果:
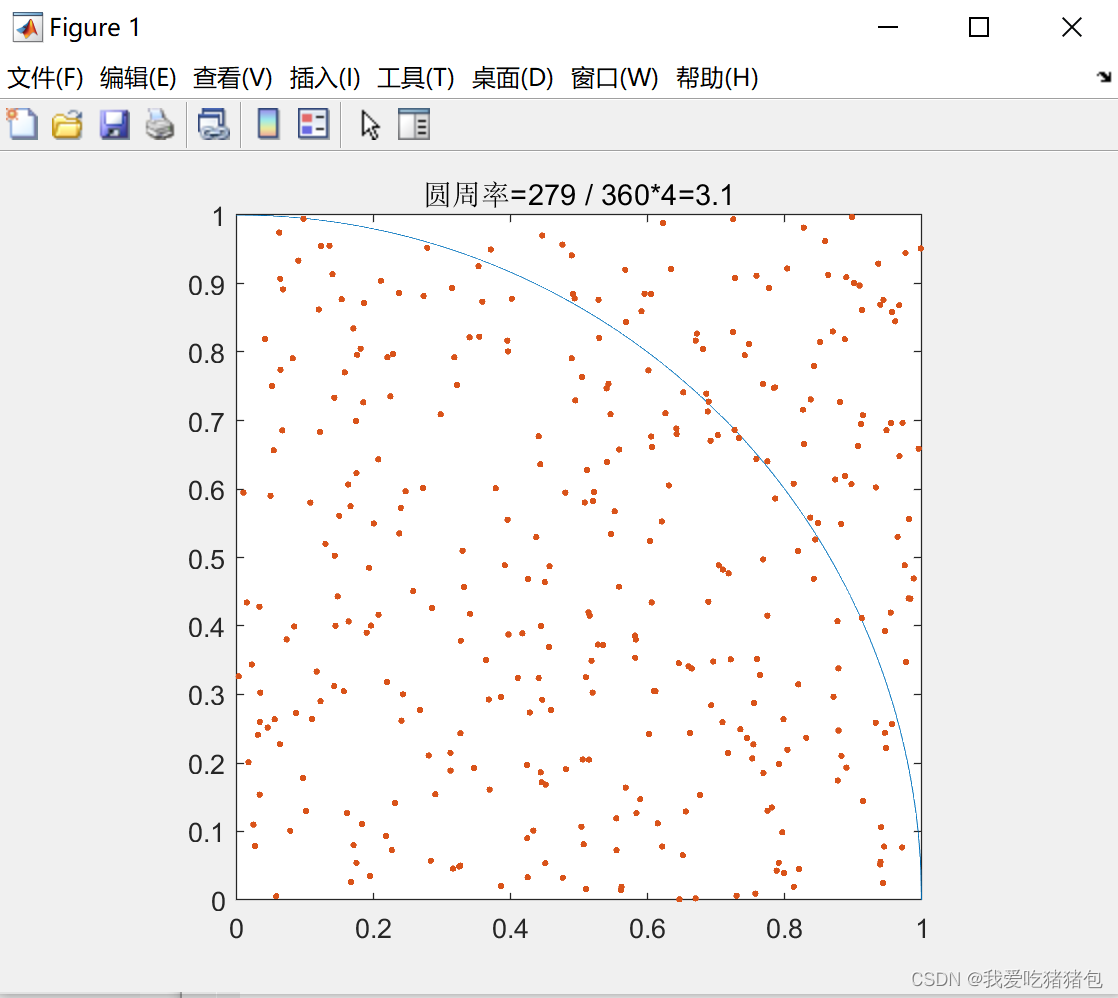
计算圆周率
// An MATLAB block
x=linspace(0,1,1000);
y=(1-x.^2).^0.5;
x1=rand([1,360]);
y1=rand([1,360]);
plot(x,y,x1,y1,".");%散点以“.”形式呈现;
count=0;
for j=1:360
    if x1(j)^2+y1(j)^2 <=1
        count =count +1;%统计点在圆内个个数
    end
end
title(["圆周率="+num2str(count)+" / "+num2str(360)+"*"+"4"+"="+num2str(count/360*4)]);%计算圆周率
axis square;
结果:
(利用循环生成动态图)
代码:
// An MATLAB block
for i= [ 100,200,300,1000,2000,3000,4000,5000,6000,7000,8000,9000,10000];%循环变化点数
x=linspace(0,1,1000);
y=(1-x.^2).^0.5;
x1=rand([1,i]);
y1=rand([1,i]);
plot(x,y,"ko",x1,y1,".");%散点以“.”形式呈现;
count=0;
for j=1:i
    if x1(j)^2+y1(j)^2 <=1
        count =count +1;%统计点在圆内个个数
    end
end
title(["圆周率="+num2str(count)+" / "+num2str(i)+"*"+"4"+"="+num2str(count/i*4)]);%计算圆周率
axis square;
frame=getframe(gcf);%捕获坐标区间或图窗为影片帧
I=frame2im(frame);%返回与影片帧关联的图像数据
[I,map]=rgb2ind(I,256);%将PGB图像转换为索引图像I,关联颜色图为map
if i==100
    imwrite(I ,map,'test.gif','gif','Loopcount',inf,'DelayTime',0.5);
else
    imwrite(I ,map,'test.gif','gif','WriteMode','append','DelayTime',0.5);
end
end
结果:
生成一个由十三幅图依次出现而成的动态图,十三幅图中的散点数量依次增加。


 7889
7889


 被折叠的 条评论
为什么被折叠?
被折叠的 条评论
为什么被折叠?
 到【灌水乐园】发言


