


目录
1 交叉验证
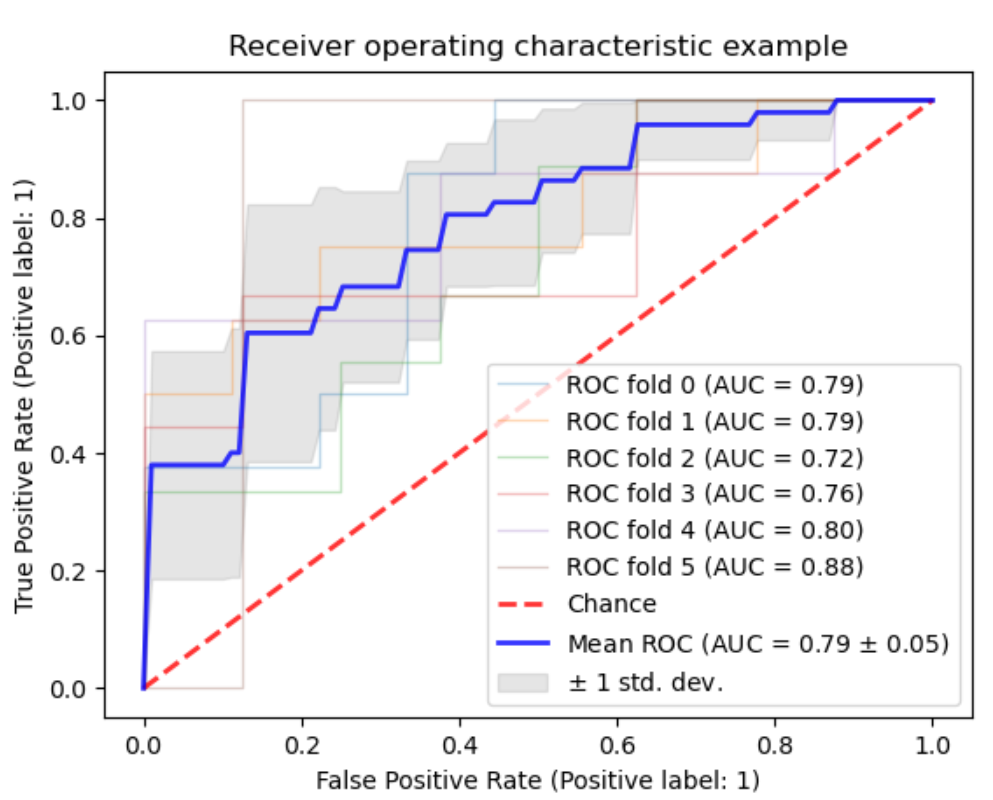
在进行模型性能评估的时候,避免不了进行交叉验证实验。但,想要使用AUROC和AUPR曲线绘制交叉验证的平均结果,是一个麻烦的问题。一般来说,绘制一次实验结果的AUROC和AUPR曲线没有什么难度,而交叉验证的曲线结果则需要取曲线的平均结果。值得注意的是,skit-learn的官方给了一个绘制交叉验证AUROC曲线的例子,采用的绘制方法为线性插值法。
具体的思想是用np.interp(具体用法)拟合每次结果的AUROC曲线,然后将每次拟合的曲线结果取平均进行绘图。下面是官方给出的demo:
2 P y t h o n \rm{}Python Python绘制交叉验证 A U R O C \rm{}AUROC AUROC
具体见参考文献[1]
import numpy as np
import matplotlib.pyplot as plt

from sklearn import svm, datasets
from sklearn.metrics import auc
from sklearn.metrics import RocCurveDisplay
from sklearn.model_selection import StratifiedKFold

# #############################################################################
# Data IO and generation

# Import some data to play with
iris = datasets.load_iris()
X = iris.data
y = iris.target
X, y = X[y != 2], y[y != 2]
n_samples, n_features = X.shape

# Add noisy features
random_state = np.random.RandomState(0)
X = np.c_[X, random_state.randn(n_samples, 200 * n_features)]

# #############################################################################
# Classification and ROC analysis

# Run classifier with cross-validation and plot ROC curves
cv = StratifiedKFold(n_splits=6)
classifier = svm.SVC(kernel="linear", probability=True, random_state=random_state)

tprs = []
aucs = []
mean_fpr = np.linspace(0, 1, 100)

fig, ax = plt.subplots()
for i, (train, test) in enumerate(cv.split(X, y)):
    classifier.fit(X[train], y[train])
    viz = RocCurveDisplay.from_estimator(
        classifier,
        X[test],
        y[test],
        name="ROC fold {}".format(i),
        alpha=0.3,
        lw=1,
        ax=ax,
    )
    interp_tpr = np.interp(mean_fpr, viz.fpr, viz.tpr)
    interp_tpr[0] = 0.0
    tprs.append(interp_tpr)
    aucs.append(viz.roc_auc)

ax.plot([0, 1], [0, 1], linestyle="--", lw=2, color="r", label="Chance", alpha=0.8)

mean_tpr = np.mean(tprs, axis=0)
mean_tpr[-1] = 1.0
mean_auc = auc(mean_fpr, mean_tpr)
std_auc = np.std(aucs)
ax.plot(
    mean_fpr,
    mean_tpr,
    color="b",
    label=r"Mean ROC (AUC = %0.2f $\pm$ %0.2f)" % (mean_auc, std_auc),
    lw=2,
    alpha=0.8,
)

std_tpr = np.std(tprs, axis=0)
tprs_upper = np.minimum(mean_tpr + std_tpr, 1)
tprs_lower = np.maximum(mean_tpr - std_tpr, 0)
ax.fill_between(
    mean_fpr,
    tprs_lower,
    tprs_upper,
    color="grey",
    alpha=0.2,
    label=r"$\pm$ 1 std. dev.",
)

ax.set(
    xlim=[-0.05, 1.05],
    ylim=[-0.05, 1.05],
    title="Receiver operating characteristic example",
)
ax.legend(loc="lower right")
plt.show()
3 P y t h o n \rm{}Python Python绘制交叉验证 A U R R \rm{}AURR AURR
相较于官方给出的AUROC交叉验证例子,绘制交叉验证AUPR曲线并没有给出官方实现。但是,根据官方给出的绘制AUROC的思路,仍然可以实现一个线性插值法的AUPR曲线绘图方法。(详情见参考文献[3])
下面是实现代码:
from scipy import interp
# Other packages/functions are imported, but not crucial to the question
max_ent = LogisticRegression()

mean_precision = 0.0
mean_recall = np.linspace(0,1,100)
mean_average_precision = []

for i in set(folds):
    y_scores = max_ent.fit(X_train, y_train).decision_function(X_test)
    precision, recall, _ = precision_recall_curve(y_test, y_scores)
    average_precision = average_precision_score(y_test, y_scores)
    mean_average_precision.append(average_precision)
    mean_precision += interp(mean_recall, recall, precision)

# After this line of code, inspecting the mean_precision array shows that
# the majority of the elements equal 1. This is the part that is confusing me
# and is contributing to the incorrect plot.
mean_precision /= len(set(folds))
# This is what the actual MAP score should be
mean_average_precision = sum(mean_average_precision) / len(mean_average_precision)

# Code for plotting the mean average precision curve across folds
plt.plot(mean_recall, mean_precision)
plt.title('Mean AP Over 10 folds (area=%0.2f)' % (mean_average_precision))
plt.show()
值得注意的是,对于AUPR的计算和绘图方式,有两种声音
- 单独求每一折验证集的auc,取十次auc的平均值
- 把每一折验证集算出的的probablity合并成一个总的验证集probablity,然后对应label求auc
我本人更加偏向第一个,因为这种更加common,具体的讨论可以见参考文献[4]。对于第四方法的详细实现也可以见参考文献[3]。
4 参考文献
[1]Receiver Operating Characteristic (ROC) with cross validation
[2]十折交叉验证的auc应该怎么计算?
[3]如何在Scikit-Learn中绘制PR曲线超过10倍的交叉验证
[4]具有交叉验证奇怪行为的PR-ROC曲线


 2万+
2万+


 被折叠的 条评论
为什么被折叠?
被折叠的 条评论
为什么被折叠?
 到【灌水乐园】发言


