


欢迎大家关注全网生信学习者系列:
- WX公zhong号:生信学习者
- Xiao hong书:生信学习者
- 知hu:生信学习者
- CDSN:生信学习者2
介绍
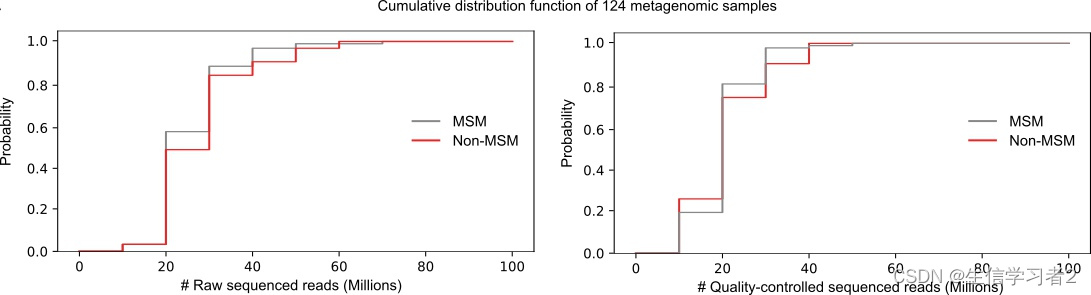
本教程介绍如何使用累积分布函数来检查宏基因组测序Reads的质量,特别是检查不同组样本中是否存在测序偏差。
数据
大家通过以下链接下载数据:
- 百度网盘链接:https://pan.baidu.com/s/1f1SyyvRfpNVO3sLYEblz1A
- 提取码: 请关注WX公zhong号_生信学习者_后台发送 复现msm 获取提取码
Python 包
绘制Reads计数的累积分布函数
您将使用一个Python脚本cumulative_distribution_function.py,以及一个包含每个宏基因组样本中读取数量的表格,例如./data/example_reads_stats.tsv。
cumulative_distribution_function.py代码
#!/usr/bin/env python

import pandas as pd
from scipy.stats import ranksums
import seaborn as sns
import matplotlib.pyplot as plt
import matplotlib
import sys
import argparse
import textwrap
import numpy as np

"""
NAME: cumulative_distribution_function.py
DESCRIPTION: cumulative_distribution_function.py is a python script to draw cumulative curves.
AUTHOR: Kun D. Huang
Date: 29.10.2023
"""
def read_args(args):
    # This function is to parse arguments

    parser = argparse.ArgumentParser(formatter_class=argparse.RawDescriptionHelpFormatter,
                                         description = textwrap.dedent('''\
                                         This program is to run draw cumulative curves.
                                         '''),
                                         epilog = textwrap.dedent('''\
                                         examples: cumulative_distribution_function.py --input_table <input_table.tsv> --output_figure <output.svg> --value_header <value_header>
                                         '''))
    parser.add_argument('--input_table',
                        nargs = '?',
                        help = 'Input a table containing values you would like to draw cumulative function on.',
                        type = str,
                        default = None)

    parser.add_argument('--output_figure',
                        nargs = '?',
                        help = 'Specificy the output figure name.',
                        type = str,
                        default = None)

    parser.add_argument('--value_header',
                        nargs = '?',
                        help = 'Specify the header name where values of interest are.',
                        type = str,
                        default = None)

    parser.add_argument('--variable_header',
                        nargs = '?',
                        help = 'Specify the header name if these values are from different groups of a variable.',
                        type = str,
                        default = None)

    parser.add_argument('--palette_map',
                        nargs = '?',
                        help = 'Give a palette map file where the first column is group names and second column is values.',
                        type = str,
                        default = None)

    parser.add_argument('--font_style',
                        nargs = '?',
                        help = 'Specify the font style. default: [Arial]',
                        type = str,
                        default = "Arial")

    parser.add_argument('--font_size',
                        nargs = '?',
                        help = 'Specify the font size. default: [11]',
                        type = str,
                        default = 11)


    return vars(parser.parse_args())

def EvalCdf(sample, x):
    count = 0.0
    for value in sample:
        if value <= x:
            count += 1
    prob = count / len(sample)
    return prob

def make_cdf_table(input_df, value_header, variable_header = None):
    cutoffs = np.linspace(0, max(input_df[value_header].to_list()), 10)
    if variable_header:
        groups = set(input_df[variable_header].to_list())
        cdf_dfs = []
        for group in groups:
            group_df = pd.DataFrame([[group, cutoff, EvalCdf(input_df[input_df[variable_header] == group][value_header].to_list(), cutoff)] for cutoff in cutoffs],
                              columns = [variable_header, "Cutoffs", "CDFs"])
            cdf_dfs.append(group_df)
        cdf_df = pd.concat(cdf_dfs)

    else:
        cdf_df = pd.DataFrame([[cutoff, EvalCdf(input_df[value_header].to_list(), cutoff)] for cutoff in cutoffs],
                              columns = ["Cutoffs", "CDFs"])

    return cdf_df

class VisualTools:
    def __init__(self, processed_df):
        self.processed_df = processed_df

    def step_curves(self, opt_name, variable_header = None, palette = None, font_type = "Arial", font_size = 11):
        fig, ax = plt.subplots()
        font_family = 'sans-serif'
        matplotlib.rcParams['font.family'] = font_family
        matplotlib.rcParams['font.{}'.format(font_family)] = font_type
        if palette:
            palette_dict = {i.rstrip().split('\t')[0]: i.rstrip().split('\t')[1] for i in open(palette).readlines()}
            if variable_header:
                categories = list(set(self.processed_df[variable_header].to_list()))
                for c in categories:
                    sub_df = self.processed_df[self.processed_df[variable_header] == c]
                    plt.step(sub_df["Cutoffs"], sub_df["CDFs"], label = c, color = palette_dict[c])
            else:
                plt.step(self.processed_df["Cutoffs"], self.processed_df["CDFs"])
        else:
            if variable_header:
                categories = list(set(self.processed_df[variable_header].to_list()))
                for c in categories:
                    sub_df = self.processed_df[self.processed_df[variable_header] == c]
                    plt.step(sub_df["Cutoffs"], sub_df["CDFs"], label = c)
            else:
                plt.step(self.processed_df["Cutoffs"], self.processed_df["CDFs"])
        plt.xlabel("Values", fontsize = font_size)
        plt.ylabel("Cumulative distribution function", fontsize = font_size)
        if variable_header:
            plt.legend(title = variable_header)
        plt.xticks(fontsize = font_size)
        plt.yticks(fontsize = font_size)
        fig.savefig(opt_name, bbox_inches = "tight")


if __name__ == "__main__":
    pars = read_args(sys.argv)
    input_df = pd.read_csv(pars["input_table"], sep = "\t", index_col = False)
    CDF_df = make_cdf_table(input_df,
                            pars["value_header"],
                            pars["variable_header"])
    vis_obj = VisualTools(CDF_df)
    vis_obj.step_curves(pars["output_figure"],
                        pars["variable_header"],
                        pars["palette_map"],
                        pars["font_style"],
                        pars["font_size"])
- usage of
cumulative_distribution_function.py
cumulative_distribution_function.py -h

usage: cumulative_distribution_function.py [-h] [--input_table [INPUT_TABLE]] [--output_figure [OUTPUT_FIGURE]] [--value_header [VALUE_HEADER]]
                                           [--variable_header [VARIABLE_HEADER]] [--palette_map [PALETTE_MAP]] [--font_style [FONT_STYLE]] [--font_size [FONT_SIZE]]

This program is to run draw cumulative curves.

optional arguments:
  -h, --help            show this help message and exit
  --input_table [INPUT_TABLE]
                        Input a table containing values you would like to draw cumulative function on.
  --output_figure [OUTPUT_FIGURE]
                        Specificy the output figure name.
  --value_header [VALUE_HEADER]
                        Specify the header name where values of interest are.
  --variable_header [VARIABLE_HEADER]
                        Specify the header name if these values are from different groups of a variable.
  --palette_map [PALETTE_MAP]
                        Give a palette map file where the first column is group names and second column is values.
  --font_style [FONT_STYLE]
                        Specify the font style. default: [Arial]
  --font_size [FONT_SIZE]
                        Specify the font size. default: [11]

examples:

python cumulative_distribution_function.py --input_table <input_table.tsv> --output_figure <output.svg> --value_header <value_header>
示例命令 1:
python cumulative_distribution_function.py \
  --input_table example_reads_stats.tsv \
  --output_figure nr_QC_reads_pairs.svg \
  --value_header nr_QC_reads_pairs \
  --palette_map reads_stats_color_map.tsv
示例命令 2:
python cumulative_distribution_function.py \
  --input_table example_reads_stats.tsv \
  --output_figure nr_raw_reads_pairs.svg \
  --value_header nr_raw_reads_pairs \
  --palette_map reads_stats_color_map.tsv
如果您希望为不同的变量类别指定特定的颜色,例如将灰色指定给MSM(男男性行为者),将红色指定给Non-MSM(非男男性行为者),您可以使用一个颜色调色板映射,如./data/reads_stats_color_map.tsv。


 129
129


 被折叠的 条评论
为什么被折叠?
被折叠的 条评论
为什么被折叠?
 到【灌水乐园】发言


