0. 感知器:
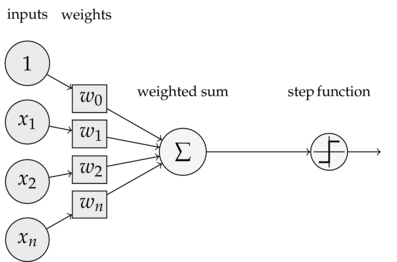
- 感知器——神经网络的组成单元(神经元)
- 和逻辑回归相似,但是激活函数不同,损失函数计算不同。
- 感知器不仅仅可以实现简单的不二运算,它还可以拟合线性函数,任何的线性分类或线性回归问题都可以用感知器来解决。
- 感知器定义:

1. 导入鸢尾花数据集
import numpy as np
import pandas as pd

data=pd.read_csv("data/iris.csv")
data.head()
| SepalLength | SepalWidth | PetalLength | PetalWidth | Name |
|---|
| 0 | 5.1 | 3.5 | 1.4 | 0.2 | Iris-setosa |
|---|
| 1 | 4.9 | 3.0 | 1.4 | 0.2 | Iris-setosa |
|---|
| 2 | 4.7 | 3.2 | 1.3 | 0.2 | Iris-setosa |
|---|
| 3 | 4.6 | 3.1 | 1.5 | 0.2 | Iris-setosa |
|---|
| 4 | 5.0 | 3.6 | 1.4 | 0.2 | Iris-setosa |
|---|
data.drop_duplicates(inplace=True)
data["Name"]=data["Name"].map({"Iris-versicolor":0,"Iris-virginica":1,"Iris-setosa":-1})
data=data[data["Name"]!=0]
len(data)
97
2. 感知器算法实现
- 感知器VS逻辑回归:
- 逻辑回归:使用所有样本计算梯度,更新损失值。
- 感知器:使用单个样本一次计算梯度,更新损失值。
class Perceptron:
"""感知器算法,实现二分类"""
def __init__(self,alpha,times):
"""
初始化函数
alpha: float 学习率
times:int 迭代次数
"""
self.alpha=alpha
self.times=times
def step(self,z):
"""
阶跃函数:
参数:
z:类数组类型(或者是标量类型)
returns:
value:int
如果z>=0,则返回1,否则返回-1。
"""
return np.where(z>=0,1,-1)
def fit(self,X,y):
X=np.asarray(X)
y=np.asarray(y)
self.w_=np.zeros(1+X.shape[1])
self.loss_=[]
for i in range(self.times):
"""
感知器VS逻辑回归:
逻辑回归:使用所有样本计算梯度,更新损失值。
感知器:使用单个样本一次计算梯度,更新损失值。
"""
loss=0
for x,target in zip(X,y):
y_hat=self.step(np.dot(x,self.w_[1:])+self.w_[0])
loss+=y_hat!=target
self.w_[0]+=self.alpha*(target-y_hat)
self.w_[1:]+=self.alpha*(target-y_hat)*x
self.loss_.append(loss)
def predict(self,X):
return self.step(np.dot(X,self.w_[1:])+self.w_[0])
3.数据集划分
t1=data[data["Name"]==1]
t2=data[data["Name"]==-1]
t1=t1.sample(len(t1),random_state=666)
t2=t2.sample(len(t2),random_state=666)
X_train=pd.concat([t1.iloc[:40,:-1],t2.iloc[:40,:-1]],axis=0)
y_train=pd.concat([t1.iloc[:40,-1],t2.iloc[:40,-1]],axis=0)
X_test=pd.concat([t1.iloc[40:,:-1],t2.iloc[40:,:-1]],axis=0)
y_test=pd.concat([t1.iloc[40:,-1],t2.iloc[40:,-1]],axis=0)
4.创建对象,进行分类
p=Perceptron(0.1,10)
p.fit(X_train,y_train)
result=p.predict(X_test)
display(result)
display(y_test.values)
display(p.w_)
display(p.loss_)
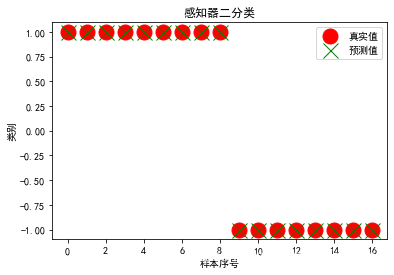
array([ 1,  1,  1,  1,  1,  1,  1,  1,  1, -1, -1, -1, -1, -1, -1, -1, -1])


array([ 1,  1,  1,  1,  1,  1,  1,  1,  1, -1, -1, -1, -1, -1, -1, -1, -1],
      dtype=int64)


array([-0.2 , -0.4 , -1.  ,  1.84,  0.84])


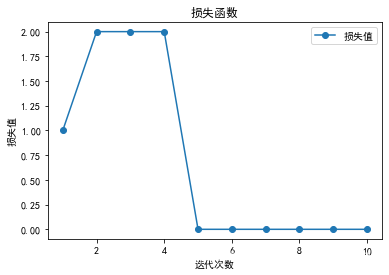
[1, 2, 2, 2, 0, 0, 0, 0, 0, 0]
5. 可视化展示
import matplotlib as mpl
import matplotlib.pyplot as plt
mpl.rcParams["font.family"]="SimHei"
mpl.rcParams["axes.unicode_minus"]=False
plt.plot(y_test.values,'ro',ms=15,label="真实值")
plt.plot(result,'gx',ms=15,label="预测值")
plt.title("感知器二分类")
plt.xlabel("样本序号")
plt.ylabel("类别")
plt.legend()
<matplotlib.legend.Legend at 0x12013e4d6c8>

plt.plot(range(1,p.times+1),p.loss_,"o-",label="损失值")
plt.title("损失函数")
plt.xlabel("迭代次数")
plt.ylabel("损失值")
plt.legend()
<matplotlib.legend.Legend at 0x12013fad888>


 本文深入解析感知器算法,一种用于二分类任务的基本神经网络单元。通过鸢尾花数据集演示了感知器的实现过程,包括数据预处理、算法实现、模型训练及可视化结果。对比逻辑回归,感知器采用单样本梯度下降,更适用于在线学习。


 8590
8590

 被折叠的 条评论
为什么被折叠?


