


 本文详细介绍了从头开始学习单细胞数据分析的过程,包括数据下载、Seaborn版本问题、使用Scanpy进行数据预处理、基因表达分析、数据筛选、标准化、PCA和UMAP降维聚类,以及寻找和比较maker基因。
有点大言不惭信口开河哈!重复一遍教程后发现不懂的地方太多了,希望各位看官原谅博眼球赚流量的标题!也解决了一点小问题,比如seaborn的版本问题,帮大家节省一点debug时间。
本人之前无任何单细胞相关分析背景,从头开始学习。
一、数据下载,7.3M
官网经常下载失败:https://scanpy-tutorials.readthedocs.io/en/latest/pbmc3k.html
百度网链接:https://pan.baidu.com/s/1RNXmLNZWHlteIUGifP_m4w 提取码:xysm
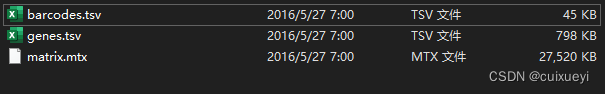
解压后有三个文件:
barcodes.tsv:每个细胞的barcode用于下机数据拆分
genes.tsv:小鼠所有gene id以及对应的gene symbol,对于小鼠来说研究很广泛,基本所有gene都有symbol,但是对于笔者研究的玉米来说,绝大多数基因只有gene id ,没有symbol。
matrix.mtx:表达量信息,前三行暂且不管,第一列为基因,第二列为细胞,第三列为count数
二、数据分析
1.导包
import numpy as np
import pandas as pd
import scanpy as sc
2.设置
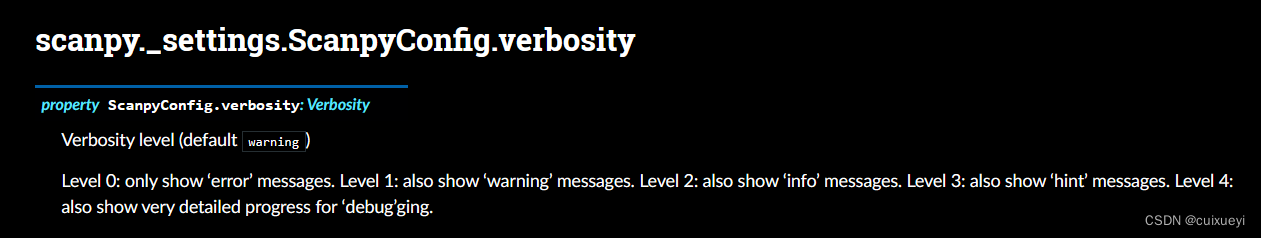
sc.settings.verbosity = 3             # verbosity: errors (0), warnings (1), info (2), hints (3)
sc.logging.print_header()
sc.settings.set_figure_params(dpi=80, facecolor='white')
比如verbosity设置,分五个level。如下图,level0仅展示报错信息等等。
3.读取文件
这里有一个要注意的点,sc.read_10x_mtx中的var_names参数可以设置为gene_symbol或者gene_ids,这将对后面的代码产生影响
# the file that will store the analysis results
results_file = 'E:/python/scripts_from_cxy/singel_cell_study/data/write/pbmc3k.h5ad'

#输出内容:... writing an h5ad cache file to speedup reading next time,将三个文件整合成为h5ad文件
#生成一个文件夹cache,里面有一个h5ad文件
adata = sc.read_10x_mtx(
    'E:/python/scripts_from_cxy/singel_cell_study/data/filtered_gene_bc_matrices/hg19/',  # the directory with the `.mtx` file
    var_names='gene_symbols',                # use gene symbols for the variable names (variables-axis index)
    cache=True)                              # write a cache file for faster subsequent reading
#看完这个就明白上面‘var_names='gene_symbols’的意思了
adata.var_names_make_unique()  # this is unnecessary if using `var_names='gene_ids'` in `sc.read_10x_mtx`
4.基因表达情况
如果第三步选择gene_ids,图片的纵坐标为gene id
#在所有细胞内对所有基因计算其reads所占该细胞reads的百分比x,选出x最大的前二十个基因
sc.pl.highest_expr_genes(adata, n_top=20, )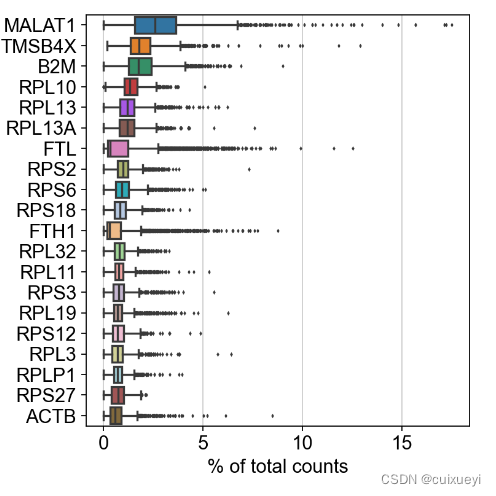
5.数据筛选
也可以对counts数筛选
sc.pp.filter_cells(adata, min_genes=200)#最少200个基因表达,否则去除该细胞
sc.pp.filter_genes(adata, min_cells=3)#一个基因最少要在三个细胞里表达,否则删除该基因
输出:filtered out 19024 genes that are detected in less than 3 cells
6.去除线粒体基因
pip list检查seaborn版本,如果不是0.12.2版本会报错
相关问答链接:https://github.com/theislab/scvelo/issues/66
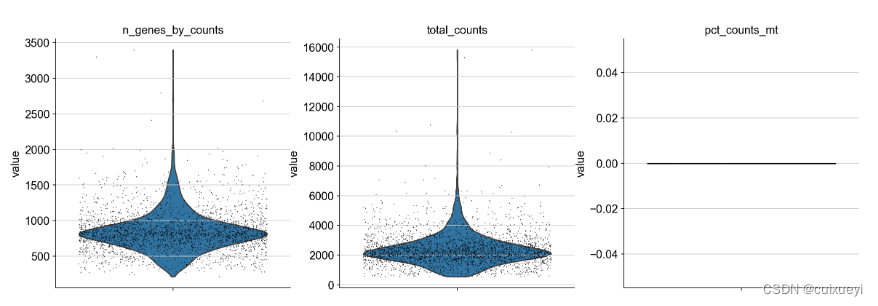
如果第3步选择gene_ids,这里会出现问题,因为这段代码是将gene_symbols中以’MT‘为开头的symbol识别为线粒体基因,而gene_ids没有’MT‘开头,所以没有线粒体基因,图片里为一条y=0的直线,如下,左边是正确图,右边是问题图
图的含义分别为:每个细胞表达的基因数,每个细胞的count数,每个细胞线粒体基因count数占比
这里可以通过adata.var,adata.obs查看各个数值的含义
#版本问题需要pip install seaborn==0.12.2,https://github.com/theislab/scvelo/issues/66
#其次上面sc.read_10x_mtx的参数var_names='gene_symbols'必须这样写才能识别出线粒体基因,因为它是按照线粒体英文字母MT识别的
#问题在于如果使用gene_ids,如何去掉线粒体基因呢?
adata.var['mt'] = adata.var_names.str.startswith('MT-')  # annotate the group of mitochondrial genes as 'mt'
sc.pp.calculate_qc_metrics(adata, qc_vars=['mt'], percent_top=None, log1p=False, inplace=True)
sc.pl.violin(adata, ['n_genes_by_counts', 'total_counts', 'pct_counts_mt'],
             jitter=0.4, multi_panel=True)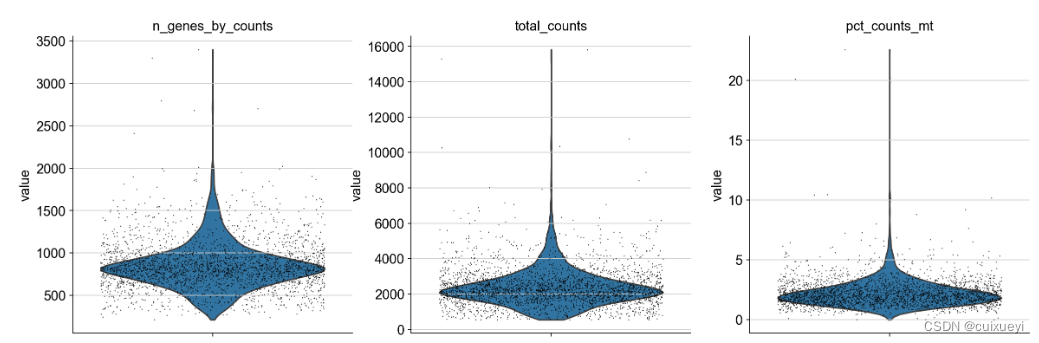
sc.pl.scatter(adata, x='total_counts', y='pct_counts_mt')
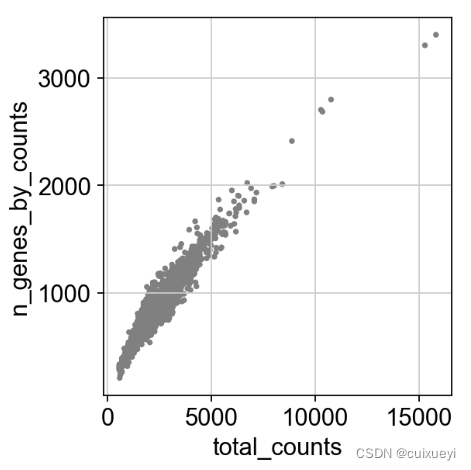
sc.pl.scatter(adata, x='total_counts', y='n_genes_by_counts')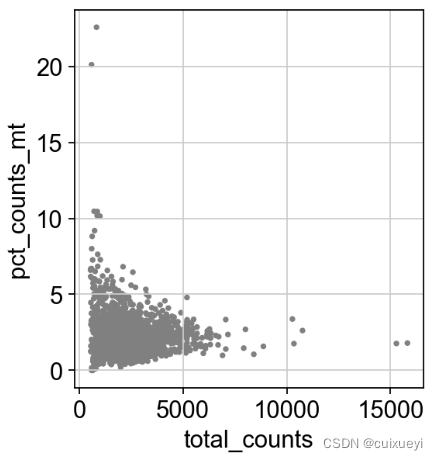
绝大多数细胞线粒体基因count小于5%
随后将线粒体基因count数大于5%的细胞去除,并且去除表达超过2500个基因的细胞,这个我还不知道为什么!
adata = adata[adata.obs.n_genes_by_counts < 2500, :]
adata = adata[adata.obs.pct_counts_mt < 5, :]
7.数据标准化
在统计完count数、细胞数等之后,进行数据分析时需要标准化
#每个细胞counts标准化至10000
sc.pp.normalize_total(adata, target_sum=1e4)
#将数据对数化
sc.pp.log1p(adata)
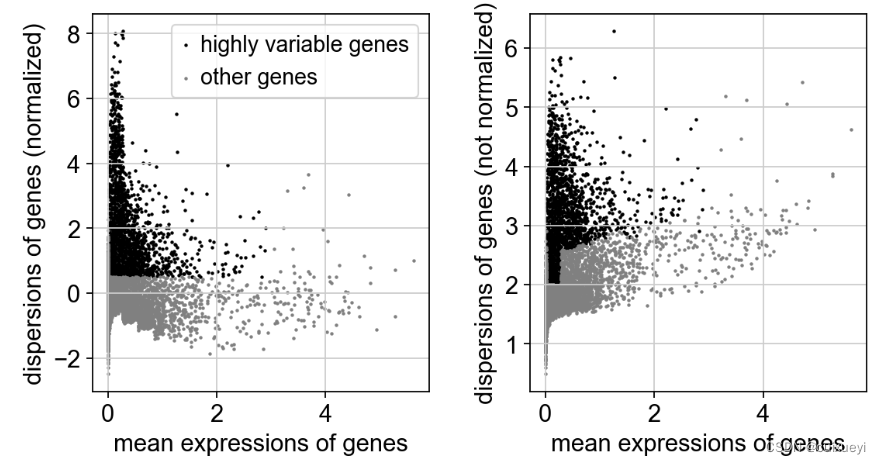
8.寻找高度变化的基因
展示基因的分散程度以及表达水平,一个是未标准化的,一个是标准化后的dispersions
从图中看出表达水平越高的基因,其离散水平趋向于变小
注意,此时是将highly_variable_genes的数据加到adata中
sc.pp.highly_variable_genes(adata, min_mean=0.0125, max_mean=3, min_disp=0.5)
sc.pl.highly_variable_genes(adata)
9.1838个highly_variable_genes
后续分析针对1838个highly_variable_genes
#将完整的adata“备份”
adata.raw = adata
#新的adata只包括highly_variable_genes,有1838个gene,完整的adata有13714个gene
adata = adata[:, adata.var.highly_variable]
#Regress out effects of total counts per cell and the percentage of mitochondrial genes expressed. Scale the data to unit variance.
#线性回归每个细胞的total counts和线粒体基因counts,并缩放到单位方差
sc.pp.regress_out(adata, ['total_counts', 'pct_counts_mt'])
#Scale each gene to unit variance. Clip values exceeding standard deviation 10.
#var属性多了mean、std两个
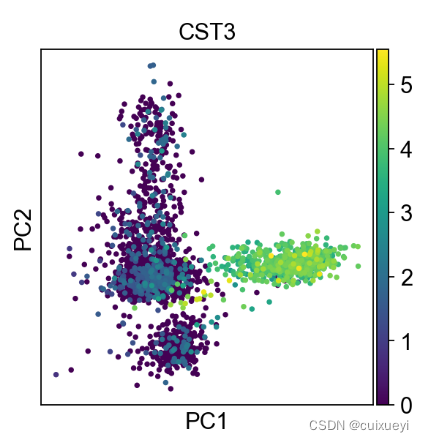
sc.pp.scale(adata, max_value=10)10.主成分分析,pca
CST3是一个基因,按照这个基因的表达情况上色
第3步有result_file,这里将生成的新数据加到h5da文件中
#多了个obsm和varm两个属性,uns属性多了一个pca,里面包含了pca计算的相关信息,如降维方法、点的坐标等
#所以这里的pca图是针对1838个highly_variable_genes画的
sc.tl.pca(adata, svd_solver='arpack')
sc.pl.pca(adata, color='CST3')
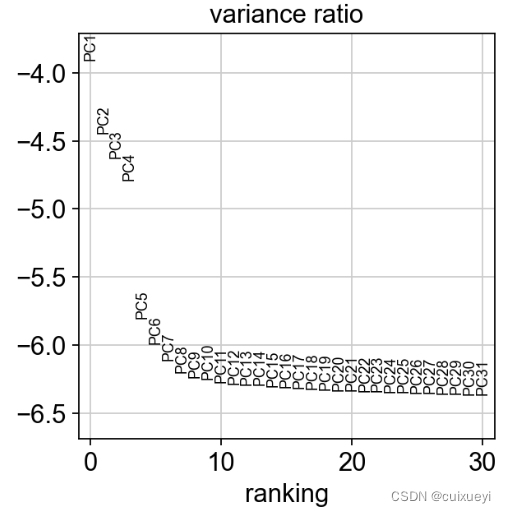
#查看每个PC的贡献率
sc.pl.pca_variance_ratio(adata, log=True)
adata.write(results_file)
11.umap降维聚类
这里图片较多,只展示聚类之后用leiden着色的图,可以看出分为8个簇,但是这里的图与官网略有差别,还不到哪里有问题
#计算Computing the neighborhood graph
sc.pp.neighbors(adata, n_neighbors=10, n_pcs=40)
sc.tl.umap(adata)
#做出来的图跟教程有些差别
sc.pl.umap(adata, color=['CST3', 'NKG7', 'PPBP'])
sc.pl.umap(adata, color=['CST3', 'NKG7', 'PPBP'], use_raw=False)

#Clustering the neighborhood graph。聚类并着色
#这里需要安装pip3 install leidenalg
sc.tl.leiden(adata)
sc.pl.umap(adata, color=['leiden', 'CST3', 'NKG7'])
adata.write(results_file)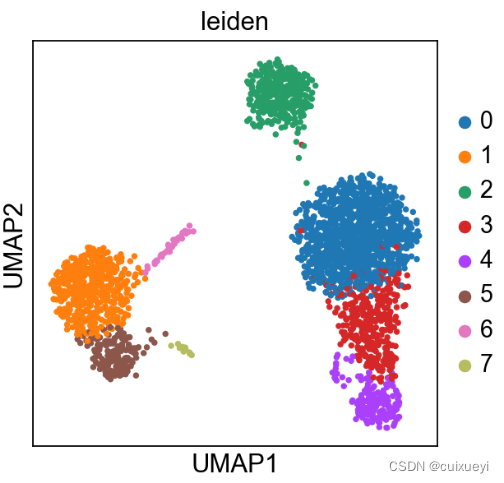
12.寻找maker基因
上面leiden聚类图有0-7共8个簇,每个簇与rest相比,rest是和何方神圣?按照函数介绍,rest是其它组的并集

采用三种方法寻找maker基因分别是t-test、wilcoxon、logreg
这里展示t-test方法生成的图
sc.tl.rank_genes_groups(adata, 'leiden', method='t-test')
sc.pl.rank_genes_groups(adata, n_genes=25, sharey=False)

sc.settings.verbosity = 2  # reduce the verbosity

sc.tl.rank_genes_groups(adata, 'leiden', method='wilcoxon')
sc.pl.rank_genes_groups(adata, n_genes=25, sharey=False)

adata.write(results_file)

sc.tl.rank_genes_groups(adata, 'leiden', method='logreg')
sc.pl.rank_genes_groups(adata, n_genes=25, sharey=False)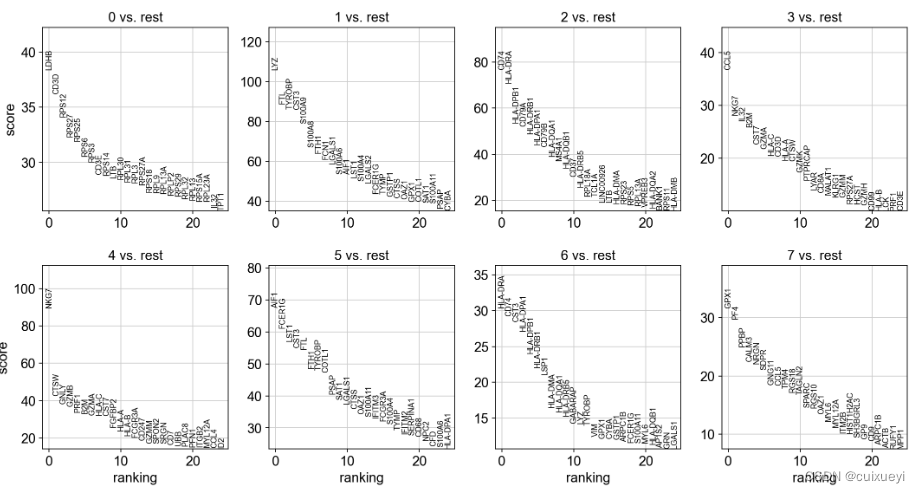
13.maker gene展示
pd.DataFrame(adata.uns['rank_genes_groups']['names']).head(5)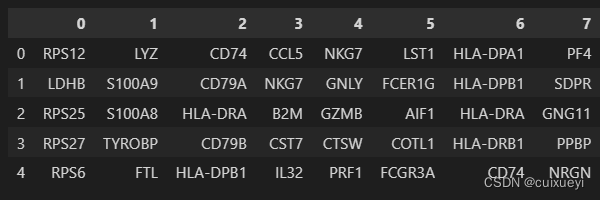
Get a table with the scores and groups.阿哦,基因一样,但是p值不同!
result = adata.uns['rank_genes_groups']
groups = result['names'].dtype.names
pd.DataFrame(
    {group + '_' + key[:1]: result[key][group]
    for group in groups for key in ['names', 'pvals']}).head(5)
14.maker gene比较
单一的簇比较,这里比较0簇和1簇,展示0簇
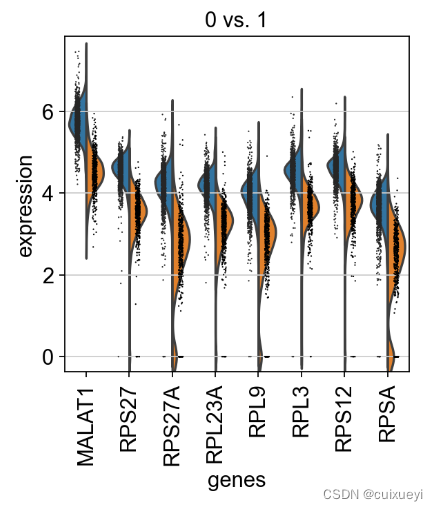
两个簇比较,看哪些基因更能区分两个簇(左图),以及这些基因的表达情况(右图)
sc.tl.rank_genes_groups(adata, 'leiden', groups=['0'], reference='1', method='wilcoxon')
sc.pl.rank_genes_groups(adata, groups=['0'], n_genes=20)
sc.pl.rank_genes_groups_violin(adata, groups='0', n_genes=8)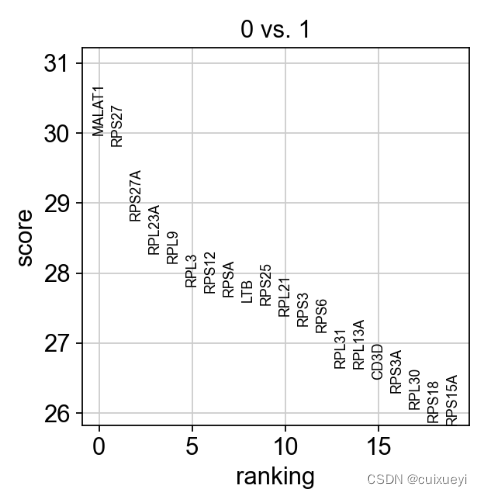
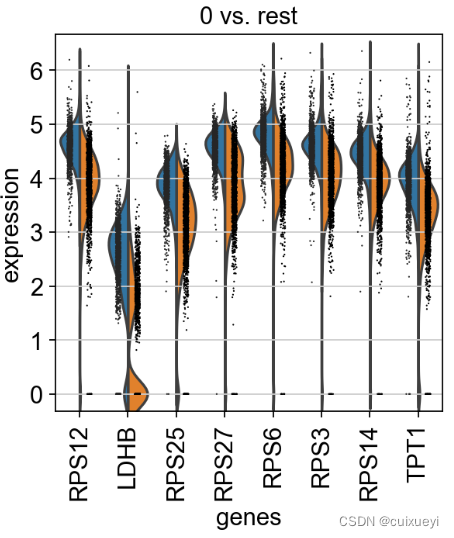
上面比较的是0簇和1簇,现在比较0簇和剩余簇(rest)
#展示0簇与剩余簇的计算结果,上面是新计算的0簇和1簇
adata = sc.read(results_file)
sc.pl.rank_genes_groups_violin(adata, groups='0', n_genes=8)
也可以比较某个基因在不同簇中的表达情况
#比较某个基因
sc.pl.violin(adata, ['CST3', 'NKG7', 'PPBP'], groupby='leiden')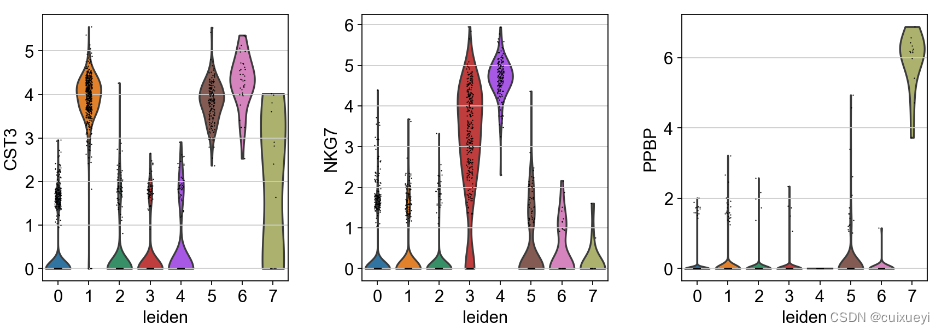
15.标记细胞类型
问题是这些细胞类型的信息从何而来?
人和小鼠有丰富的数据库资源如CellMarker2.0 (hrbmu.edu.cn),但又是如何知道哪个簇对应哪个细胞类型?
如果分析的是玉米数据该如何是好?
new_cluster_names = [
    'CD4 T', 'CD14 Monocytes',
    'B', 'CD8 T',
    'NK', 'FCGR3A Monocytes',
    'Dendritic', 'Megakaryocytes']
adata.rename_categories('leiden', new_cluster_names)
sc.pl.umap(adata, color='leiden', legend_loc='on data', title='', frameon=False)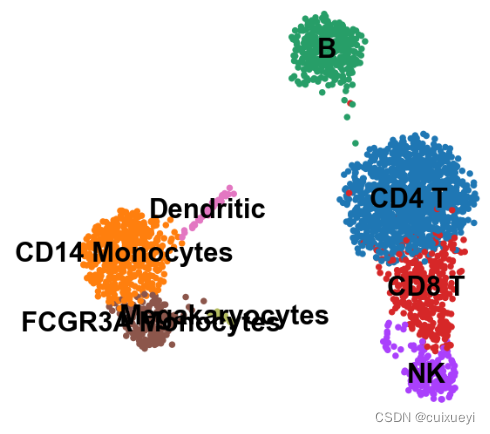
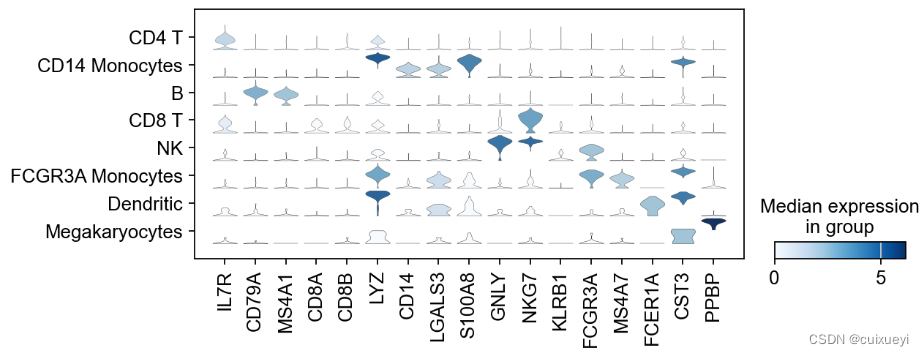
16.细胞类型与maker gene表达情况
sc.pl.dotplot(adata, marker_genes, groupby='leiden');
sc.pl.stacked_violin(adata, marker_genes, groupby='leiden', rotation=90);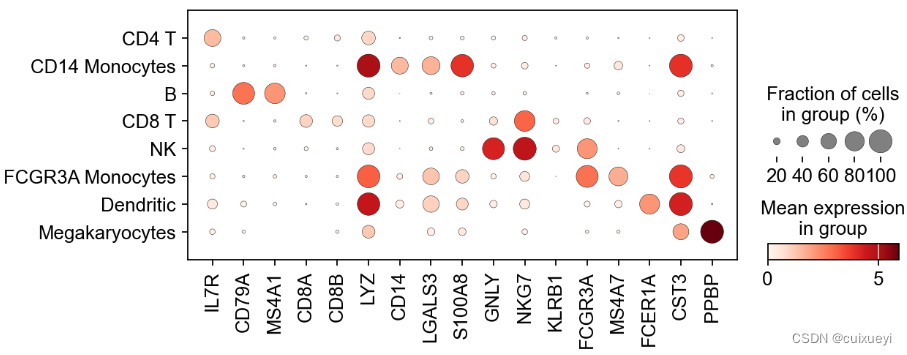
困难重重,继续加油!


 1960
1960

 被折叠的 条评论
为什么被折叠?
被折叠的 条评论
为什么被折叠?
 到【灌水乐园】发言


