


折线图和直方图
第一个程序展示使用一条折线、一组多点标记和位图字符标号来生成一年内按月的折线图。尽管等宽字体与图中的位置比较容易对齐,但此处给出了比例空间的字体。由于位图左下角提供了当前光栅位置的参考,所以我们必须移动参考位置以使文字串中心与绘制数据的位置对齐。图3.67给出了折线图程序的输出。

#include <GL/glut.h>


GLsizei winWidth = 600, winHeight = 500;  //Initial display window size.
GLint xRaster = 25, yRaster = 150;        // Initialize raster position.


GLubyte label [36] = { 'J', 'a', 'n',  'F', 'e', 'b',  'M', 'a', 'r',
                       'A', 'p', 'r',  'M', 'a', 'y',  'J', 'u', 'n',
					   'J', 'u', 'l',  'A', 'u', 'g',  'S', 'e', 'p',
					   'O', 'c', 't',  'N', 'o', 'v',  'D', 'e', 'c'};


GLint dataValues [12] = {420, 342, 324, 310, 262, 185,
                        190, 196, 217, 240, 312, 438};

void init (void)
{
    glClearColor (1.0, 1.0, 1.0, 1.0);  //White display window.
    glMatrixMode (GL_PROJECTION);
	gluOrtho2D (0.0, 600.0, 0.0, 500.0);
}


void lineGraph (void)
{
    GLint month, k;
	GLint x = 30;                    // Initialize x position for chart.
	glClear (GL_COLOR_BUFFER_BIT);   // Clear display window.
	glColor3f (0.0, 0.0, 1.0);       // Set line color to blue.
	glBegin (GL_LINE_STRIP);         // Plot data as a polyline.
	    for (k = 0; k < 12; k++)
		    glVertex2i (x + k * 50, dataValues [k]);
	glEnd ();

	glColor3f (1.0, 0.0, 0.0);       // Set marker color to red.
	for (k = 0; k < 12; k++){        // Plot data as asterisk polymarkers.
	    glRasterPos2i (xRaster + k * 50, dataValues [k] - 4);
		glutBitmapCharacter (GLUT_BITMAP_9_BY_15, '*');
	}

	glColor3f (0.0, 0.0, 0.0);       // Set test color to black.
	xRaster = 20;                    // Display chart labels.
	for (month = 0; month < 12; month++) {
	    glRasterPos2i (xRaster, yRaster);
		for (k = 3 * month; k < 3 * month + 3; k++)
		    glutBitmapCharacter (GLUT_BITMAP_HELVETICA_12, label [k]);
		xRaster += 50;
	}
	glFlush ( );
}


void winReshpeFcn (GLint newWidth, GLint newHeight)
{
    glMatrixMode (GL_PROJECTION);
	glLoadIdetity ( );
	gluOrtho2D (0.0, GLdouble (newWidth), 0.0, GLdouble (newHeight));
	glClear (GL_COLOR_BUFFER_BIT);


}


void main (int argc, char** argv)
{
    glutInit (&argc, argv);
	glutInitDisplayMode (GLUT_SINGLE | GLUT_RGB);
	glutInitWindowPosition (100, 100);
	glutInitWindowSize (winWidth, winHeight);
	glutCreateWindow ("Line Chart Data Plot");

	init ( );
	glutDisplayFunc (lineGraph);
	glutReshapeFunc (winReshpeFcn);

	glutMainLoop ( );
}
第二个程序使用同样的数据集生成图3.68所示的直方图。该程序展示了矩形填充区及位图字符标号的应用。
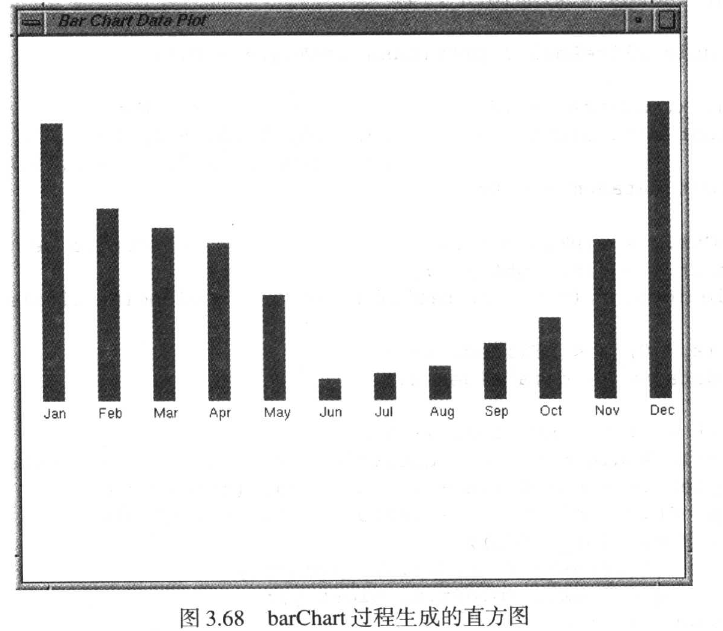
void barChart (void)
{
    GLint month, k;
	glClear (GL_COLOR_BUFFER_BIT); // Clear display window.
	glColor3f (1.0, 0.0, 0.0);     // Set bar color to red.
	for (k = 0, k < 12; k++)
	    glRecti (20 + k * 50, 165, 40 + k * 50, dataValues [k]);
	glColor3f (0.0, 0.0, 0.0);     // Set text color to black.
	xRaster = 20;                  // Display chart labels.
	for (month = 0; month < 12; month++){
	    glRasterPos2i (xRaster, yRaster);
		for (k = 3 * month; k < 3 * month + 3; k++)
		    glutBitmapCharacter (GLUT_BITMAP_HELVETICA_12, label [h]);
		xRaster += 50;
	}
	glFlush ( );


}


 2167
2167

 被折叠的 条评论
为什么被折叠?
被折叠的 条评论
为什么被折叠?
 到【灌水乐园】发言


