


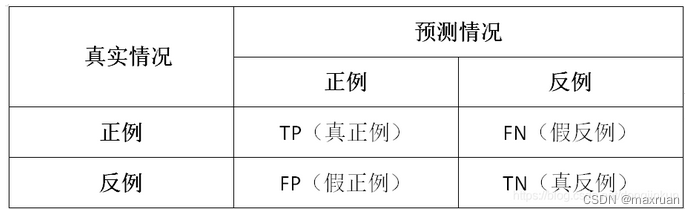
1、 TP、FP、TN、FN 概念
在对数据进行预测的时候,往往有以下几个概念:TP、FP、TN、FN。
什么意思呢?即预测情况(Positive or Negtive)是否真正反应真实情况的关系:
看下面这解析你就懂了!
TP:True Positive, 预测的是正样本,且正确预测。
FP:False Positive, 预测的是正样本,但错误预测。 即误检
TN:True Negative, 预测的是负样本,且正确预测。
FN:False Negative,预测的是负样本,但错误预测。 即漏检
扩展:
TP+FN:正样本的总和,正确检测正样本 + 漏检数。
FP+TN:负样本的总和,正确检测负样本 + 误检数。
TP+TN:正确分类总和,正确检测正样本 + 正确检测负样本
Accuracy:准确率, 即预测的准确程度,
Accuracy = (TP + TN) / (TP + FP + TN +FN)
即正确预测数 / 样本总数。但是Accuracy 不经常使用,因为我们在做目标预测的时候往往只关心正样本,而不去关心负样本是否正确预测。
2、 目标框检测准确率、召回率
目标检测输出框为预测框,预测框中有正确检测(TP)和误检(FP),以及 漏检(FN)
1、Percision: 准确率, 所有预测样本中,准确预测的概率。因为只预测正样本,所有认为预测到的样本均为Positive。
Percision = TP / (TP + FP)
2、Recall: 召回率, 所有正真实正样本中,被正确预测的概率。
Recall = TP / (TP + FN)
那目标检测中怎么才算正确预测呢?一般用 IOU 进行匹配,预测框和真实框之间的 IOU 值大于一定阈值时,比如0.5,则认为对真实样本正确预测。
既然有了准召率,为什么还要AP呢?
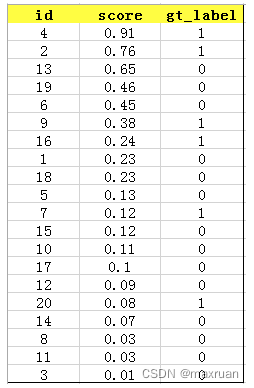
2、 AP、MAP
假设我们对某一个类别(比如 person)预测,每一个预测box都有一个置信度score 和 和label是否正确。 按score排序后有如下:
AP: Average Precision
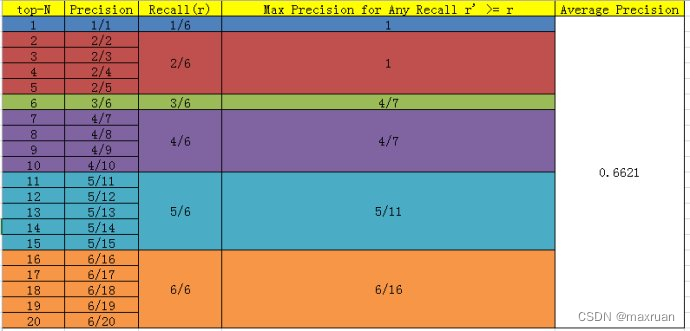
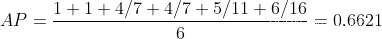
假设有M个真值正样本,我们从Top-1 到 Top-N,每累积一个预测就会对应一个recall 和 一个 precision。从Top-1 到 Top-N后可以有M个recall值。分别为(1/M,2/M,…,M/M),对每一个recall,从对应的precision 中取最大值作为当前recall 对应的precision,求M 个precision的平均得到AP。
AP表示训练出来的模型在当前类别上的好坏。
mAP : mean AP
将所有类别的AP求平均即可。
3、 P-R曲线的绘制
想要计算AP,必须先得绘制P-R 曲线。
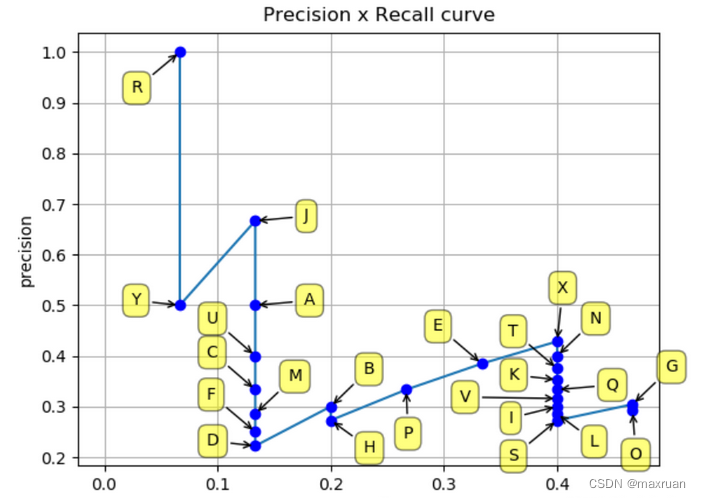
1、描点法绘制Precision-Recall图
2、所有点插值法(interpolation performed in all points)
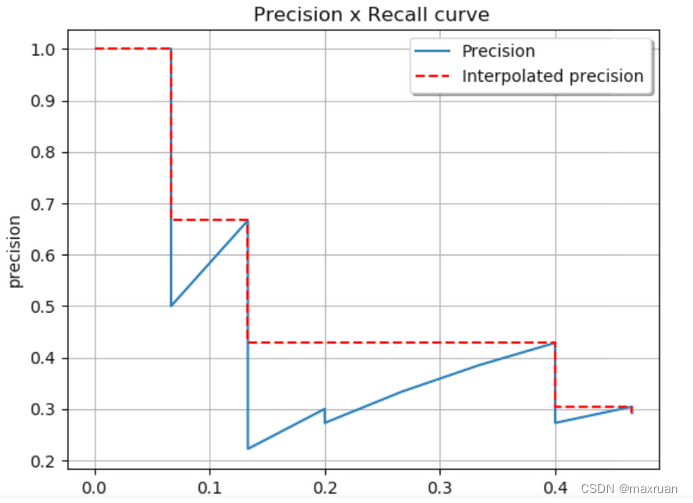
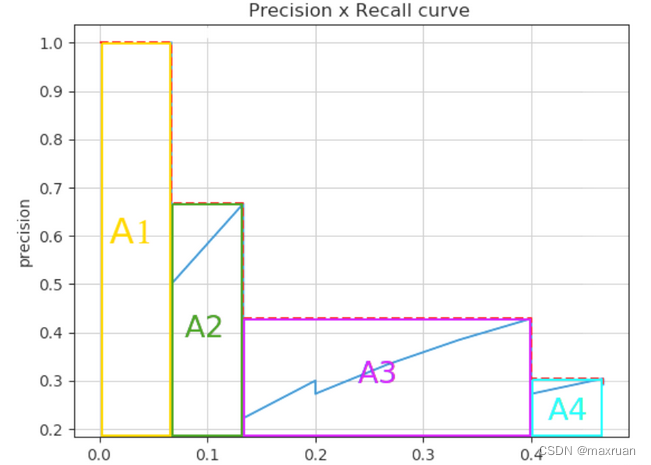
经过插值后,M 个矩形面积即为AP值。
原始AP定义为:
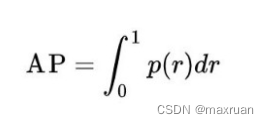 实际上我们都是用矩形插值方式进行近似计算。
代码如下:
import os
import numpy as np
import json
import cv2 as cv

def xyhw2xyxy(xyhw):
    x1 = xyhw[0] - xyhw[2] / 2
    y1 = xyhw[1] - xyhw[3] / 2
    x2 = xyhw[0] + xyhw[2] / 2
    y2 = xyhw[1] + xyhw[3] / 2
    return [x1, y1, x2, y2]

def load_pt(json_file):
    # load pt from json files,
    # get N x 6, 0:4 bbox, 4:conf 5:class
    content = json.load(open(json_file, 'r', encoding="utf-8"))
    if content is None:
        return None
    targes = content['targets']
    tar_len = len(targes)
    targets_pt = []
    for i in range(tar_len):
        # print(targes[i])
        classid = []
        conf = []
        conf.append(targes[i]['conf'])
        classid.append(targes[i]['classid'])
        x1y1x2y2 = xyhw2xyxy(targes[i]['rect'])
        targets_pt.append(x1y1x2y2 + conf + classid)
    return np.array(targets_pt)


def load_gt(txt_file, H, W):
    # load gt from txt files, yolo format,
    # get N x 5, 0: label 1:5 bbox
    f = open(txt_file)
    lines = f.readlines()
    targets = []
    for line in lines:
        contents = line.strip(" ").strip("\n").split(" ")
        contents = [float(x) for x in contents]
        # print(contents)
        class_id = contents[0]
        cx = contents[1] * W
        cy = contents[2] * H
        pw = contents[3] * W
        ph = contents[4] * H
        x1y1x2y2 = xyhw2xyxy([cx, cy, pw, ph])
        targets.append([class_id, x1y1x2y2[0], x1y1x2y2[1], x1y1x2y2[2], x1y1x2y2[3]])
    return np.array(targets)


def calc_iou(bbox1, bbox2):
    if not isinstance(bbox1, np.ndarray):
        bbox1 = np.array(bbox1)
    if not isinstance(bbox2, np.ndarray):
        bbox2 = np.array(bbox2)
    xmin1, ymin1, xmax1, ymax1, = np.split(bbox1, 4, axis=-1)
    xmin2, ymin2, xmax2, ymax2, = np.split(bbox2, 4, axis=-1)
    area1 = (xmax1 - xmin1) * (ymax1 - ymin1)
    area2 = (xmax2 - xmin2) * (ymax2 - ymin2)
    ymin = np.maximum(ymin1, np.squeeze(ymin2, axis=-1))
    xmin = np.maximum(xmin1, np.squeeze(xmin2, axis=-1))
    ymax = np.minimum(ymax1, np.squeeze(ymax2, axis=-1))
    xmax = np.minimum(xmax1, np.squeeze(xmax2, axis=-1))
    h = np.maximum(ymax - ymin, 0)
    w = np.maximum(xmax - xmin, 0)

    intersect = h * w
    union = area1 + np.squeeze(area2, axis=-1) - intersect
    return intersect / union


def ap_per_class(tp, conf, pred_cls, target_cls, plot=False, save_dir='.', names=()):
    # Sort by objectness
    i = np.argsort(-conf)
    tp, conf, pred_cls = tp[i], conf[i], pred_cls[i]
    # Find unique classes
    unique_classes = np.unique(target_cls)
    nc = unique_classes.shape[0]  # number of classes, number of detections
    # Create Precision-Recall curve and compute AP for each class
    px, py = np.linspace(0, 1, 1000), []  # for plotting
    ap, p, r = np.zeros((nc, tp.shape[1])), np.zeros((nc, 1000)), np.zeros((nc, 1000))
    for ci, c in enumerate(unique_classes):
        i = pred_cls == c
        # print(" pred_cls = ", pred_cls)
        n_l = (target_cls == c).sum()  # number of labels
        n_p = i.sum()  # number of predictions

        if n_p == 0 or n_l == 0:
            continue
        else:
            # Accumulate FPs and TPs
            fpc = (1 - tp[i]).cumsum(0)
            tpc = tp[i].cumsum(0)
            # Recall
            recall = tpc / (n_l + 1e-16)  # recall curve
            # print(" recall = ", recall)
            r[ci] = np.interp(-px, -conf[i], recall[:, 0], left=0)  # negative x, xp because xp decreases
            # Precision
            precision = tpc / (tpc + fpc)  # precision curve
            p[ci] = np.interp(-px, -conf[i], precision[:, 0], left=1)  # p at pr_score
            # AP from recall-precision curve
            for j in range(tp.shape[1]):
                ap[ci, j], mpre, mrec = compute_ap(recall[:, j], precision[:, j])
                if plot and j == 0:
                    py.append(np.interp(px, mrec, mpre))  # precision at mAP@0.5
    # Compute F1 (harmonic mean of precision and recall)
    f1 = 2 * p * r / (p + r + 1e-16)
    i = f1.mean(0).argmax()  # max F1 index
    return p[:, i], r[:, i], ap, f1[:, i], unique_classes.astype('int32')


def compute_ap(recall, precision):
    # Append sentinel values to beginning and end
    mrec = np.concatenate(([0.], recall, [recall[-1] + 0.01]))
    mpre = np.concatenate(([1.], precision, [0.]))
    # Compute the precision envelope
    mpre = np.flip(np.maximum.accumulate(np.flip(mpre)))
    # Integrate area under curve
    method = 'interp'  # methods: 'continuous', 'interp'
    if method == 'interp':
        x = np.linspace(0, 1, 101)  # 101-point interp (COCO)
        ap = np.trapz(np.interp(x, mrec, mpre), x)  # integrate
    else:  # 'continuous'
        i = np.where(mrec[1:] != mrec[:-1])[0]  # points where x axis (recall) changes
        ap = np.sum((mrec[i + 1] - mrec[i]) * mpre[i + 1])  # area under curve
    return ap, mpre, mrec


## 评测一张图片
def value_one(pts, gts):
    iouv = np.linspace(0.5, 0.95, 10)  # iou vector for mAP@0.5:0.95
    niou = iouv.shape[0]
    correct = np.zeros((pts.shape[0], niou), dtype=np.bool)
    nl = len(gts)
    tcls_tensor = gts[:, 0]
    tcls = gts[:, 0].tolist() if nl else []  # target class
    for cls in np.unique(tcls_tensor):
        ti = (cls == (gts[:, 0]).astype(np.uint8)).nonzero()[0]  # prediction indices
        pi = (cls == (pts[:, 5]).astype(np.uint8)).nonzero()[0]  # target indices
        if len(pi > 0):
            IOUS = calc_iou(pts[pi, :4], gts[ti, 1:5])
            ious = IOUS.max(1)
            iid = IOUS.argmax(1)
            detected = []
            detected_set = set()
            for j in ((ious > iouv[0]).nonzero()[0]):
                d = ti[iid[j]]
                if d.item() not in detected_set:
                    detected_set.add(d.item())
                    detected.append(d)
                    correct[pi[j]] = ious[j] > iouv  # iou_thres is 1xn
                    if len(detected) == nl:  # all targets already located in image
                        break
    return correct, pts[:, 4], pts[:, 5], tcls


if __name__ == "__main__":
    img_dir = "../images/"
    predict_dir = "../jsons/"
    target_dir = "../labels/"
    img_H = 540
    img_W = 960
    colors = {0: (255, 0, 0), 1: (0, 255, 0), 2: (0, 0, 255), 3: (255, 255, 0),
              4: (255, 0, 255), 5: (0, 255, 255), 6: (255, 255, 255)}
    types = {0: 'person', 1: 'bike', 2: 'car', 3: 'motor', 4: 'bus', 5: 'truck'}
    predict_list = os.listdir(predict_dir)
    jdict, stats, ap, ap_class, wandb_images = [], [], [], [], []
    n = 0
    # value all images
    for predict_name in predict_list:
        predict_path = os.path.join(predict_dir, predict_name)
        target_path = os.path.join(target_dir, predict_name).replace(".json", ".txt")
        if not os.path.exists(target_path):
            print("error : ", target_path)
            continue
        pts = load_pt(predict_path)  # 加载predict
        if pts is None:
            continue
        gts = load_gt(target_path, img_H, img_W)  # 加载target
        if gts.shape[0] == 0:
            continue

        # img_path = os.path.join(img_dir, predict_name).replace(".json", ".jpg")
        # img = cv.imread(img_path)
        # for pt in pts:
        #     type1 = int(pt[5])
        #     #图片, 左上角, 右下角, 颜色, 线条粗细, 线条类型,点类型
        #     cv.rectangle(img, (int(pt[0]), int(pt[1])), (int(pt[2]),int(pt[3])), colors[type1], 1, 4, 0)
        # for gt in gts:
        #     type2 = int(gt[0])
        #     #cv.rectangle(img, (int(gt[0]), int(gt[1])), (int(gt[2]), int(gt[3])), colors[type2], 1, 4, 0)
        # cv.imshow("img", img)
        # cv.waitKey(0)

        # Append statistics (correct, conf, pcls, tcls)
        correct, conf, pcls, tcls = value_one(pts, gts)  # value one
        stats.append((correct, conf, pcls, tcls))  # add value one result
        n += 1
    #### after load all images ####
    print(" n = ", n)
    stats = [np.concatenate(x, 0) for x in zip(*stats)]  # to numpy
    if len(stats) and stats[0].any():
        print(" res : ")
        p, r, ap, f1, ap_class = ap_per_class(*stats, plot=False, save_dir="./", names="hello")
        print("p = ", p)
        print("r = ", r)
        print("ap = ", ap)
        ap50, ap = ap[:, 0], ap.mean(1)  # AP@0.5, AP@0.5:0.95
        mp, mr, map50, map = p.mean(), r.mean(), ap50.mean(), ap.mean()
        print("mp = ", mp)
        print("mr = ", mr)
        print("map50 = ", map50)
        print("map = ", map)


 2173
2173

 被折叠的 条评论
为什么被折叠?
被折叠的 条评论
为什么被折叠?
 到【灌水乐园】发言


