


我们已经在《OpenCV-Python实战(9)——OpenCV用于图像分割的阈值技术》中介绍了图像阈值技术,由于图像阈值技术是许多计算机视觉应用中的关键步骤,因此许多算法库中都包含阈值技术,其中就包括 scikit-image。 scikit-image 是用于图像处理的算法包,其详细介绍可以参考官方网站,由 scikit-image 操作的图像需要先转换为 NumPy 数组。
在本文中,我们将利用 scikit-image 实现阈值技术。如果还没有安装 scikit-image 库,首先需要使用以下命令安装 scikit-image:
pip install scikit-image
为了在 scikit-image 中使用阈值算法,我们以 Otsu 的二值化算法对测试图像进行阈值处理为例进行介绍。第一步是导入所需的包:
from skimage.filters import threshold_otsu
from skimage import img_as_ubyte
然后使用 scikit-image 应用 Otsu 的二值化算法:
加载图像
image = cv2.imread(‘example.png’)
gray_image = cv2.cvtColor(image, cv2.COLOR_BGR2GRAY)
hist = cv2.calcHist([gray_image], [0], None, [256], [0, 256])
基于 otsu 方法的返回阈值
thresh = threshold_otsu(gray_image)
生成布尔数组:
binary = gray_image > thresh
转换为uint8数据类型
binary = img_as_ubyte(binary)
可视化
def show_img_with_matplotlib(color_img, title, pos):
img_RGB = color_img[:, :, ::-1]
ax = plt.subplot(2, 2, pos)
plt.imshow(img_RGB)
plt.title(title, fontsize=8)
plt.axis(‘off’)
def show_hist_with_matplotlib_gray(hist, title, pos, color, t=-1):
ax = plt.subplot(2, 2, pos)
plt.xlabel(“bins”)
plt.ylabel(“number of pixels”)
plt.xlim([0, 256])
plt.axvline(x=t, color=‘m’, linestyle=‘–’)
plt.plot(hist, color=color)
show_img_with_matplotlib(image, “image”, 1)
show_img_with_matplotlib(cv2.cvtColor(gray_image, cv2.COLOR_GRAY2BGR), “gray img”, 2)
show_hist_with_matplotlib_gray(hist, “grayscale histogram”, 3, ‘m’, thresh)
show_img_with_matplotlib(cv2.cvtColor(binary, cv2.COLOR_GRAY2BGR), “Otsu’s binarization (scikit-image)”, 4)
plt.show()
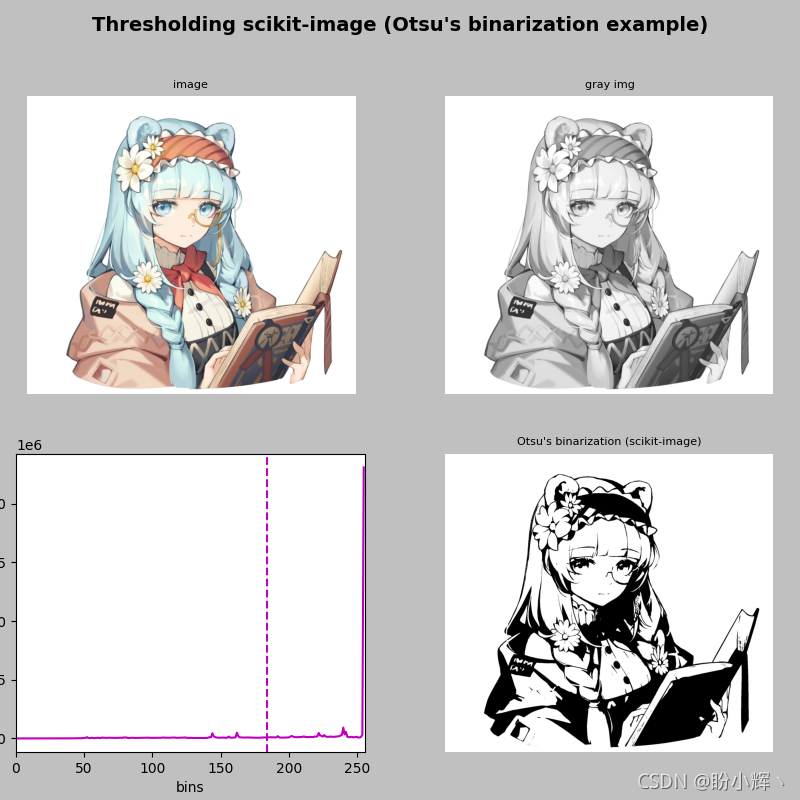
threshold_otsu(gray_image) 函数根据 Otsu 的二值化算法返回阈值。之后,使用此值构建二进制图像( dtype= bool ),最后应将其转换为 8 位无符号整数格式( dtype=uint8 )以进行可视化,使用img_as_ubyte() 函数完成转换过程。
程序输出如下图所示:
接下来,介绍下如何使用 scikit-image 中的一些其它阈值技术。
接下来,将对比 Otsu、triangle、Niblack 和 Sauvola 阈值技术进行阈值处理的不同效果。 Otsu 和 triangle 是全局阈值技术,而 Niblack 和 Sauvola 是局部阈值技术。当背景不均匀时,局部阈值技术则是更好的方法阈值处理方法。
同样的,第一步是导入所需的包:
from skimage.filters import threshold_otsu, threshold_triangle, threshold_niblack, threshold_sauvola
from skimage import img_as_ubyte
import cv2
import matplotlib.pyplot as plt
调用每个阈值方法( threshold_otsu()、threshold_niblack()、threshold_sauvola() 和 threshold_triangle() ),以使用 scikit-image 对比执行阈值操作:
Otsu
thresh_otsu = threshold_otsu(gray_image)
binary_otsu = gray_image > thresh_otsu
binary_otsu = img_as_ubyte(binary_otsu)
Niblack
thresh_niblack = threshold_niblack(gray_image, window_size=25, k=0.8)
binary_niblack = gray_image > thresh_niblack
binary_niblack = img_as_ubyte(binary_niblack)
Sauvola
thresh_sauvola = threshold_sauvola(gray_image, window_size=25)
binary_sauvola = gray_image > thresh_sauvola
binary_sauvola = img_as_ubyte(binary_sauvola)
triangle
thresh_triangle = threshold_triangle(gray_image)
binary_triangle = gray_image > thresh_triangle
binary_triangle = img_as_ubyte(binary_triangle)
文末有福利领取哦~
👉一、Python所有方向的学习路线
Python所有方向的技术点做的整理,形成各个领域的知识点汇总,它的用处就在于,你可以按照上面的知识点去找对应的学习资源,保证自己学得较为全面。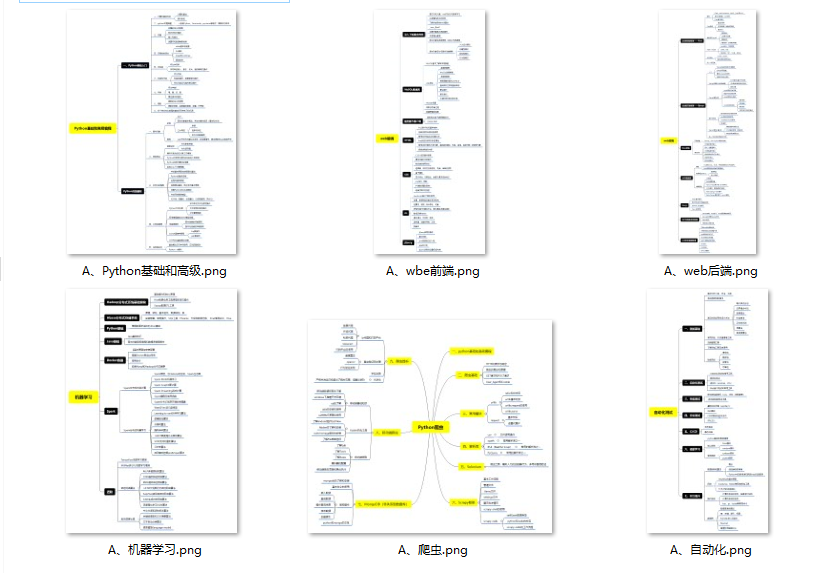
👉二、Python必备开发工具
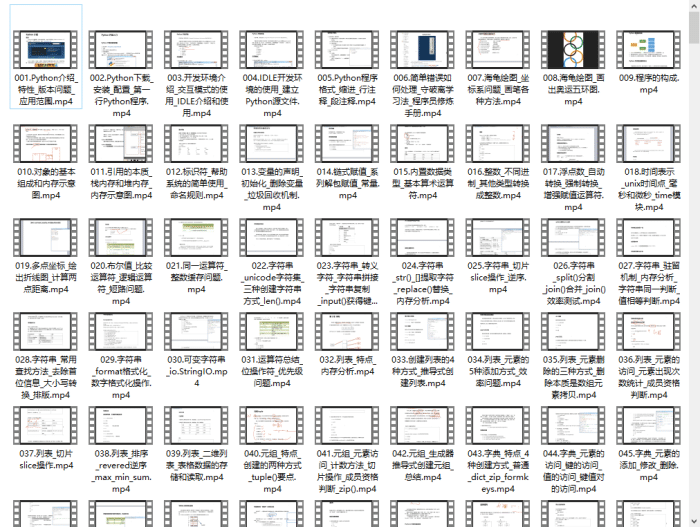
👉三、Python视频合集
观看零基础学习视频,看视频学习是最快捷也是最有效果的方式,跟着视频中老师的思路,从基础到深入,还是很容易入门的。
👉 四、实战案例
光学理论是没用的,要学会跟着一起敲,要动手实操,才能将自己的所学运用到实际当中去,这时候可以搞点实战案例来学习。(文末领读者福利)
👉五、Python练习题
检查学习结果。
👉六、面试资料
我们学习Python必然是为了找到高薪的工作,下面这些面试题是来自阿里、腾讯、字节等一线互联网大厂最新的面试资料,并且有阿里大佬给出了权威的解答,刷完这一套面试资料相信大家都能找到满意的工作。

👉因篇幅有限,仅展示部分资料,这份完整版的Python全套学习资料已经上传
网上学习资料一大堆,但如果学到的知识不成体系,遇到问题时只是浅尝辄止,不再深入研究,那么很难做到真正的技术提升。
一个人可以走的很快,但一群人才能走的更远!不论你是正从事IT行业的老鸟或是对IT行业感兴趣的新人,都欢迎加入我们的的圈子(技术交流、学习资源、职场吐槽、大厂内推、面试辅导),让我们一起学习成长!


 7449
7449


 被折叠的 条评论
为什么被折叠?
被折叠的 条评论
为什么被折叠?
 到【灌水乐园】发言


